Journal of Ergonomics
Open Access
ISSN: 2165-7556
ISSN: 2165-7556
Research Article - (2025)Volume 15, Issue 3
Third-world countries do not take into account work-study interventions in the manufacturing sector. As a result, it causes loss of labor hours due to induced musculoskeletal disorders. This study introduces alternative designing and mathematical algorithms for improving pre-modified processes and choosing an optimal economic and healthy working environment for labor. The algorithm has two main aspects, selecting efficient work design and calories consumption. An efficient design is determined based on lifting index value and calculates calories consumption while working on the method chosen. Results show that choosing an efficient working design reduces work energy consumption. The improved work design parameters bring the life ting index from 3 to 1.5. Energy consumption per shift from actual design to improved design is reduced from 2186 to 1986 kilocalories, respectively. In the end, this study calculated to require the amount of weight of specific food item to eat for daily calories consumption recovery.
Work environment; Electromyography; Supply chain network; Fuel consumption; NIOSH equation
Poor manual materials handling has been a significant cause of induced musculoskeletal disorders in workers, especially in thirdworld countries. Along with work stoppages, their fatigues come in a short time, causing working line abnormal. If work is in a proper sequence and their activities are predefined with suitable timing, more excellent job performs and with more quality and less fatigue. Completing these studies, the value of the work standards is increasing, and also the worker would feel safe. Work-study has two categories which are "time study" and "motion study" performed in observed. These studies aim to create human comfort, productivity, and safety. Time study is the main factor for working in any environment; performing exemplary work in less time causes the increment in production I-e to increase the quantity and efficiency of work. Piece measuring time takes as standard initially, with which other jobs related to check its efficiency and production level. Except for time standards, it is impossible to be aware of the current performance position. Time standards are taken from the regular person working. Motion study makes the work motions efficient by reducing unnecessary action and making the work motion simple and easy. It identifies the extreme distances and makes the object reachable. After the reduction of redundant movement, the worker does not tire quickly. Redundant movement is less efficient and creates fatigues rapidly. In this study, the time and motion study improves working efficiency by removing redundant activities. Work is carefully analyzed and compared with NIOSH standards and different work motions. Along with the movement, the workload is the central part of this study. The manual material handling analysis in this study causes human anatomical problems. These functional parameters observe, and at the end, calculate the lifting index, which tells us whether the observed working setup is suitable for the worker. It also involves the sequence and the standards according to which the worker performs. The existing work systems are analyzed initially and then compared with the standards, which is simplified. It is mainly performed during the stage when the new facility provides the worker. The internal working parameter study (lifting, load, horizontally load placing, twisting for load lifting, and frequency in load lifting) is observed and designed for labor facilitate to work comfortably. The management gives instructions to a specific sequence of work for the assigned facility if it comes in the budget constraint. The objective of the paper is to study the present work system and the waste in terms of redundancy movement so that it removes nonvalue-adding activities.
Work-study regarding present industry; In the chipboard making industry (Medium-density fiber industries). The wood is lifted and carried towards the machines for chipping. After chipping through the devices, the worker moves lumber to the chips tank for further actions. This study finds out two leading causes. The layout cases in the industry were inefficient, which caused time and fuel wastages for wood-carrying lifters. Case 1; in case 1, the overall working layout is improved, which makes the structure efficient for working. The distance, which reduces with the work design changes, causes the reduction of fuel consumption and extra labor movements.
After a proper engineering calculative algorithm, the layout is selected, which is economical. Most people have solved multifacility layout design with quadratic programming with various objectives. However, the ergonomic intervention is missing in their calculation. Case 2: The machine design and the labor interaction with the machine studies in ergonomically protectives. Labor lift wood and carry it towards the device for chipping, which induces labor fatigue quickly. Energy consumes during work, and it is necessary to know how many calories workers need to eat to recover their body fitness. In this case, the design makes ensures that it is ergonomically suitable and also measures energy consumption. In Figure 3 the worker is lifting a heavy load and also up to an inappropriate high. The worker cannot perform until the shift due to hard work in an unsuitable working area. In this case, the result is brought into the human working range because certain working limits exceed the standards limit. Their activities break down. Activities breakdown helps in pointing out unnecessary motion in the work environment.
This study performs measurements in each section. Workers motion and observed during load (wood) lifting to the chipping machine section. Figure 3 shows the actual working design, in which the NIOSH lifting equation parameters show dimensions. In "Actual case," there are many activities for a single load-lifting, in which workers get fatigued in lesser time. Most research workflow works on simulation, where people use software to run and analyze. Still, there is no information about the external layout and budgetary constraints, and different alternatives. Work breakdown and varying design options in this paper show that data collection also helps to reach the proper and optimal solution for the best and safest workflow selection, along with budget constraints. In the improved process, a few steps are involved in completing the work efficiently and quickly. Alternative one based upon the work-study performs in practical shape with a slight change of belt increment. Alternative 2nd is a little advanced and has more mechanized rollers than the previous one, reducing health risks and being more economical.
Figure 1 shows the methodology used for this study, where a few steps give an efficient work design. Initially, data is collected to calculate the lifting index of the actual procedure. After data collection lifting index NIOSH lifting equation calculates. This lifting index tells whether the design is safe or not for working. If this design is not secure, then changes are made in the design to make it safe. Therefore, the workers are allowed to work on it; while they are workers. This study also performs activities broken down and notes the time taken by each activity. Those activities, which take longer, tend to reduce by facilitating workers (with belt and rollers). After redesigning the work layout, the lifting index is calculated again for design safety. it also performs the energy calculation. It calculates calories burnt while working on the new design. If not so, then the worker losses weight day by day, and in the same way, there is a chance of damaging his health.
Most studies measure muscular fatigues differently, such as checking it through c (EMG) and perceived exertion through the Borg Scale. An increase in manual work induces musculoskeletal disorders [1]. To study the present working system and see that work efficiency and safety are missing, which needs improvement. Either that is mechanization, full mechanization, and automation. It evaluated estimates with different alternatives for the new work environment. Work breakdown is performed for internal activities and observes its timing. There are many activities in breaking down the job. The process is studied and then observing and looking at the wastage of time, whether time-wasting is due to the lazy person or not. Time study for small work breakdown has become a prevailing subject, and it has become a need for the modern industrial working environment. Ergonomic studies perform working design safe for the worker [2]. Now to find the time for them to work, they gave the allowance to them. These allowances are recreational or any other. Benefits of the works study and facilitations motivate, and the employees become happy and approached towards perfection to fulfill its working pace demand, that their work has done on time. Facilities have been considered in previous papers to be useful for the worker. In the form of aisles to reduce timings and create fewer fatigues for the worker during lifting or carrying [3]. Facilities are introduced as an alternative and measure their outcomes, helping in lifting during handling. Initial strategies for a beneficial environment are necessary for the use of long terms of optimal layout where small updating in internal ergonomic designs, for this mixed method is evaluated which helps in changing the working situations of work [4]. In this paper, the numbering system identifies the present condition of the worker's feasible work. Workers also move toward the improvement of work, making the work easy for the worker and safe; if they work continuously improving the environment, it increases production. As it is research, workers do 65% in a dull environment having no incentives and safe and easy work system, 80% performed in the inventive environment. The repetitive work free causes microtrauma. The type of work that affects muscles must perform with more precise timing and proper frequency; exceeding its limits also affects work pace [5]. The importance of a safe working environment observed many studies most relevant to musculoskeletal disorders, and also the backbone issue comes [6]. Human anatomy is very complex and sensitive, which requires proper measures of doing work. Issues to different body posturing come due to lifting load at different heights, horizontal and vertical distances from the place of work. Studies are carried out based on IOSH and NIOSH lifting equations [7];this paper also uses them to select the best working environment for workers. The work-related benefits of these studies increase precisely by choosing the best solutions on different alternatives. Case 1: In this case, some redundant motion created fatigue for workers, like extra load traveling distance. The distance is reduced with the longer belt, causing fuel consumption reduction and also the labor movement. There is a limitation of activities and time study; although optimal places are selected, the work and their study [8]; in this paper, they are both calculated with different alternatives. Case 2: In the wood chopping industry, wood has to be lifted to the conveyor and moved to the machines for chipping. In this case, the labor lifts wood to the conveyor at a high position, inducing fatigue. The work is performed ergonomically in the newly designed workplace; the existing design compares with the new design. The estimated time of ergonomically and actual workplace was different. Therefore, the two-handed assembly activities gave less time to perform work. There is either the ergonomic study or design change in the above research; this paper's design change algorithm depends on the NIOSH lifting technique. It confirms their shift working fatigues [9]. The mathematical technique has been used for the facility layout failure and benchmarked with the other layouts with a budget. The case study here is on the Supply Chain Network (SCN). Facility layout uncertainty for efficient work on optimization techniques based on simulation. Many of the production layouts are critical, and its manufacturing system is necessary to be made optimal. Many activities are involved in them, so it is necessary to use simulation to observe it with other factors. The layout also depends on the product demand bases as here layout is specialized, and the technique used for this research is a fuzzy random theory. A facility having multi objectives like lead time, cost and distance reduces for multi-facility among and within facilities. Their main factors are distance and time spent in material handling. The mathematical quadratic equation technique has had many multi-factors. This study observed musculoskeletal disorders of a different part of the body, of which some of them showed greater pain than the other parts like back pain showed more than the lower parts of the human body. Pain comes in another pattern for the other work layout by doing extra work on the body. NIOSH lifting equation helps to reduce most of these risks to give a design. The factors related to work also produce cardiovascular diseases; it was the goal to find the main factor. Many of the factors like machine type, vibration lengths, weight, and shift were studied in which the environmental effect on workers was not greater than shift work. Material handling also involves all parameters of the NIOSH lifting equation. This study performs the vertebral crosssectional study, especially the lower back part L5/S1, for different male-female ages and weights. The NIOSH equation aims for a better understanding; it performs to field conditions. Video and pictures study the limits of different parameters of the NIOSH lifting equation. In the NIOSH lifting equation, lifting the trunk flexion, the load faced by the lifter exceeds the recommended limit. NIOSH lifting equations know its exact Load acting on L5/S1 vertebral bone during the trunk flexion. A case study is performed on the NIOSH lifting equation on males and females using the surface electromyographic technique. it takes the samples of different activities, and its Roots Mean Square (RMS) takes. This paper reviews the role of NIRS-derived measures in assessing human performance in the workplace by evaluating demands of executing physical actions and performing cognitive tasks in a controlled laboratory environment or the field.
Methods
Figure 1 represents the overall methodology of the research study.

Figure 1: Showing methodology of research followed to selecting alternative.
Variables parameters
Table 1 shows variable for the area and fuel consumption. Parameters used in the mathematical calculation are "length," "width," "area" for each given alternative, where the dimension is related to worker and Lifter. The allocated parts in Figure 2 shows comparative models giving original and modified forms of choice. These modifications, with the help of the facility, are provided to workers. With the help of the given parameter, it is easier to observe Fuel consumption "F.C." with the use of the area.
|
Location |
L |
|
Lifting Index |
LI |
|
Worker |
wr |
|
Alternative |
alt |
|
Average |
avg |
|
Actual |
act |
|
Length |
l |
|
Width |
w |
|
Overall load travelling area |
A |
|
Load travelling area (without belt, and load placement areas) |
Am |
|
Load placement area |
Aq |
|
Actual case, 1st, 2nd, and 3rd alternatives |
0, n, n+1, n+2 |
|
Length and width of an alternative “n” and Location “L”. |
l.w (n,l) |
|
Force |
F |
|
Distance |
D |
|
Load travelling consumption |
LTC |
|
Load lifting consumption |
LLC |
Table 1: Variable parameter used in formulae.
Step 1: Calculating load travelling areas
For the lifting index, it is necessary to calculate all the parameters in the NIOSH lifting equation. Therefore, mathematical calculations calculate each parameter of NIOSH equation. The areas represented in Figure 2 are the boundary of workers. Picking and traveling consume energy in a large amount. Therefore, the larger the site, the more will be the redundant movement. The blue boundary represents the boundaries of workers' Load traveling, inside of which the worker carries the Load towards the machine. In this boundary, the workers manually pick up wood and move towards the belt. Redline represents load travelled with the help of a lifter, bringing it towards workers. The management of the proper work activities movement helps energy saving. The Actual case of industry consumes extra energies, and the industry faces losses because they have no external engineering instructive schedule or discipline by which they optimally use. Equation (1) calculates the load traveling area.

In Equation (1), "L" is used for location, and "n" for the alternative, which is variables, it changes with location and choice. In this algorithm for the actual scenario, "n" is always taken as equal to zero “0”. Equation 1 calculates existing working areas for the lifters and labor. Lifter's load-lifting area in location 1 shown in Figure 2 has its lengths and width given by Equation (1) calculating this area it comes out to be 1800 m2.

Figure 2: This figure shows the workers load travelling areas.
Formula for the load travelling area calculation formulae in Equations 2, 3, and 4 calculate the working areas of their relevant alternative. The brown area represents the horizontal distance (load placement area) which is 15 inches (0.381 meters) in the actual design in the Table 2. Placement or brown area "Aq" remove area from the overall working area. Alternative 1st and 2nd belt and load, remove placement areas to calculate the load traveling areas, the size of interest. These formulae help in calculating energy consumption while working.
| Alternatives | Load travelling area formula | |
|---|---|---|
| Actual design | Aream(0,L)=((l.w)-lbwb-Aq)(0,L) | Eq (2) |
| 1st | Aream(1,L)=((l.w)-lbwb-Aq)(1,L) | Eq (3) |
| 2nd | Aream(2,L)=((l.w)-lbwb-Aq)(2,L) | Eq (4) |
| Actual design load travelling area (Meter square) | |||||||
|---|---|---|---|---|---|---|---|
| Overall area | Belt (Subtracting areas) | Load travelling area Am(O,L) | |||||
| Length l(0,n) | Width W(0,n) | Overall area A(0,n) | Length lb(0,n) | Width Wb(0,n) | Area Ab(0,n) | ||
| Location 1 Am(0,1) | 50 | 36 | 1800 | ||||
| Location 2 Am(0,2) |
12 | 28 | 336 | 0.6 | 7 | 4.2 | 333.8 |
| Location 3 Am(0,3) |
30 | 14 | 420 | 0.6 | 7 | 4.2 | 415.8 |
Table 2: This table shows load travelling areas of each working design.
Figure 4 load traveling area is mentioned in yellow, labeled with length and width from the actual working design of Figure 2. Dimension calculates the site, which represents the load-carrying energy-consuming area. Load traveling area in part A compared with part B is more remarkable, which means labor performs more effort in part A.
Step 2: Measuring parameter regarding NIOSH lifting equation of actual design (Present work design)
Work-study for shop floors is used in this study to bring working conditions into a comfort level. The vertical, horizontal, distance covered frequency, and the coupling has their multiplier, which are parameters of the NIOSH lifting equation, and these parameters are in Figure 3. The lifting index is the value that observes the risk of the worker. Reaching LI to 2.5 is dangerous; above this, the working environment is not suitable for the worker "LI=Load weight/Recommended weight limit." Checking the body movement and the layout arrangement of worker's horizontal "H," vertical, distance covered by the hand "D," frequency of lift "F," and hand's coupling "C" are measured for each of the four workers. All these values are shown in Table 3, taken from the actual working design in Figure 4. it calculated each of these postures of the worker During working. Some of the workers have the same kind of posture. The horizontal distance is from the leg's ankle to the center of the hand.

Figure 3: Actual worker machine interaction design, regarding load lifting and carrying to the machine.
Step 3: Calculating travelling distance
Table 3 shows that load-carrying takes a long time; therefore, it needs to be shorter. In this case, workers carry load randomly from the wood store towards the machine. Thus, this case is categorized in aimlessly traveling areas. The traveling distance is smaller in some areas and more significant in other areas. Few steps are involved in figuring this type of area. 1st and in the second step, the site is converted into a rectangular shape, as shown in Figure 4 (load traveling area without belt). And in the 3rd step, Equation (5) is used to calculate the load traveling distance. In this Equation, the industry tends to maintain the width of the area as 28 meters. Therefore, the length in Equation (5) is a parameter of interest which is unknown. This length is the load traveling distance in which the workers carry the load at each side of the machine belt. This distance is used in the lifting index calculation in the NIOSH equation as distance as shown in the third row of Table 4.
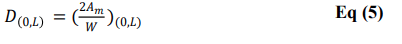

Figure 4: Shows load travelling areas of actual industrial design.
Step 4: Calculating lifting frequency
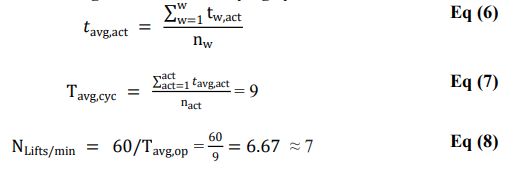
To calculate lifting frequency for the NIOSH lifting equation, the efficient way to is to note the activity timings. For the timing of each activity, it is necessary to divide the work cycle into small actions, which calculates the cycle time for worker 1, as Table 3 shows, which calculates the average time of each activity. Table 3 in the actual design, as shown in, Equation (6), is used. After calculating the average activity time "tavg,act" of each activity, the overall cycle time "Tavg,cyc" (shown in Equation (7)) is calculated, which is 9 in Table 3. Furthermore, the frequency lifts per minute are calculated from average cycle time, ultimately the lifting frequency in the NIOSH lifting equation. This average number, 9, estimates the number of load lifts per minute or frequency charge of all workers, which come as 6.67 lifts per minute or approximately as 7, calculated from Equation (8) (Figure 5).

Figure 5: Shows activities and their timing of each load carrying cycle.
| Actual working design normal working time | |||||
| Workers | |||||
| Activities | 1 | 2 | 3 | 4 | Average time |
| Going for wood | 2 | 2 | 3 | 4 | 2.75 |
| Inspection | 1 | 1 | 0.5 | 1 | 0.875 |
| Wood selection | 1 | 0.5 | 0.5 | 1 | 0.75 |
| Wood lifting | 2 | 1 | 2 | 0.5 | 1.375 |
| Load carrying towards machine | 2 | 3 | 3 | 2 | 2.5 |
| Unloading to belt | 1 | 0.5 | 1 | 0.5 | 0.75 |
| Average time to complete one cycle | 9 | 8 | 10 | 9 | 9 |
| Lifts per minute (Tavg,cyc) | 6.67 | 7.5 | 6 | 6.66667 | 6.67 |
Table 3: This table shows time taken by each activity.
Step 5: Calculating lifting index
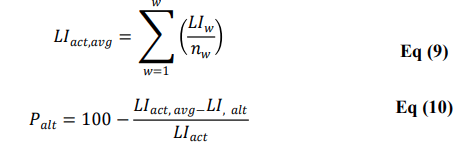
The traveling distance and lifting frequency of the actual industrial design calculate the lifting index. This number will tell the condition of the present work design of the industry. Data analysis for the load lifters improve working efficiency using standard NIOSH formulation. Table 4 shows the NIOSH equation's parametric values, which the industrial worker is following. The worker lifts load (wood) to the machine belt as shown in Figure 3 to above vertical height and places it with some horizontal distance while covering some load traveling distance toward the machine belt. Some parameters exceed the safety limit in this design, and the worker also performs these activities inappropriately. Like load is lifting more time than it is required. Therefore, these parametric values give a greater lifting index than 3. The lifting index's importance should not be to increase from the 3. Because lifting values greater than 3 or 2.5 is not suitable for the workers' health. To know that whether the design is safe for the given four workers, the average lifting indexes “LI0,Avg” is calculated in Table 4, and Equation (9) is used for this calculation. And also, to know whether the newly suggested design is improved or not, for this purposes Equation (10) calculates the percentage improvement of the changed scenario.
| Actual state | ||||||||
| Worker 1 | Worker 2 | Worker 3 | Worker 4 | |||||
| Lifting Dimensions | Inputs | Multiplier | Inputs | Multiplier | Inputs | Multiplier | Inputs | Multiplier |
| Horizontal location (min 10 m max 25") | 15 | 0.67 | 15 | 0.67 | 14 | 0.71 | 16 | 0.63 |
| Vertical location (min 0, max 70") | 42 | 0.92 | 42 | 0.92 | 42 | 0.92 | 42 | 0.92 |
| Travel distance (min 10, max 70") | 233 | 0.83 | 213 | 0.83 | 213 | 0.83 | 213 | 0.83 |
| Angel of symmetry (min 0, max 135") | 25 | 0.91 | 25 | 0.91 | 30 | 0.9 | 30 | 0.9 |
| Coupling (1=good, 2=fair, 3=poor) | 2 | 1 | 2 | 1 | 2 | 1 | 2 | 1 |
| Frequency (min 0, max 15 lifts/min) | 7 | 0.7 | 7 | 0.88 | 7 | 0.88 | 7 | 0.8 |
| Average lifting load | 16 | 17 | 13 | 15 | ||||
| Recommended Weight Limit (RWL) | 5.17 | 6.94 | 5.55 | 5.16 | ||||
| Lifting Index (LI) | 3.1 | 2.45 | 2.34 | 2.91 | ||||
| Average lifting index for actual working design | 2.7 | |||||||
Table 4: This table shows the lifting index calculation of the actual or present working design of the industry.
Changes in actual design (Alterative 1, and 2)
Alternative 1 and 2 represents the changes made in existing working designs. Which removes the unnecessary motions. Figure 6 shows the differences in the worker's safety, where loadcarrying distance reduces with modification. In part A in Figure 6 belt has grown in length, while in part B, the rollers are attached to minimize the effort. The effect from the following

Figure 6: Changes made in actual design for lifting index to be reduced.
Step 6: 1st change in design
The lifting index in Table 5 is greater than 2, which is unsafe for work. Due to this reason, possible changes in the design parameters need to bring the lifting index up to the safe limit. It is necessary to change according to the industrial layout limits because the industry has its limitations for changing parameters. The changes in the vertical (load-lifting distance), load traveling distances are made, which ultimately reduced the working time and increased the number of lifts. Also, it is essential to observe that which activity takes maximum time because the time tells the extra distance covered by a worker. Therefore, reducing the extra traveling distance taken by an exercise helps to reduce the lifting index. After observing the activity timing from Table 5, it is watchable that the load traveling area is taken longer due to the shorter belt. The belt is increased to possible area limits to reduce the load traveling distance. As shown in Figure 7, it grows to 22 meters, which ultimately facilitates more area for a worker to put the load on it.

Figure 7: Shows location dimension for each of their respective alternative.
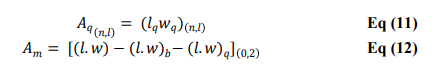
The brown line in the Figure 7 shows the load placement area 'Aq’, in Equation (11), where the worker becomes still to put the Load on the belt. Labors are associated with locations "2" and "3" in Figure 7, in which yellow and brown color Equation (12) (belt and load placement area) are subtracted from locations 2 and 3. For worker load traveling area in location 2, the Equation (12) estimates load-carrying area. The belt's size and load placement are removed in the calculation because it is that area where there is no load traveled. The algorithm also defines the obstacles that are not concerned with the load-carrying area and are omitted or subtracted. For location 3 (Worker load-carrying area), where the subtraction applies to it is given as (A(0,3)−Ab(0,3)) shown in Figure 2 for location 3 [(l,w)−(l,w)b− (l,w)q)](0,3) calculates as 420 m2 using Equation 2. The difference in areas helps in fuel consumptions analysis about a different alternative to select them for the future.
Step 7: Calculating lifting index for 1st design change
In alternative 1 the worker load travelling area in blue lines are reduced to the minimum distance due to the increment of the belt shown in Figure 6, which ultimately reduces the load carrying distance “D” in NIOSH lifting equation. This reduced distance is also helping labor to get rid of early fatigues. The load travelling area reduces to 224 m2 as it is 336 m2 in actual design. The lifter energy consumption also is reduced, because it does not carry the wood to the corner point as it is in the earlier scenario. In this condition the just place wood near to belt.
| Alternative 1 | ||
|---|---|---|
| Worker data | ||
| Lifting dimensions | Inputs | Multiplier |
| Horizontal location (min 10 m max 25") | 15 | 0.67 |
| Vertical location (min 0, max 70") | 30 | 1 |
| Travel distance (min 10, max 70") | 134 | 0.83 |
| Angel of symmetry (min 0, max 135") | 25 | 0.91 |
| Coupling (1=good, 2=fair, 3=poor) | 2 | 1 |
| Frequency (min 0, max 15 lifts/min) | 5 | 0.8 |
| Average lifting load | 16 | |
| Recommended Weight Limit (RWL) | 6.49 | |
| Lifting Index (LI) | 2.47 | |
Table 5: This table shows the lifting index calculation.
Step 8: 2nd change in design (Roller attachments)
The 2nd changes are the rollers addition, which is attached with already increased belt. This is taken as an alternative 2 blue line in the Figure 8 show rollers which are making connection with the belt. The wood is rolled through the roller from the far away distance, and smoothly falls into the belt. The lifter areas have decreased here than the alternative 1. The lifter just brings woods near, and to the empty spaces between the rollers, saving fuel consumption. The roles help workers to roll the wood towards the belt, giving more of the lifting area to the worker, without moving along with the load. The belt design provides some extra horizontal distance, which is note efficient in working These rollers also reduce the horizontal distance shown in Figure 9 which help to reduce the lifting index number Table 6.

Figure 8: This shows a 2nd change I the design of rollers attachment to the belt.

Figure 9: This figure shows the horizontal distance reduction by replacing rollers.
Step 9: Calculating travelling distance for required safe lifting index number 1.5
Table 6 shows improved lifting body dimensions.
| S. no | Actual process | Alternative 1 | Alternative 2 | |||
|---|---|---|---|---|---|---|
| Activities | Time (second) | Activities | Time (second) | Activities | Time (second) | |
| 1 | Going for wood | 2.75 | Going to sore | 3 | Going to store | 2 |
| 2 | Inspecting | 2 | Lifting sized wood | 1 | Transportation to roller | 2 |
| 3 | Wood selection (Checking) | 1.5 | Transportation to machine | 2 | Unloading | 0.5 |
| 4 | Wood lifting | 2 | Unloading | 0.5 | ||
| 5 | Carrying towards machine | 2.75 | ||||
| 6 | Unloading | 1.05 | ||||
| Total timing per cycle | 12.05 | 6.5 | 4.5 | |||
| Lifting per minute | 4.98 | 9.23 | 13.33 | |||
Table 6: Showing improved lifting body posturing dimensions.
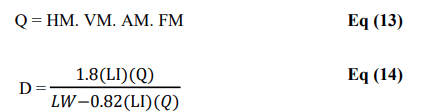
The “Q” Equation (13) which are the values of the NIOSH lifting equation’s dimension are replaced in the Equation (14) to calculate the distance of the required lifting index (like 1.5 in this case). The D in Equation (14) calculates the travelling distance which is according to the required given lifting index value. Ultimately it also helps in calculating energy consumed by the worker in its modified design. In alternative 2 or 2nd design change, the distance “D” from each roller is calculated as 0.5 meter.
Similarly, parameter and multipliers of NIOSH formula taken from 2nd alternative is shown in Table 7. Here the index value is reduced to 1.43, and it is because of the roller design of the Figure 5 alternative 2. The improvement made the work easier and faster for the worker. Applying the above dimensions, the efficiency is increased, because of the less fatigues. Some of the activities are reduced more in time. in alternative 1 the “going to store” has reduced due to the reduction of the travelling distance. This rule is applied for all of the alternative and it helped to increasing the working efficiency.
Step 10: Calculating lifting index for the 2nd change in the design
In this step the lifting index is again calculated that whether new changes are proper made or not. Roller made horizontal location reduced 5 inches. In previous design this distance was 15 inches as in Table 7 in row 1 it is brought up to 10 inches. Similarly, the travelling distance is calculated according to the require lifting index of 1.5.
| Alternative 2 | ||
|---|---|---|
| Worker data | ||
| Lifting dimensions | Inputs | Multiplier |
| Horizontal location (min 10 m max 25") | 10 | 0.67 |
| Vertical location (min 0, max 70") | 30 | 1 |
| Travel distance (min 10, max 70") | 19 | 0.83 |
| Angel of symmetry (min 0, max 135") | 25 | 0.91 |
| Coupling (1=good, 2=fair, 3=poor) | 2 | 1 |
| Frequency (min 0, max 15 lifts/min) | 8 | 0.8 |
| Average lifting load | 16 | |
| Recommended Weight Limit (RWL) | 11.22 | |
| Lifting Index (LI) | 1.43 | |
Table 7: Calculating lifting index after 2nd change in the design.
Step 11: Calories consumptions for selected design
Requirements for worker’s balance diet: Workers consume a large amount of energy in load lifting, which frequently happens in the working field. This energy consume is calculated using BMR and potential energy formula which is given above section. The required amount is converted into calories, which is used for chemical energy stored in food materials. In the following table the last columns values are same it is due to the design changes. To calculate calories consumption, there are two more sub steps involved. 1st step is to calculate the Basal Metabolism Rate (BMR), and 2nd to find their work energy consumption. Work energy is consumed by lifting and carrying the load towards the machine.
BMR calculations: The Table 8 below calculates the BMR of each worker in the actual working design. In lifting the load to the belt energy is consumed, the working lifts a load to certain height which is designed to them. For larger height of belt, energy consumption is greater it is calculating as the potential energy consumed by the worker in listing each time in shift. it is calculating in calories so that it, Calorie’s consumption during work is the potential energy the worker is consuming for the whole shift. BMR is calculated by knowing height weight and age of the workers. Energy is calculated in joule per minute, which is converted to calories in the last column of the Table 9. In calories it is easily known to be taken from food material. Following equation shows extreme calories consumption by workers lifting loads. BMR formula is given as: BMR=10 weight (kg)+6.25 height (cm)–5 × age (y)+s (kcal/day), where s is +5 for males and -161 for females.
| Workers | Weight | Height | Age | BMR (kcal/min) | Calories required |
|---|---|---|---|---|---|
| 1 | 88 | 65 | 31 | 1390.67 | 890.67 |
| 2 | 89 | 71 | 36 | 1400.42 | 900.42 |
| 3 | 83 | 67 | 28 | 1352.32 | 852.32 |
| 4 | 82 | 63 | 29 | 1311.77 | 811.77 |
Table 8: This table is shows the data collection for the calculation of BMR.
| Workers BMR calculation | ||||
|---|---|---|---|---|
| Workers | Weight factor | Height (cm) | Age factor | BMR (Cal/ day) |
| 1 | 880 | 988 | 155 | 2023 |
| 2 | 890 | 836 | 180 | 1906 |
| 3 | 830 | 851.2 | 140 | 1821.2 |
| 4 | 820 | 820.8 | 145 | 1785.8 |
| Average BMR of workers | 1884 | |||
Table 9: Shows the calories require for each worker according to their body.
Work energy calculation: Workers lifting weight up to height of the machine belt is the lifting height, and the energy consumption of worker is calculated as potential energy. Now BMR and working consumption and added and calculate overall shift ‘s consumption. The BMR consumption is taken as in the high active case because the workers are highly active, due to which its value is multiplied with 1.9. The formula for energy consumption in lifting load multiplied with the lifting frequency and the shift work time. It gives the potential work energy consumption performed by the workers. Equation () is used to calculate the average load lifting energy consumed by the worker. Energy in one minute for each worker in this algorithm is calculated, with their respective lifting mass and height, shown in the Table 15. The work consumption is calculated for each of the alternative to observe its variation and improvement with the modified design. Each minute the weight is lifted with an averaged frequency by each worker. Lifting energy variable (mass, height and lifting frequency) are directly proportion to worker’s energy consumption. Work performed is greater in the actual design because the lifting weigh, lifting frequency and height is greater. The vertical height and lifting frequencies measurements for the Table 10 are taken from the Figure 3 and 6.

| Lifting energy | ||||||
|---|---|---|---|---|---|---|
| Actual design | ||||||
| Worker | Mass (kg) | Vertical height inch | Height in meter | mgh (j/lift) | Lifting frequency (Lift/min) | Joule/minute |
| 1 | 18 | 42 | 1.07 | 188.18 | 6.67 | 1254.56 |
| 2 | 17 | 42 | 1.07 | 177.73 | 7.5 | 1332.97 |
| 3 | 13 | 42 | 1.07 | 135.91 | 6 | 815.46 |
| 4 | 15 | 42 | 1.07 | 156.82 | 6.67 | 1045.46 |
| Average lifting energy consumption | 1112.11 | |||||
| Alternative 2 | ||||||
| 1 | 15 | 30 | 0.76 | 112.01 | 5 | 560.07 |
| Alternative 2 | ||||||
| 1 | 15 | 32 | 0.81 | 119.48 | 5 | 597.41 |
Table 10: Lifting energy.
Load lifted by workers are carried towards machine belt which consumption energy as well. Worker consume a lot of energy when they travel along with the load lifted. Travelling energy is greater I-e it is directly proportion to travelling distance, mass and lifting frequency as Equation 16 indicates. Total distance for the actual design is greater for all workers. It is reduced in the modified designs, because of the reduction of travelling distance, mass and lifting frequency.

Areas and labors, of working actual case with possible alternatives are shown in the Tables 11-13. Energy consumption is observed with different amounts. Collected data regarding area is compared with each other. The loading lifting area is less in the 2nd alternative which shows that this alternative place is beneficial for the workers, I-e less fatigue will be induced. Load travelling is contributing more in energy consumption and fatigue inducing. Therefore, it is necessary to observe load travelling area comparatively, and overall area comparison is represented in figure. In the 1st and 2nd alternatives the areas are reduced.
| Load travelling energy in actual working design | |||||
|---|---|---|---|---|---|
| Worker | Mass (kg) | Gravitation (m/c2) | Travelling distance (meter) | Lifting frequency (Lift/min) | Load travelling consumption LTC j/min |
| 1 | 18 | 9.8 | 2.286 | 3 | 1209.75 |
| 2 | 17 | 9.8 | 2.667 | 3 | 1332.97 |
| 3 | 13 | 9.8 | 3.048 | 3 | 1164.95 |
| 4 | 15 | 9.8 | 2.286 | 3 | 1008.13 |
| Average load travelling energy consumption (LTEavg,wr) | 1178.95 | ||||
| Alternative 1 working design load travelling energy consumption | |||||
| 1 | 13 | 9.8 | 1.651 | 3 | 631.01 |
| Alternative 2 working design load travelling energy consumption | |||||
| 1 | 13 | 9.8 | 1.27 | 3 | 485.39 |
Table 11: This table shows load carrying energy consumption by worker in each working design.

| Actual design total working energy | Total consumption (joule/ shift) | ||
|---|---|---|---|
| Workers | Lifting energy consumption (j/min) | Load travelling consumption LTC j/min |
|
| 1 | 940.92 | 2016.25 | |
| 2 | 533.19 | 1332.97 | |
| 3 | 543.64 | 1553.26 | |
| 4 | 784.1 | 1680.21 | |
| Single worker average Energy consumption | 162.05 | 1645.67 | 2369768 |
| Alternative 1 | |||
| Single worker | 373.38 | 1051.69 | 1514429 |
| Alternative 2 | |||
| Single worker | 637.23 | 1294.38 | 1863913 |
Table 12: This table shows the total work energy consumption in a shift.
| Load travelling areas | ||||||||||
| Subtracting areas | ||||||||||
| Actual work design | ||||||||||
| Overall area (Meter square) | Belt | Roller | ||||||||
| Length | Width | Overall area | Length | Width | Area | Length | width | No. of rollers | Roller area | |
| Location 1 | 50 | 36 | 1800 | |||||||
| Location 2 | 12 | 28 | 336 | 0.6 | 7 | 4.2 | ||||
| Location 3 | 30 | 14 | 420 | 0.6 | 7 | 4.2 | ||||
| Total area | 2556 | Total belt area | 8.4 | |||||||
| Alternative 1 | ||||||||||
| Location 1 | 46 | 32 | 1472 | |||||||
| Location 2 | 8 | 28 | 224 | 0.6 | 22 | 13.2 | ||||
| Location 3 | 30 | 8 | 240 | 0.6 | 24 | 14.4 | ||||
| Total area | 1936 | Total belt area | 27.6 | |||||||
| Alternative 2 | ||||||||||
| Location 1 | 40 | 26 | 1040 | |||||||
| Location 2 | 8.2 | 28 | 229.6 | 0.6 | 22 | 13.2 | 2 | 3 | 8 | 48 |
| Location 3 | 30 | 16 | 480 | 0.6 | 24 | 14.4 | 2 | 3 | 8 | 48 |
| Total area | 1749.6 | Total belt area | 27.6 | Total rollers area | 96 | |||||
Table 13: This table shows the overall resulted areas requirements for this study.
The lifting index of actual alternative “LIActual” is smaller than alternative 1st “LIAvg,1st" in the table. The Table 14 also reveals percentage improvements “” of work design comparative to actual design. The Table 14 shows the percentage improvement in alternative 2nd is 1.36 more than alternative. Because by introducing rollers attached to belt in the 2nd design, load carrying efforts is reduced more.
| Work design | Lifting index LIAlt | Percentage improvement comparing with actual design PAlt |
| Actual design | 2.7 | |
| Alternative 1 (1st Design change) | 2.47 | 8.65 |
| Alternative 2 (2nd Design change) | 1.43 | 47.2 |
Table 14: This table shows percentage improvement in design change comparing with actual industrial design.
This research study shows design alternatives and budget-based selection, and their testing through NIOSH equation. Removing redundant activities enhances their efficiency, which helps in fatigues reduction, and also reduces their travelling distances.
The new design is also observable regarding energy consumption. The difference between alternative 2nd the 3rd is again very high because most of the steps are reduced through more rollers. After the design, the horizontal vertical is reduced,and the work has become easier. The lifting and carrying Energy consumption per shift from alternative 1st to 3rd are reduced effectively from 2183 Kcal to 1986 Kcal. The graph in Figure 10ss shows energy reduction from actual to new design.

Figure 10: This figure shows workers energy consumption reduction for each of the changed design.
Calories needed (Amount of specific food item required to eat per day)
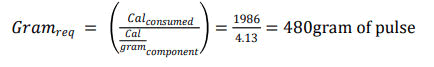
As the number of calories is burned by the worker to work for the whole shift. Therefore, it is necessary to eat the required amount of food items. This food recovers their energy consumed. If the food chemical energy is lesser than the require amount, then the worker will less their weight and they will be unable to perform their work properly in the coming days. In this case the require amount of is calculated from as shown in the Table 15. The last row of the Table 15 represents the energy consumed in the newly designed working place. If a worker consumes 1986 kilocalories per day on the newly made design, then how much of pulses he has to be given to recover his energy. In this case it is known that 1 gram of pulse(dal) contain 4.13 calories.
| Work design | Average BMR (Kilo joule/Day) | Work energy consumption (Kilo joule/Shift) | Required kilo calories per day (Kilo joule/Day) |
|---|---|---|---|
| Actual design | 1832.64 | 351.1855 | 2183.83 |
| Alternative 1 | 1832.64 | 178.0337 | 2010.67 |
| Alternative 2 | 1832.64 | 153.6712 | 1986.31 |
Table 15: This table shows the energy required by the workers in each working design.
In conclusion, the integration of ss interventions, using the revised NIOSH equation, demonstrates significant potential in enhancing production efficiency. This case study highlights the importance of systematic analysis and optimization of work processes, identifying areas where time and effort can be reduced without compromising quality. By applying the revised NIOSH equation, organizations can better assess work performance, leading to more accurate decision-making and improved operational outcomes. Ultimately, this approach not only fosters a more efficient work environment but also enhances worker well-being and productivity, offering a sustainable model for continuous improvement in various industries.
[Crossref]
Citation: Khan S (2025) Enhancing Production Efficiency through the in Work-Study Corporation of Work-Study Interventions, Using Revised NIOSH Equation, A case study. J Ergonomics. 15:425.
Received: 15-Oct-2023, Manuscript No. JER-23-27559; Editor assigned: 17-Oct-2023, Pre QC No. JER-23-27559 (PQ); Reviewed: 31-Oct-2023, QC No. JER-23-27559; Revised: 16-Jun-2025, Manuscript No. JER-23-27559 (R); Published: 23-Jun-2025 , DOI: 10.35248/2165-7556-25.15.425
Copyright: © 2025 Khan S. This is an open-access article distributed under the terms of the Creative Commons Attribution License, which permits unrestricted use, distribution, and reproduction in any medium, provided the original author and source are credited.