Journal of Horticulture
Open Access
ISSN: 2376-0354
ISSN: 2376-0354
Research Article - (2015) Volume 2, Issue 4
Meteorological parameters significantly affect cotton growth and development, and selecting an optimum sowing date can improve seed cotton yield. The experiment consisted of sowing a film-covered, drip-irrigated cotton field (Gossypium hirsutum L.) on four sowing dates from April to May and took place in 2011 and 2012 at the Agrometeorological Experimental Station of Wulanwusu, which was in an arid region of north-western China. The results showed that late sowing dates produced less aboveground dry biomass, yield and water-use efficiency (WUE) than did the normal sowing dates. The yield increased with the increases of mean diurnal temperature range (DTR) from full bloom to maturity, mean temperature and sunshine hours (SH) during the whole growing season, accumulated temperature (AT) and days from squaring to anthesis, and mean temperature during the reproductive stage. The yield decreased with the increases of AT and days from sowing to emergence. However, the main effect factors of meteorological parameters were AT from squaring to anthesis, mean temperature during the whole growing season and AT from sowing to emergence. It was significant to choose the optimal planting date to improve yield. Meanwhile, yield was also affected by leaf area index (LAI), boll number per plant and gin turnout. However, the main effect factors of yield component were boll number per plant, gin turnout and boll weight. Boll number per plant suffered from mean DTR from boll setting to maturity and SH during the whole growing season. Gin turnout was affected by mean temperature during the whole growing season and mean DTR from boll setting to maturity. The relationship between yield and boll weight was insignificant. Sowing date, year and interaction (sowing date × year) all significantly affected the yield. Thus, sowing date was an important factor affecting the yield, biomass and reproductive duration and minimized the impact of temperature and duration of the reproductive growth stage. With climate change, an earlier planting date might be an efficient method of increasing yield in the future.
<Keywords: Drip irrigation; Leaf area index; Meteorological parameter; Seed cotton yield; Sowing date; Yield components
Climate affects crop growth interactively, sometimes resulting in unexpected responses to prevailing conditions. Many factors, such as length of the growing season, climate (including solar radiation, temperature, light, wind, rainfall, and dew), cultivar, availability of nutrients and soil moisture, pests and cultural practices affect cotton growth [1].
Water is a primary factor controlling plant growth. Limited water resources are rapidly consumed as a result of climate change, increased demand by industry and population growth; therefore, water resources must be conserved. The northwest region in China is defined as an arid zone where the majority of the limited annual precipitation occurs from April to October during the principal growing season. Water deficiency in this region is one of the most important factors affecting crop yield. Thus, irrigation is required during the growing season to maintain and enhance crop growth and yield. Cotton (Gossypium hirsutum L.) is one of the most important fiber-producing plants in the world and is also a primary cash crop in the arid region of Wulanwusu in northwest China. The Wulanwusu cotton planting region is one of typical cotton producing regions in China, which had the highest cotton yield (7.614 million tons) in the world in 2012 and half of that yield were produced in the Xinjiang Uygur Autonomous Region. Great amounts of water are required during the cotton season, which has inspired a global research effort to find the most effective water conservation methods for the cotton industry. There is a close relationship between plant development and water supply [2-4].
Temperature is also a primary factor controlling rates of plant growth and development. Burk et al. [5] found that the optimum temperature range for biochemical and metabolic for cotton was 23.5-32°C, with an optimum temperature of 28°C. Cotton produces lower total biomass at 35.5°C than at 26.9°C and no bolls are produced at the higher temperature of 40°C [6]. Cool temperatures (<20°C) at night slow boll development [7]. High temperatures can cause male sterility in cotton flowers, and could have caused increased boll shedding in the late fruiting season [8]. The optimum temperature for cotton growth is 20-30°C [9]. An increase of cotton yield is likely due to an increase of AT, i.e. the climate warming [10]. An increases of growing season length are due to the climate warming [11], and this helps increase cotton yield [12].
Cotton is a thermophilic crop, and different temperatures are required at different growth stages. Soil temperature is an important environmental factor that affects plant growth and development both directly and indirectly [13,14]. High soil temperature, mechanical impedance and low matric potential cause poor germination and emergence of cotton [15]. Howell [16] and Lumsden and Locke [17] reported that low soil temperature coupled with high moisture content affected soil-borne pathogens that might induce a damping-off of cotton seedlings. As a result, soil temperature significantly affects emergence. Usually, soil temperature at a depth of 5 cm is above 14°C and can rapidly rise to 16°C with critical temperature 12°C while sowing. Soil temperature is also affected by air temperatures. In recent decades, the phonological phases of cotton have been changing because of a climatic warming trend [18]. Sowing too early frequently results in poor stands, and sowing too late generally results in reduced yield and increased vulnerability to insects and bad weather [19]. Thus, selecting of an optimum sowing date can improve cotton yield and promote normal cotton growth and is significant for maintaining a sustainable local agriculture economy.
The normal length of the cotton growing season spans from sowing to maturity. Longer growing seasons are subjected to the greater heat resources. Because cotton is a thermophilic crop, its growth could be unlimited if provided with enough heat resources. However, when air temperatures decline to 10°C, cotton starts to grow more slowly, and it will stop growing altogether with air temperatures of 0°C. Therefore, the growing season length is important to the cotton yield, and selecting the growing season length by the optimal sowing date is of tremendous importance.
Meteorological parameters significantly affect cotton growth and development, and selecting an optimum sowing date can improve seed cotton yield. Gormus and Yucel [19] found that late planting caused the crop to flower later and pushed boll development into the cooler weather, resulting in reduced yield. However, Braunack et al. reported that lint yield and resource use efficiency were not statistically decreased for plantings that occurred more than 30 days from the normal target planting date of October 15th. Yeats et al. tested four sowing dates (in March, April, May and June) and found that sowing during March to April achieved the dual objectives of high yield and the avoidance of rain at maturity. However, studies on the effects of sowing dates on cotton yield and WUE in arid regions of Wulanwusu are lacking. Considerable research has been conducted in this region concerning the effects of sowing dates on yield components [20,21] and the effects of cold injury on yield [22,23]. Liu et al. [24] found that the TWUEyield of drip irrigation in this region was 9.65-11.19 kg ha-1 mm-1 through three levels of irrigation with saline water.
However, effects of meteorological parameters created by sowing dates on cotton yield have seldom been reported. The present study will discuss the response of cotton to sowing dates through filmed drip irrigation with respect to seasonal water for irrigation, evapotranspiration (ET), yield, dry aboveground biomass (Bio), total water use efficiency for seed cotton yield (TWUEyield), total water use efficiency for aboveground dry biomass (TWUEbio), irrigation water use efficiency for seed cotton yield (IWUEyield), irrigation water use efficiency for aboveground dry biomass (IWUEbio) and leaf area index (LAI). Therefore, the objective of the present study is to evaluate effects of meteorological parameters created by different sowing dates on yield.
Experimental site
Field experiments were conducted at the Agrometeorological Experimental Station of Wulanwusu at the Institute of Desert and Meteorology of China Meteorological Administration (IDM, CMA) in 2011 and 2012. The experimental station (85°49′ E, 44°17′ N and 468. 2 m above sea level) lies in Shihezi City of the Xinjiang Uygur Autonomous Region, north-western China. The climate is semi-arid with mean annual air temperatures of 7.7°C, mean annual maximum and minimum air temperatures of 33.0°C (July) and -10.8°C (January), respectively, and mean annual precipitation of 220 mm (average values for 1981-2010) (Figure 1). Mean annual pan evaporation at the site is 1664.1 mm, SH in a year are 2861.2 h, and the frost-free period is approximately 170 d. The soil type is gray desert soil, and the soil texture is clay-loam soil with organic matter at 15.97 g kg-1 and total nitrogen at 0.627 g kg-1 [25]. From 0 to 60 cm depth of soil, the average soil bulk density is 1.32 g cm-3 before sowing, as measured using the method of Robertson [26], field water holding capacity varies from 25.9 to 28.3% and wilting point varies from 9 to 10.1%. The groundwater table is from 8 to 20 m. According to the agricultural climate division, the region of the Junggar Basin is suitable for planting cotton. Spring cotton is the primary field crop in this region.
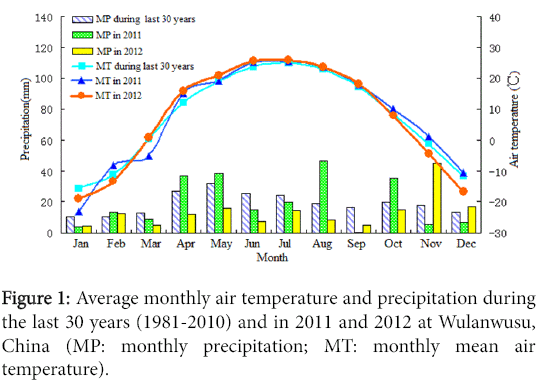
Figure 1: Average monthly air temperature and precipitation during the last 30 years (1981-2010) and in 2011 and 2012 at Wulanwusu, China (MP: monthly precipitation; MT: monthly mean air temperature).
Plot layout
The most common layout applied by farmers during cotton planting in this region is the double lateral layout (two laterals controlling four rows). Generally, a transparent film with a width of 125 cm covers four rows, and cotton crops are planted with row spacing increments of 20 cm +45 cm +20 cm. Each plot was 2.5 m × 9.8 m (8 rows per plot). The plastic film was covered on the ground, and when soil and air temperatures were optimal, the practice of sowing seeds was conducted. At this time, 4 cm2 holes were cut in the film through which the cotton seeds were planted. The spacing between plants was 10 cm within a row. A 1-2 cm layer of soil was placed over the hole to prevent water evaporation. On the other hand, the covered soil could avoid the hole in the film to become more area by blowing of wind. The cotton plant would grow through the hole and soil evaporation through the hole was reduced. Thus, the majority of normal soil evaporation was eliminated by using the plastic film. The experiment was a randomized complete block design with four replications. The position and location of the beds remained the same throughout the 2 years of the study.
Irrigation and soil moisture measurement
Two drip lines were laid in narrow rows under each sheet of film. Irrigation water was supplied from an open channel irrigation system via a pump in the experimental area and distributed to the plots through polyvinyl chloride (PVC) pipelines. Water applied to each experimental plot was measured using a Huaxin water flowmeter connected to an irrigation pipe.
Irrigation amounts were determined by the following formula:
 (1),
(1),
where W is the irrigation amount of each irrigation practice (mm); W2 is the suitable soil moisture of each growing stage (gravimetric percentage); W1 is the soil moisture measured before irrigation (gravimetric percentage); d is soil bulk density (g cm-3); and h is soil depth (mm). The soil bulk densities at the depths of 0-10, 10-20, 20-40, 40-60 and 60-100 cm are 1.25, 1.27, 1.45, 1.53 and 1.54 g cm-3, respectively. The irrigation interval is 10-20 days (Table 1), but it can be changed according to soil moisture.
| Irrigation dates | ? | ? | ? | ? |
|---|---|---|---|---|
| 2011 | ||||
| 15 June | 48.9 | 51.3 | 68.6 | 56.6 |
| 30 June | 43.3 | 41.8 | 43.6 | 40.1 |
| 11 July | 37.3 | 56.4 | 55.9 | 55.1 |
| 21 July | 62.3 | 55.3 | 57.2 | 51.8 |
| 1 August | 55.1 | 65.9 | 63.2 | 61.1 |
| 17 August | 54.1 | 61.8 | 57.8 | 62.5 |
| 2012 | ||||
| 27 May | 62.5 | 69.3 | 57.5 | 58.8 |
| 1 July | 54.2 | 49.4 | 43.8 | 45.9 |
| 11 July | 56.6 | 63.9 | 39.8 | 65.3 |
| 22 July | 66.6 | 78.6 | 44.6 | 68.6 |
| 29 July | 50.2 | 65.7 | 46.9 | 56.6 |
| 20 August | 60.5 | 64.4 | 42.4 | 59.6 |
Table 1: Irrigation water of drip irrigation in 2011 and 2012(mm ha-1). Note: The sowing dates (I, II, III and IV) were April 14th, April 24th, April 30th and May 10th in 2011 and April 16th, April 24th, May 4th and May 6th in 2012.
Soil moisture (percentage of field capacity) suitable for cotton growing in the stages of sowing, emergence, squaring, anthesis-boll and boll opening are 70-80, 55-70, 60-70, 70-80 and 55-70%, respectively (Chen et al.). If soil moisture declines sufficiently, a drought will ensue. The drought indexes of soil moisture in the stages of emergence, squaring, anthesis-boll and boll opening are 50, 55, 55 and 50%, respectively [27]. The application timing and amount of water for irrigation were determined according to local precipitation, soil moisture and cotton growth conditions (Table 1). If the soil moisture is below the lowest value suitable for cotton growing and above the value of the drought index in each development stage, then the plant should be irrigated. Cotton of each sowing date grew differently, so the different soil moistures determined the different irrigation levels (Table 1). If no precipitation occurred, the irrigation levels were enhanced. However, there was no irrigation during the stage when the seeds were sown because a delay in the first irrigation after sowing not only improves the seed cotton yield but also increases water use efficiency [28-30]. The first irrigation for 2011 was conducted on June 15th and for 2012 on May 27th (Table 1). Sowing dates irrigation water was 275-391 mm (Table 1).
During the cotton growing seasons in 2011 and 2012, the soil moisture of the soil profile (from the soil surface down to 100 cm) was determined by gravimetric measurements according to the following depths: 0-10, 10-20, 20-40, 40-60, 60-100 cm. Soil samples were collected with a hand-driven auger in the center of three replications of each treatment every 10-12 days, and the soil moisture was sampled before every irrigation instance. In addition, before sowing seeds and after harvest, the soil moisture was also sampled.
Sowing seeds
The normal cotton planting date is decided by soil temperature at a depth of 5 cm and the surrounding air temperature. The critical soil temperature for cotton is 12°C, but cotton is usually planted when soil temperatures are above 14°C, which rapidly rises to 16°C during sowing. The mean air temperature for sowing is over 10°C. Both soil and air temperatures must remain optimal for over 5 d before sowing. In the arid region of the study, the film covering increases the soil temperature at a depth of 5 cm by 2-3°C [31], so the air temperature is usually lower than the soil temperature when the cotton is planted. Due to a warmer regional climate, the cotton planting date increased by 0.81 d per year (R2=0.554, P<0.001) during the period of 1981-2010. Thus, the normal planting date was the first planting date, and subsequent sowing dates were regarded as “late sowing dates” in this study.
Drip irrigation was conducted on the cotton variety Xinluzao No. 13 which was sown on 4 separate dates in each year. When the accumulated temperature (AT) (≥ 10°C) from the date of the last sowing amounted to 100, the next sowing was conducted. Rows of seeds were sown 0.2 m apart (narrow rows) and 0.45 m apart (wider rows). Within a row, the seeds were sown 10 cm apart. The soil was covered with white polyethylene sheets following sowing. Thinning occurred approximately 15-20 days after seeding. The dates of sowing were April 14th, April 24th, April 30th and May 10th in 2011 and April 16th, April 24th, May 4th and May 6th in 2012.
Agronomic management
Carbamide (440 kg ha-1), P2O5 (420 kg ha-1), K2O (270 kg ha-1) and farmyard manure (30 t ha-1) were applied each year. The basal fertilizer was composed of 30 % carbamide, 70% P2O5, 100% K2O and 100% farmyard manure, which was applied before sowing in 2011 and 2012, and the dressing was composed of 70% carbamide and 30% P2O5, which was divided into four parts and applied to each irrigation instance except the last two irrigation instances for each year. The dressing was dissolved in the water and applied through drip pipes during the cotton irrigation. Control of insects and weeds were performed as required during the growing season according to local recommendations. Other production practices were recommended standards.
Parameters measurement
Three plants in an inner row of each sowing date plot were randomly selected at emergence, squaring, anthesis and boll maturity, and the LAI and aboveground dry biomass were measured. Green leaf area was measured using a portable leaf area meter “LI-COR 3100” (LiCor, Inc., Lincoln, NE, USA). Aboveground dry biomass was measured by cutting three plants selected randomly of each sowing date plot at ground level and drying the plants at 65°C to a constant weight [32-34]. The seed cotton yield was determined by weighing all harvested seed cotton of each plot in both years. The first harvest was begun when the cotton was approximately 70% open, and the second harvest was 4 weeks later.
The total water use efficiency for seed cotton yield (TWUEyield), total water use efficiency for aboveground dry biomass (TWUEbio), irrigation water use efficiency for seed cotton yield (IWUEyield), and irrigation water use efficiency for aboveground dry biomass (IWUEbio) were calculated using the following formulas:
TWUEyield=Y/ET (2),
TWUEbio=Bio/ET (3),
IWUEyield=Y/I (4),
IWUEbio=Bio/I (5),
where Y is the total seed cotton yield (kg ha-1); ET is the total seasonal evapotranspiration (mm); I is irrigation water (mm); and Bio is the aboveground dry matter at physiological maturity (kg ha-1). The ET for each sowing date treatment was estimated using the water balance method as follows:
ET=I +P ± SRD (6)
where I is the irrigation water; P is the precipitation; S is the change of soil water storage; R is the surface runoff; and D is the downward flux below the crop root zone. Because there was no water table or runoff, R and D were ignored. To estimate S, the soil moisture of the soil profile (down to 100 cm) was determined by gravimetric measurements during the cotton growing seasons in 2011 and 2012. The harvest index (HI) was obtained from following equation:
HI = Y/Bio (7).
The growth stages of cotton were recorded following the descriptions of Liu et al. [35]. A specific growth period was defined as the time period from one growth stage to the next. The boll number per plant was calculated by counting the mature bolls [36]. The boll weight of fully opened and matured bolls picked from five plants in each plot was recorded and the mean boll weight was calculated and expressed in gram per boll. Mean daily temperature was calculated as the sum of the daily temperatures divided by the number of days during the period. AT with a base temperature of 10°C is usually evaluated growth development of thermophilic crops. AT was calculated as the sum of daily mean temperature (≥ 10°C) for some days. Diurnal temperature range (DTR) means maximum temperature minus minimum temperature in a day. Mean DTR was calculated as the sum of the daily DTR divided by the number of days during the period. SH were calculated as the sum of daily SH for some days.
Statistical analyses
The data were statistically analyzed using analysis of variance (ANOVA) at a 5% level of significance. The significance of the treatment effect was determined using an F-test, and the significance of the difference between the means of the two treatments was determined by the least significant differences (LSD) estimated at a 5% probability level. Duncan’s multiple range test was used to compare additional means at the same probability level. Correlations and regressions were determined using the data analysis tool pack for MSExcel.
Multicollinearity is a common problem in multivariate analysis. In ordinary least squares (OLS) regression, high multicollinearity (VIF ≥ 10), increases a risk of theoretically sound predictor to be rejected from regression model as non-significant variable [37], and OLS regression of yield unstable results due to increasing standard error of their estimated coefficients [38]. So the partial least squares (PLS) regression was employed. PLS is a multivariate statistical technique and is one of a number of covariance-based statistical methods which that allows comparison between multiple response variables and multiple explanatory variables [39]. PLS are very resistant to over-fitting, and are considered as better than principal component analysis (PCA) [40]. Collinearity diagnosis was conducted by using SPSS 17.0.
Seed cotton yield, aboveground biomass and harvest index
The seed cotton yield and aboveground biomass for sowing dates of both years were shown in Table 2. The seed cotton yield was influenced by the significant effect of year (Y) in the combined ANOVA (Table 3). The highest yield and biomass all occurred on sowing date of in both years. Meanwhile the lowest values all appeared in sowing date of in both years. The seed cotton yield ranged from 4692 to 7365 kg ha-1. Aboveground biomass varied from 15687 to 24963 kg ha-1. The seed cotton yield and aboveground biomass in both years showed distinct decreasing trends against sowing dates (Figure 2e and f). Statistical analysis showed that the relationship between the seed cotton yield and aboveground biomass was significant and positively correlated (Figure 3). For one kilogram increase in aboveground biomass, the seed cotton yield increased by 0.2659 kg (Figure 3).
| 2011 | 2012 | |||||||
|---|---|---|---|---|---|---|---|---|
| ? | ? | ? | ? | ? | ? | ? | ? | |
| ET(mm) | 436.4 | 467.9 | 460.9 | 427.3 | 396.4 | 437.1 | 320.9 | 400.2 |
| Irrigation(mm) | 301.0 | 332.5 | 346.3 | 327.2 | 350.6 | 391.3 | 275.0 | 354.8 |
| Yield (kgha-1) | 5683 ab | 5390ab | 5554 ab | 4692 a | 7365 b | 6356 ab | 6694 ab | 5798 ab |
| Biomass(kgha-1) | 19930ab | 16578a | 18149 a | 15687a | 24963 b | 21147 ab | 22086ab | 20471ab |
| TWUEyield(kgha-1 mm-1) | 13.02a | 11.52a | 12.05a | 10.98 a | 18.58 bc | 14.54 ab | 20.86c | 14.49ab |
| IWUEyield(kgha-1 mm-1) | 18.88ab | 16.21ab | 16.04ab | 14.34 a | 21.01 bc | 16.24ab | 24.34 c | 16.34 ab |
| TWUEbio(kgha-1 mm-1) | 45.67 a | 35.44a | 39.38 a | 36.71 a | 62.97 bc | 48.38 ab | 68.83 c | 51.15 ab |
| IWUEbio(kgha-1 mm-1) | 66.21abc | 49.86a | 52.41a | 47.94a | 71.20 bc | 54.04 ab | 80.31 c | 57.70 ab |
| Vegetative stage(day) | 48 d | 44bc | 45 c | 41b | 40 b | 36a | 35 a | 41 b |
| Reproductive stage(day) | 121 ef | 116 d | 109c | 103 ab | 121 f | 117 de | 108 b | 100 a |
Table 2: Means of some traits of cotton during 2 years in the experiment. Note: The sowing dates (, , and ) were April 14th, April 24th, April 30th and May 10th in 2011 and April 16th, April 24th, May 4th and May 6th in 2012. Means within rows followed by different letters are significantly different at P ≤ 0.05.
| Year(Y) | Irrigation(IR) | Y×IR | Sowing date (SD) | Y×SD | IR×SD | Y×IR×SD | |
|---|---|---|---|---|---|---|---|
| Yield | * | ns | ns | * | * | ns | ns |
| Biomass | * | ns | ns | * | * | ns | ns |
| TWUEyield | * | ** | ** | ns | ** | ** | ** |
| IWUEyield | * | * | * | ns | * | * | * |
| TWUEbio | ** | ** | ** | ns | ** | ** | ** |
| IWUEbio | ** | ** | ** | ns | ** | ** | ** |
| Vegetative stage | ns | ** | ** | ns | ns | ** | ** |
| Reproductive stage | ** | ** | ** | ** | ** | ** | ** |
Table 3: Analysis of variance for some traits of cotton in the combined ANOVA. Note: ns means non-significant. * and ** significant at 5, 1% level, respectively.
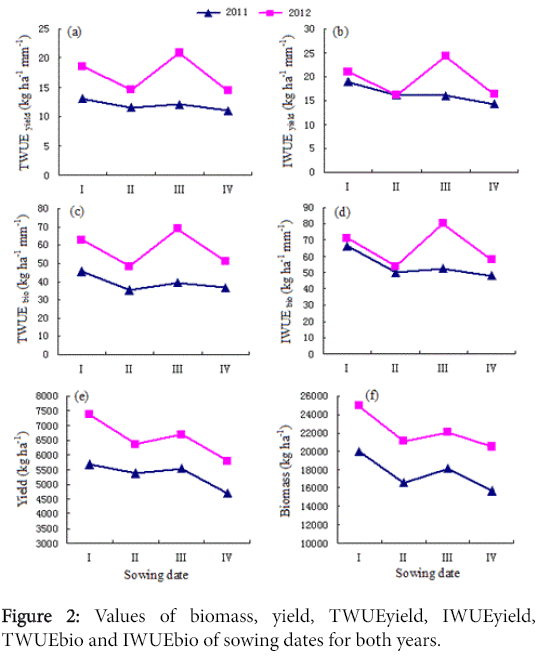
Figure 2: Values of biomass, yield, TWUEyield, IWUEyield, TWUEbio and IWUEbio of sowing dates for both years.
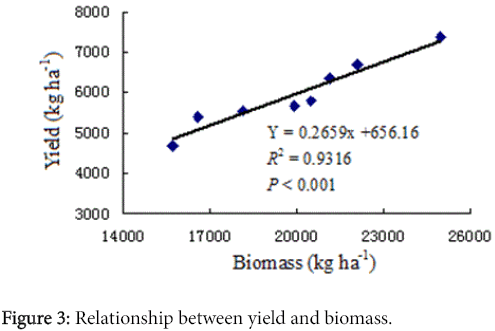
Figure 3: Relationship between yield and biomass.
To understand the effects of sowing dates on the yield and development of cotton, the harvest index for each sowing date was calculated. The harvest indices in this study varied from 0.28 to 0.33, which were higher than the indices variation of 0.20-0.32 reported by Ünlü et al. [4].
Interaction effects of ET, irrigation water and WUE
Delaying the first irrigation after sowing can improve the seed cotton yield and WUE [28-30]. Therefore, the first irrigation was conducted on June 15th in 2011 and May 27th in 2012 (Table 1). The TWUEyield and TWUEbio varied from 10.98 to 20.86 kg ha-1 mm-1 and from 35.44 to 68.83 kg ha-1 mm-1 in this experiment, respectively. The value for each sowing date in 2011 was lower than that in 2012. The highest TWUEyield and TWUEbio occurred on date of sowing in 2012, while the lowest TWUEyield and TWUEbio were on date of sowing in 2011. The main effects of the interaction term (year × sowing date, irrigation water × sowing date, year ×irrigation water × sowing date) and irrigation were significant (Table 3).
The values of IWUEyield and IWUEbio varied from 14.34 to 24.34 kg ha-1 mm-1 and from 47.94 to 80.31 kg ha-1 mm-1, respectively, and both of them showed distinct decreasing trends against sowing dates (Figure 2b and d). The highest IWUEyield and IWUEbio were obtained on date in 2012 because it used the least amount of irrigation water. The IWUEyield was higher than TWUEyield, which could be attributed to water used from soil storage [3].The effects of sowing date were insignificant with respect to the IWUEyield and IWUEbio, whereas the primary effects of the interaction term (year × sowing date, irrigation water × sowing date, year × irrigation water × sowing date) and irrigation were significant (Table 3).
Seed cotton yield, biomass and LAI
LAI is a dynamic indicator of the growth state of a crop. In general, LAI of cotton increases until anthesis and then decreases as the older leaves die. The LAI were analyzed against the seed cotton yield and biomass. The results of the regression statistical analysis showed that positive linear relationships existed among yield, biomass and LAI (Figure 4a and b). A one unit increase of LAI increased the seed cotton yield and biomass by 483.6 and 1832.4 kg ha-1, respectively (Figure 4a and b). This result indicated that a higher LAI of cotton produced higher seed cotton yield and biomass. The maximum LAI value was 5.57. However, the highest yield was not obtained at the maximum LAI, and this result was basically consistent with Ünlü et al. [4]. The lowest LAI value was 2.53, which was observed under low irrigation water levels and was consistent with the results of deficit irrigation experiments reported by Dagdelen et al. [41] and Ünlü et al. [4].
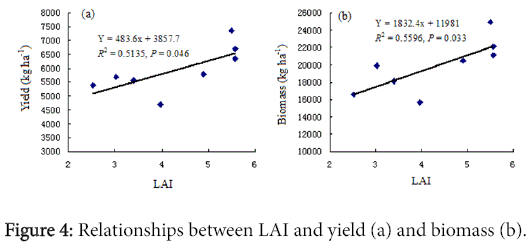
Figure 4: Relationships between LAI and yield (a) and biomass (b).
Relationships between yield and differences in meteorological parameters created by different sowing dates
Different meteorological conditions were created by different sowing dates, which significantly affected the seed cotton yield and biomass (Tables 2 and 3) for both years. The interaction term (sowing date × year) was significant with respect to the seed cotton yield and biomass (Table 3).
Yield could increase by 782.6 kg ha-1 with a rise of 1°C of the DTR from full bloom to maturity (Figure 5a). During this phase, more heat resources could prompt more bolls to form. Higher temperatures during the day prompted an increase in photosynthesis and produced increased biomass; photosynthesis decreased and respiration enhanced at night, which led biomass to be decompounded. Lower temperatures at night decreased enzyme activity, so decompounding rate lowered the compounding rate. Therefore, much biomass was accumulated, which enhanced the yield as reflected in the positive correlation between yield and biomass (Figure 3). However, with warming climate, the DTR will decrease and reduce yield. Because increased air temperatures may be attributable to changes in the daily maximum and minimum temperatures, reports in recent decades have indicated that the daily minimum temperatures are rising faster than daily maximum temperatures [42].
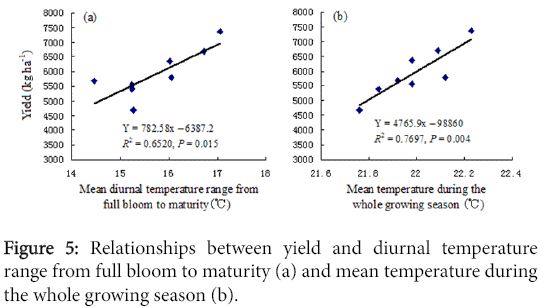
Figure 5: Relationships between yield and diurnal temperature range from full bloom to maturity (a) and mean temperature during the whole growing season (b).
Yield also increased directly with a rise of mean temperatures of different sowing dates during the whole growing season (Figure 5b), which could be explained by the thermophilic characteristic of cotton and that temperature was the main climatic factor affecting cotton production, with 20-30°C being the optimum temperature for cotton growth [9]. A 1°C rise in mean temperature during the whole growing season could increase yield by 4765.9 kg ha-1 (Figure 5b). Mean temperatures during different sowing dates in 2012 were higher than those in 2011, and yield in 2012 were also higher than those in 2011, especially almost identical irrigation water in same sowing dates (Table 2) did support this point. With warmer climate in future, more cotton yield will be produced.
AT with a base of 10°C is usually evaluated growth development of thermophilic crops; higher AT might restrain or prompt plant growth. As shown in Figure 6a, the seed cotton yield decreased with an increasing AT from sowing to emergence; however, yield increased directly with an increase of AT from squaring to anthesis, as shown in Figure 6b. These trends were consistent with the relationships between yield and the days from sowing to emergence (Figure 6c) and the days from squaring to anthesis (Figure 6d), respectively, although the relationship was insignificant (Figure 6c). The reason for this result might be that higher AT and additional days in growing phases caused poor germination and emergence during the period from sowing to emergence, which was similar to the view of Nabi et al. [15], and this would lead to decrease yield. Higher AT and additional days in growing phases caused additional heat resources to be absorbed by the cotton, which prompted reproductive growth during the period from squaring to anthesis; therefore, the cotton yield increased.
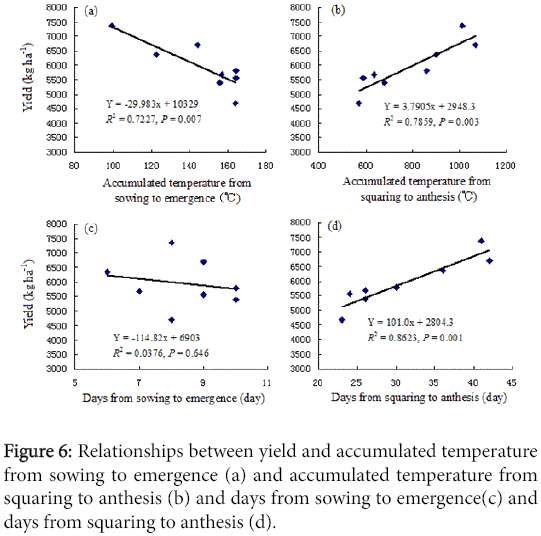
Figure 6: Relationships between yield and accumulated temperature from sowing to emergence (a) and accumulated temperature from squaring to anthesis (b) and days from sowing to emergence(c) and days from squaring to anthesis (d).
LAI was affected by meteorological parameters as well. LAI increased with a rise of SH from budding to anthesis (Figure 7).
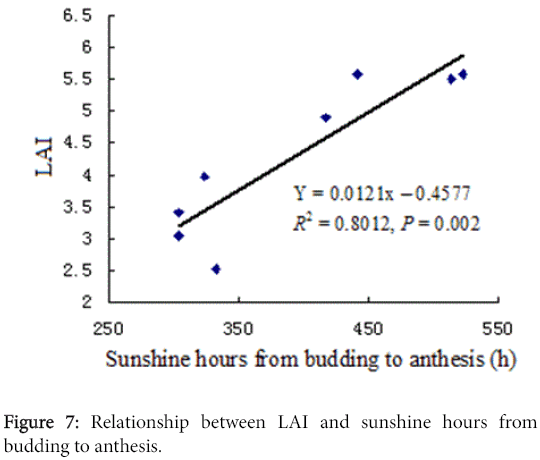
Figure 7: Relationship between LAI and sunshine hours from budding to anthesis.
In general, the earlier sowing date can be obtained more SH to prompt photosynthesis and reproductive growth, and the higher LAI usually appears in the earlier sowing date. Furthermore, the higher LAI produced more yield (Figure 4a). For a 1 hour increase of SH from budding to anthesis, the seed cotton yield increased by 0.0121 kg ha-1. So, LAI affected by meteorological parameters was an important index to estimate yield.
The relationships between SH during the whole growing season and yield and biomass were significant (Figure 8a and 8b). The earlier sowing date produced higher yield and biomass because more heat resources were obtained for the earlier sowing date to prompt growth. For a 1 hour increase of SH during the whole growing season, the seed cotton yield and biomass increased by 6.429 and 21.679 kg ha-1, respectively.
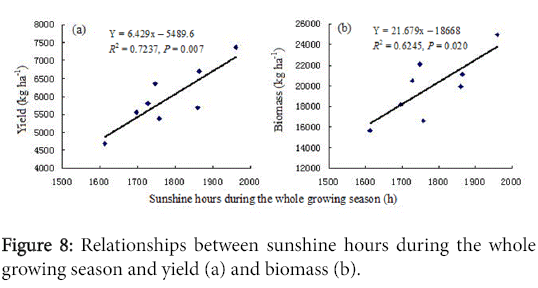
Figure 8: Relationships between sunshine hours during the whole growing season and yield (a) and biomass (b).
Factors, such as temperature and LAI influenced the seed cotton yield and biomass. When we evaluated the relationships among seed cotton yield, biomass and mean temperature during the reproductive growth stage, it was obvious that there were strong positive relationships among the factors (Figure 9a and 9b). For a 1°C increase of mean daily temperature during the reproductive growth stage, the seed cotton yield and biomass increased by 968.54 and 2976.7 kg ha-1, respectively (Figure 9a and b). This suggested that drip-irrigated cotton was sensitive to temperature increases, because cotton was a thermophilic crop and optimum temperature was helpful in prompting growth of cotton.
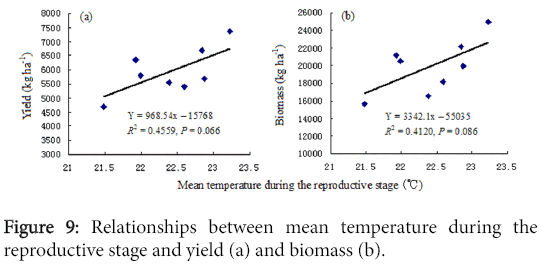
Figure 9: Relationships between mean temperature during the reproductive stage and yield (a) and biomass (b).
A delay in sowing led to more rapid development of the cotton and decreased the days of the vegetative growth stage and duration of the reproductive growth stage, aboveground dry biomass, LAI and seed cotton yield (Table 2, some data not shown). Earlier sowing more closely matched the AT and led to an increase in the biomass and seed cotton yield (Table 2), which was consistent with results from other studies [10,18]. Sowing dates significantly affected the reproductive growth stages (Table 3) and therefore, affected AT. Thus, the ability to match key phonological growth periods of cotton to a less stressful growth period in the growing season was an effective means of avoiding the impact of shortening the growing season and less AT, as noted by Deng et al. [10] and Wang et al. [18].
Yield components and meteorological parameters created by different sowing dates
Gin turnout, boll number per plant and boll weight were three parts of yield components. The relationship between gin turnout and yield was significant (Figure 10a). For a 1% increase of gin turnout, seed cotton yield increased by 601.3 kg ha-1. The gin turnout of sowing date of amounted to the maximum value in 2011(Figure 10c), but the sowing date of amounted to the maximum value in 2012 (Figure 10c). The minimum values of gin turnout in both years appeared in the sowing date of (Figure 10c).The reasons were that the earlier sowing date had the longer SH, the higher mean temperature and mean DTR from boll setting to maturity. Thus, the earlier sowing date had the higher gin turnout, and this led to the higher gin turnout had the higher yield (Figure 10a). And this point could be supported by the fact that gin turnout increased with the increases of SH during the whole growing season (Figure 11a), mean temperature from boll setting to maturity (Figure 11b) and mean DTR from boll setting to maturity (Figure 11d). However, when mean maximum temperature from boll setting to maturity was over 30°C, it decreased gin turnout (Figure 11c). For the multicollinearity existed between the meteorological parameters, the PLS regression of gin turnout was Y=6.040X1+0.270X2-98.855, X1: mean temperature during the whole growing season; X2: mean DTR from boll setting to maturity. This result showed that mean temperature from boll setting to maturity significantly affected gin turnout for the percent of variance explained of X1 was 55.6%. And the percent of variance explained of X2 was 27.2%.
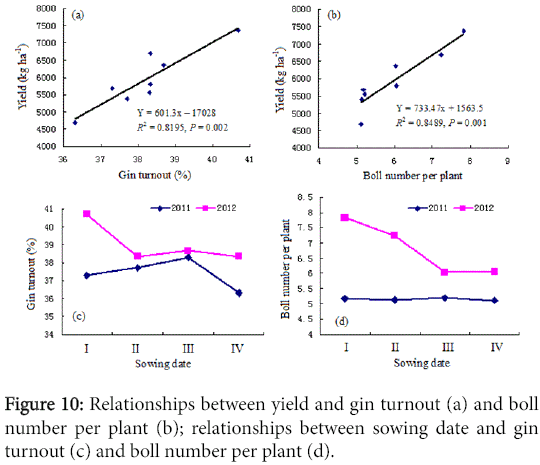
Figure 10: Relationships between yield and gin turnout (a) and boll number per plant (b); relationships between sowing date and gin turnout (c) and boll number per plant (d).
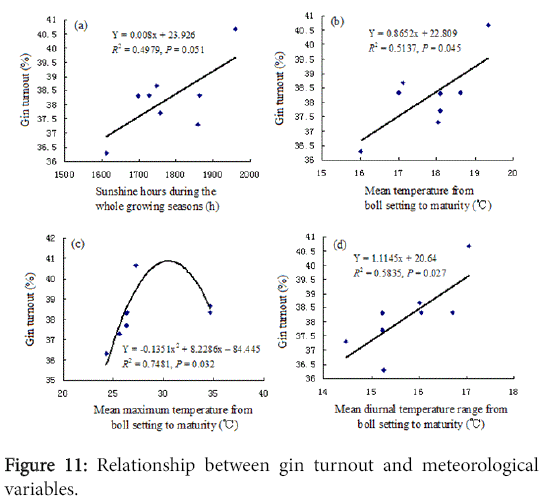
Figure 11: Relationship between gin turnout and meteorological variables.
Yield increased with an increase of the boll number per plant (Figure 10b). The earlier sowing date had the longer SH and the higher mean DTR from boll setting to maturity. Thus, the earlier sowing date had relative higher boll number per plant (Figure 10d). This point were supported by the fact that boll number per plant increased with the increases of SH during the whole growing season (Figure 12a) and mean DTR from boll setting to maturity (Figure 12b). Since no multicollinerarity existed between the meteorological parameters, the OLS regression of boll number per plant was Y = 0.923X1 +0.003X2 -14.787 (R2=0.982, P<0.001), X1: mean DTR from boll setting to maturity; X2: SH during the whole growing season. This result showed that mean diurnal temperature from boll setting to maturity significantly affected boll number per plant.
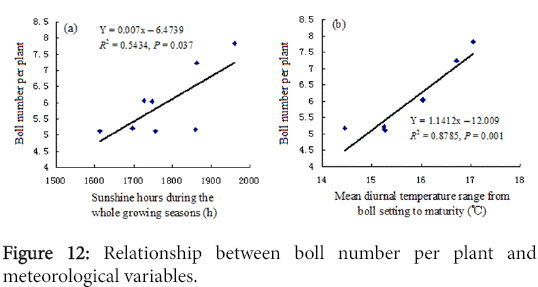
Figure 12: Relationship between boll number per plant and meteorological variables.
However, the relationship between boll weight and yield was insignificant. In addition, there were no significant correlation between boll weight and meteorological parameters. Since there were no multicollinearity existed between boll number per plant and gin turnout and boll weight, the OLS regression of yield was Y=962.535X1 +23.689X2+803.134X3-3347.832 (R2=0.992, P<0.001), X1: boll number per plant; X2: gin turnout; X3: boll weight. This result showed that boll number per plant, gin turnout and boll weight mainly affected yield.
Yield was affected by many meteorological parameters in this study, it was very important to know which parameter was the most important. Since the multicollinearity existed between the meteorological parameters, the PLS regression of yield was Y=1.128X1 +2249.354X2-14.816X3-42244.866, X1: AT from squaring to anthesis, X2: mean temperature during the whole growing season, X3: AT from sowing to emergence. This result showed that AT from squaring to anthesis significantly affected yield for the percent of variance explained of X1 was 55.2%. As Figure 6b showed that higher AT prompted reproductive growth during the period from squaring to anthesis, therefore, the cotton yield increased. And the percent of variances explained of X2 and X3 were 14.4 and 13.5%, respectively. An increase of the mean temperature in the whole growing season helped increase yield because cotton was a thermophilic crop (Figure 5b). Higher AT from sowing to emergence caused poor germination and emergence, this would decrease yield finally. This point was supported by Figure 6a.
The seed cotton yield and aboveground biomass reported in other regions were very different, which was caused by the use of different varieties of cotton and disparities in climate conditions, irrigation methods, irrigation water, agronomical practices, and soil characteristics. The same quantity of irrigation water and three levels of N were applied in India and resulted in an increase in seed cotton yield from 1624 to 2144 kg ha-1 [43]. An regulated deficit irrigation (RDI) treatment with five irrigation levels was conducted in Turkey and resulted in the yield varying from 1740 to 5640 kg ha-1 [3]. Overand under-irrigation in sandy loam soil in the USA were employed to produce lint yield from 1464 to 1686 kg ha-1 [44]. An RDI treatment with four irrigation levels was carried out in Palexerollic Chromoxerert soil (heavy clay texture) in Turkey and produced seed cotton yield of 1369-3397 kg ha-1 [4]. Different levels of drip irrigation caused seed cotton yield to range from 2700 to 6400 kg ha-1 in an experiment in China [45]. The highest biomass values of 12150 kg ha-1 were reported for an IF6-100 treatment plot under trickle-irrigated cotton [34], and an RDI treatment with five irrigation levels was conducted in Turkey and resulted in a biomass of 9500 kg ha-1 [3]. Ünlü et al. [4] indicated that the range of biomass was from 8023 to 13235 kg ha-1 under RDI treatments with four irrigation levels in Turkey. However, the highest yield and biomass of cotton occurred in the full irrigation treatment [32,34,46]. Our results are consistent with the above studies.
In the present study, the highest yield and biomass were all obtained on the sowing date of for both years, which suggested that late sowing dates led to lower yield and biomass. This result was consistent with the findings of Sharma and Sarma [47], Goudreddy et al. [48], Sarma et al. [49], Gormus and Yucel [19] and Yeats et al. [50]. The greater yield and biomass in the first sowing date could be explained by the fact that the early planted cotton took advantage of more AT, maximum yield and early harvest in the fall, which allowed the last bolls to develop. When the cotton was sown several weeks earlier, plants were able to receive an additional benefit of soil moisture and nutrients during the extended growing season, which allowed more flower buds to form and the last bolls to mature because of sufficient AT. That raising the daily minimum temperatures from boll opening to stop growing could delay the date of maturation and prolong the growing season. Longer growing seasons increased the AT that could be obtained, which resulted in additional bolls reaching maturation. When sowing was delayed, the time required for the cotton to form buds decreased because of the warmer days (Table 2). However, at the end of the season, the late sowing pushed the bolls to develop into cooler weather and lengthened the duration required from anthesis to first boll opening, thus decreasing the yield. The yield and biomass increased with the increases of the growing season length according to sowing dates (Figure 13), although a significant correlation only appeared in the relationship between yield and growing season length in 2012 (Figure 13a). Yield and biomass in 2012 were higher than in 2011 because temperatures were higher in 2012 than in 2011 and the irrigation levels for the different sowing dates for both years were almost identical (Table 2). Therefore, the growing season length affected the yield and the sowing date was an important factor that affected cotton yield and biomass; this result was consistent with Mohammed et al. [12] and was partly consistent with Specht et al. [51], who stated that achieving a high total dry matter through adequate vegetative growth was an essential prerequisite for high reproductive growth and high yield in the soybean. Biomass had similar analysis results compared to yield for dates of sowing.
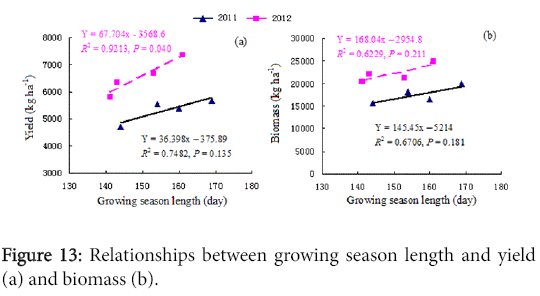
Figure 13: Relationships between growing season length and yield (a) and biomass (b).
The highest harvest index occurred on sowing date of in 2011, with a seasonal irrigation of 332.5 mm (Table 2), which was lower than the irrigation level of 345-380 mm reported by Cai et al. (2002). It could be explained by the reason that lower water supply reflected a greater biomass in reproductive growth as water stress increases, which was consistent with the opinions of many scholars who reported that the harvest index was generally higher at a lower water supply [52-56]. Ünlü et al. [4] suggested that a deficit in irrigation could increase the harvest index values from 0.26 to 0.32.
The values of TWUEyield in our present study were not consistent with results from previous studies in other regions using different irrigation methods. Anaç et al. (1999) reported that the values of TWUEyield of cotton in the coastal area of the Aegean region were 3.8-4.6 kg ha-1 mm-1 under deficit irrigation conditions. Kanber et al. [36] found TWUEyield values of 1.9-5.9 kg ha-1 mm-1 using the furrow method in Cukurova. Sezgin et al. (2001) employed various levels of nitrogen and water to evaluate its effect on cotton and detected TWUEyield values of 0.983-2.125 kg ha-1 mm-1. The TWUEyield values of cotton irrigated by LEPA and the drip method were 5.5-6.7 and 5.0-7.4 kg ha-1 mm-1 , respectively, in studies conducted on the Harran plain [34]. Dagdelen et al. [3,41] found TWUEyield values of 6.0-7.4 and 7.65-9.60 kg ha-1 mm-1 under deficit furrow and drip irrigation conditions, respectively, in the Aegean region of Turkey. Over-and under-irrigation in sandy loam soil in the USA were employed to produce TWUEyield values of 1.31-2.19 kg ha-1 mm-1 [44]. Ünlü et al. [4] discovered TWUEyield values of 4.7-8.8 kg ha-1 mm-1 under deficit irrigation conditions in Turkey. Different levels of drip irrigation caused TWUEyield values to vary from 8.1 to 11.3 kg ha-1 mm-1 in a study in China [45]; however, the WUE values for the different drip irrigation treatments were greater than the WUE values of cotton irrigated by a furrow system in the same region [3]. In the same region, Liu et al. [24] found TWUEyield values of 9.65-11.19 kg ha-1 mm-1 for three levels of drip irrigation with saline water. Our drip irrigation results using fresh water were 10.98-20.86 kg ha-1 mm-1, which could be explained by water quality differences compared to Liu et al. [24]. The higher TWUE might also be explained by the fact that soil evaporation was mostly eliminated by the plastic film. TWUEbio of cotton have seldom been reported.
Full irrigation water in this region was 404.8 mm [57]. The treatments in this study were all slightly water stressed because they received only 67.9-96.6% of the full irrigation water amount, with the differences caused by sowing dates. The sowing date in 2012 received the least amount of irrigation water, but it obtained the highest WUE and a high seed cotton yield. RDI treatment could improve the seed cotton yield and WUE (Pei et al 2000; Meng et al. 2008); however, many studies have shown that full irrigation obtained the highest seed cotton yield [4,41]. The reason might be sowing dates, cotton variety, climate conditions, soil status and management practices.
Seasonal irrigation water levels ranged from 275 to 391 mm (Table 2). Researchers in different regions provided different IWUEyield values of cotton. Kanber et al. detected IWUEyield values of 15-51 kg ha-1 mm-1 using the furrow irrigation method in Cukurova. Anaç et al. reported that the value of IWUEyield in the coastal part of the Aegean region was 4.8-6.5 kg ha-1 mm-1 under deficit irrigation conditions. Sezgin et al. employed various levels of nitrogen and water to evaluate the response of cotton and found IWUEyield values of 7.1-16.7 kg ha-1 mm-1. The IWUEyield values of cotton irrigated by LEPA and drip method were 5.8-7.7 and 6.0-8.1 kg ha-1 mm-1 , respectively, in studies on the Harran plain [34]. Dagdelen et al. [3,41] determined IWUEyield values of 7.4-15.2 and 8.15-14.40 kg ha-1 mm-1 under deficit furrow and drip irrigation conditions, respectively, in the Aegean region of Turkey. A value of IWUEyield of 10.9-12.5 kg ha-1 mm-1 was determined by deficit drip irrigation in studies on the Amik Plain (Onder et al. 2009). Ünlü et al. [4] found IWUEyield values of 6.3-33.1 kg ha-1 mm-1 under deficit irrigation conditions in Turkey. Different levels of drip irrigation water caused IWUEyield values to vary from 6.2 to 12.7 kg ha-1 mm-1 in studies in China [45]. The highest IWUEyield was obtained at the least level of irrigation water because water use efficiencies decreased with increasing water use [41].
Usually, water use efficiencies for yield (including TWUEyield and IWUEyield) are given more attention than water use efficiencies for biomass (including TWUEbio and IWUEbio) because of the profit involved. Excessive levels of irrigation water produce d additional biomass, not yield, so it was necessary to adopt drip irrigation to cultivate cotton in arid regions for improving water use efficiencies for yield. Low water productivity was caused by wasteful irrigation practices. In many areas of western China, scarce water resources are currently being used for supplemental irrigation of winter crops and excessive irrigation of summer crops. This practice wastes abundant amounts of water in conditions where water resources are scarce. Thus, the drip irrigation method and an optimum irrigation of water must be adopted. Water use efficiencies were affected by many factors, such as the variety of cotton, climate conditions, irrigation methods, irrigation water, agronomical practices and soil characteristics. To improve water use efficiencies, a comprehensive list of factors must be considered.
Maximum LAI of cotton was reported as 4.1 in the study of Orgaz et al. [58]. The maximum LAI values of cotton irrigated by LEPA and the drip method were 3.4 and 4.7, respectively, in studies on the Harran plain [34]. Ertek and Kanber [32] found a maximum LAI of 3.24-4.40 for drip-irrigated cotton. Additionally, Karam et al. [59] determined that the maximum LAI for cotton was reached at full bloom (92 d.a.s) and that the LAI value was 5.0 using drip-irrigated cotton. Dagdelen et al. [3,41] found maximum LAI values of 3.5 and 4.5 under deficit furrow and drip irrigation conditions, respectively, in the Aegean region of Turkey. Ünlü et al. [4] found a maximum LAI value of 5.99 under deficit irrigation conditions in Turkey, with the maximum LAI increasing until 110 days after planting under full drip irrigation and moderate deficit irrigation treatments (I100 and DI70) and 95 days after planting in the DI50 treatment [4]. The maximum LAI in the fully irrigated treatment (T100) increased until 97-98 days after emergence under drip irrigation [41] and 94-100 days after emergence under furrow irrigation [3]. In this experiment, the maximum LAI appeared until 75-81 days after sowing. A higher LAI for early sowing dates and supplemental irrigation probably increased the interception of temperature, and the subsequently greater CO2-fixing ability of the cotton plants resulted in accumulation of more assimilates, leading to higher seed cotton yield and biomass.
The seed cotton yield and biomass of cotton were closely related to temperature during the reproductive growth stage and increased by minimizing the crop exposure to high temperatures [8], avoiding lower temperatures at night [7] and minimizing water deficiency [4,41]. Earlier sowing dates resulted in longer vegetative and reproductive growth stages (Table 2). The growing season length of cotton was prolonged due to an increase of mean temperature during the growing season, which led the seed cotton yield to increase [11]. This implied that sowing dates affected the seed cotton yield. Thus, sowing date was a very important management tool for minimizing the impact of temperature and duration of the reproductive growth stage (Table 2).
The main effects associated with sowing date and year were significant with respect to the seed cotton yield and biomass for both years (Table 3). A significant difference of yield and biomass between years might be explained by climate difference because there was higher temperature in 2012 than in 2011 (Figure 1). Because yield can bring more profit than biomass, the yield for these sowing dates will be primarily discussed with respect to differences in meteorological parameters.
The main effects associated with sowing date and year were significant with respect to cotton yield for both years. Furthermore, the interaction term (sowing date × year) was also significant (Table 3). There was a trend towards reduced yield with delayed sowing dates that had a lower AT during the growing seasons. Weather data collected showed that the AT during the vegetative growth stage ranged from 840.2 to 924.1°C in 2011 and from 705.8 to 900.3°C in 2012. However, the range of days of the vegetative growth stage was 41-48 d in 2011 and 35-41 d in 2012. The AT from sowing to anthesis ranged from 1497.2 to 1574.8°C in 2011 and from 1720.2 to 1782.7°C in 2012. However, the range of days from sowing to anthesis was 64-73 d in 2011 and 71-81 d in 2012. This result suggested that cotton development was not only influenced by the AT but that time had an influence as well. The AT during the vegetative growth stage increased with delayed sowing dates; however, the AT from squaring to anthesis declined with delayed sowing dates. In addition, the AT from anthesis to first boll opening increased with delayed sowing dates, but the AT from first boll opening to maturity declined with delayed sowing dates. Finally, the AT during the reproductive growth stages declined with delayed sowing dates, which indicated that the duration of various stages in the development of cotton was closely related to the AT and the temperature required was highly dependent on the sowing date. The sowing date of (the normal sowing date) produced the highest yield and the later sowing dates produced lower yield (Table 2).
Because the sowing date was delayed, the number of days from sowing to first boll opening showed decreasing trends for both years. A reduced number of days from sowing to first boll opening induced by delayed planting might be explained by the fact that late-sown cotton developed quickly with higher AT and therefore, the vegetative growth stages were reduced (Table 2). The AT required from sowing to first boll opening decreased with the delay in sowing date. The AT from sowing to first boll opening ranged from 3105.3 to 2894.9 in 2011 and from 3195.8 to 3132.5 in 2012. However, the range of days from sowing to first boll opening was 133-123 in 2011 and 134-121 in 2012. The results suggested that the number of days from sowing to first boll opening varied with temperature conditions during the growing seasons and with sowing dates. Sowing date of reached maturity 8-20 days earlier than subsequent sowing dates, and maximum yield could be improved by 27% with sowing date of compared with the other three sowing dates in 2012 (Table 2).
Yield was affected by many meteorological parameters. The yield increased directly with the increases of DTR from full bloom to maturity, mean temperature during the whole growing season, AT and days from squaring to anthesis, SH during the whole growing season and mean temperature during the reproductive stage. The yield decreased with the increases of AT and days from sowing to emergence. However, the mainly effect factors of meteorological parameters were AT from squaring to anthesis, mean temperature during the whole growing season and AT from sowing to emergence. It was significant to choose the optimal planting date to improve yield. Meanwhile, yield was also affected by LAI, boll number per plant and gin turnout. However, the mainly effect factors of yield component were boll number per plant, gin turnout and boll weight. Gin turnout was affected by mean temperature during the whole growing season and mean DTR from boll setting to maturity. Boll number per plant suffered from mean DTR from boll setting to maturity and SH during the whole growing season.
The present study showed that sowing date of ? (the normal sowing date) not only accumulated more aboveground dry biomass but also produced more seed cotton yield and WUE ( including TWUEyield, TWUEbio, IWUEyield and IWUEbio ) than did later sowing dates, which indicated that the longer growing season produced higher yield and biomass. The sowing date, year and interaction effects of sowing date and year all significantly affected the yield and biomass. As a result, the sowing date was an important factor affecting the yield and biomass. With climate change, an earlier planting date might be an efficient method of increasing yield in the future.
In this study, the maximum LAI was 5.57, and the highest yield was not obtained at the highest LAI. The maximum LAI values appeared until 75-81 days after sowing. The planting date was a very important management tool in minimizing the impact of temperature and duration of the reproductive growth stage. The results of this study will provide a guideline for growers and management agencies to choose the optimum sowing date to increase yield in arid regions.
The work was supported by the National Basic Research Program of China '973' Program (2012CB956204-2), the Special Scientific Research Fund of the Meteorological Public Welfare Profession of China (GYHY201106029-9), and the National Natural Science Foundation of China (41275119).