Biochemistry & Pharmacology: Open Access
Open Access
ISSN: 2167-0501
ISSN: 2167-0501
Review Article - (2018) Volume 7, Issue 2
The osmotic fragility (OF) of isolated Red Blood cells (RBCs) in guinea pigs and rats was examined by monocarboxylic, dicarboxylic and their partition coefficients. A phosphate–NaCl buffer solution that comprises each carboxylic acid at the concentration ranging from 0 to 100 mM was used to incubate dense-packed RBCs at 37°C for 60 minutes. The RBC suspensions were moved into OF test tubes containing NaCl from 0.1 to 0.8%. The hemoglobin concentration was determined and was observed that NaCl concentration induced 50% hemolysis as the OF value. The OF was was increased by dose dependently the exposure to some monocarboxylic acids that possessed hydrocarbon chains of more than 4 carbons in length in case of rats but no increase was observed in guinea pig RBCs. A positive correlation was obtained between the partition coefficients and the degree of change in OF for monocarboxylic acids in the rat, but not in guinea pig RBCs. On the other hand, dicarboxylic acids are corresponding to the monocarboxylic acids had either no effect or decreased OF in rat and guinea pig RBCs. There was no correlation between the partition coefficients and change in OF for monocarboxylic acids in only guinea pig RBCs but for dicarboxylic acids in both rat and guinea pig RBCs. The partition coefficients of the monocarboxylic acids were higher comparatively the corresponding dicarboxylic acids. Whereas monocarboxylic acids are thought to act on the hydrophobic acyl-chain of phospholipids in the deeper regions of the RBC membrane, dicarboxylic acids act on the hydrophilic interface and shallower areas of the RBC membrane. The fluidity index based on fatty acid composition was observed higher in the rat than the guinea pig RBC membrane. The difference in fatty acid composition was speculated to be one of the causes of different OF response to monocarboxylic acids between rat and guinea pig RBCs.
Keywords: Carboxylic acid; RBC; Partition coefficient; Membrane; Osmotic fragility; Hemolysis; Rat; Guinea pig
In our previous study, it was revealed that the application of carboxylic acids with hydrocarbon chains of a certain length changes osmotic resistance in the erythrocytes (RBCs) in rats [1-5] and guinea pigs [4]. Since, monocarboxylic acids possessing more than 4 carbons in the hydrocarbon chain increased osmotic fragility (OF), most dicarboxylic acids either did not affect or, rather, decreased OF in rat RBCs while monocarboxylic acids show no affect or decreased OF in guinea pig RBCs [4]. As primary treatment of RBCs with trypsin did not change the OF reaction to carboxylic acids, we supposed that outer protein on the RBC membrane was less tangled in the OF response encouraged by carboxylic acids though the phospholipid layer of the RBC membrane was more involved in these phenomena [1].
Monocarboxylic acids are the combination of a hydrophobic hydrocarbon chain of various lengths and a hydrophilic carboxylic group. They are amphiphilic in the terms of physicochemical. These amphiphilic compounds are commonly thought to have a surfactant action on artificial or biological membranes [6-10]. Substances that are surface-active have known to permeate the membrane and produce mixed surfactant/lipid bilayers, a process generally called mixed micelle formation, before the saturation of surfactant to phospholipid ratio. The micelle formation disturbs the structure of the lipid layer and leads to the start of membrane solubilization, following lysis of the artificial or biological membrane [6-10]. Our previous report also showed that some monocarboxylic acids induce changes in OF following hemolysis in the rat and guinea pig RBCs [1-4]. Thus, the permeation of carboxylic acids into the cell membrane is assumed to be important in changing the OF and inducing hemolysis in the RBCs.
The partition coefficient is one physicochemical indicator for the delivery of a compound into an artificial or biological membrane [11]. The octanol/water partition coefficient is extensively used as octanol is closer in nature to the phospholipid membrane as compare to other non-polar solvents [12]. The logarithm of the partition ratio of chemicals into octanol and water was first evaluated and used as the log P values for each substance [13]. The log P values for various chemical substances are now commonly available on various websites.
Monocarboxylic and dicarboxylic acids are speculated to have physicochemical effects on the phospholipid layer via different mechanisms, resulting in changes in resistance to osmotic pressure in the rat and guinea pig RBC membrane [1-4]. We have recently reported the results of a regression analysis between the partition coefficients of carboxylic acids and the degree of change in OF in rat RBCs [5]. This analysis indicated that there is positive and statistically significant relationship between the partition coefficient of monocarboxylic acids, including benzoic acid, and their OF-increasing effect in the rat RBCs. On the other hand, there is no relationship between partition coefficient of dicarboxylic acids, including three isomers of phthalic acid, and their OF-decreasing effect.
Here, we attempt to clarify the relationship between the partition coefficients of carboxylic acids and the changes in OF persuaded by both types of acids in the rat and guinea pig RBCs [4]. In the present analysis, we used the data for the changes in OF induced by carboxylic acids in the rat and guinea pig RBCs [4] and the partition coefficient of each substance provided from the PubChem website [14]. These analyses clarified the cause of differences in OF response to monocarboxylic and dicarboxylic acids, as well as difference in OF response between rat and guinea pig RBCs.
Reagents
Reagents used in this experiment were already reported in our previous paper [4] and all were biochemical grade and purchased from Wako Pure chemical Co., Ltd. (Osaka, Japan) or Tokyo Kasei Kogyo Co., Ltd (Tokyo, Japan): formic acid, acetic acid, propionic acid, n-butyric acid, n-valeric acid, n-caproic acid, n-enanthic acid, n-caprylic acid, oxalic acid, malonic acid, succinic acid, glutaric acid, adipic acid, pimelic acid, suberic acid, azelaic acid, benzenemonocarboxylic acid (benzoic acid), 1, 2-benzenedicarboxylic acid (phthalic acid), 1, 3-benzenedicarboxylic acid (isophthalic acid), 1, 4-benzenedicarboxylic acid (terephthalic acid), cyclohexanemonocarboxylic acid, and 1, 2-, 1, 3-, and 1, 4-cyclohexanedicarboxylic acids (cis- and trans- mixture).
Animals
According to the National Institute of Health Guidelines for the Care and Use of Laboratory Animals, all the animals were maintained. The animals and their feeding conditions were already reported [4]. In brief, male Sprague-Dawley rats (Crl:CD (SD), 8 weeks old, Charles River Laboratories Japan, Inc., Japan) and male Hartley guinea pigs (Slc:Hartley, 4 weeks old, Japan SLC, Shizuoka, Japan) were housed in individual cages placed in a room with controlled temperature (22 ± 3°C), relative humidity (50 ± 20%) and lighting (light 08:00-20:00). The animals were allowed free intake of tap water and a pelleted rat diet (CRF-1, Oriental yeast Co., Ltd., Tokyo, Japan) or guinea pig diet (Labo G standard, Nosan Co., Yokohama, Japan) for more than 1 week before the sampling of blood. Blood samples were taken from the rats (387 ± 31 g, n=8) and guinea pigs (415 ± 74 g, n=12) from 9 to 12 (10 ± 1 weeks) and 5 to 7 weeks old (6 ± 1 weeks), respectively. The feeding of animals and sampling of blood were performed at the Institute of Experimental Animals in the New Drug Research Center, Inc. (Eniwa, Hokkaido, Japan).
Preparation of rat and guinea pig RBCs
Treatment of blood samples was already described in our previous report [4]. On the day of the experiment, the rats and guinea pigs were anesthetized with pentobarbital sodium (60 mg/kg) and blood samples (12-15 ml) were collected into heparinized test tubes from the abdominal aorta in rats and the postcava in guinea pigs. The RBCs were separated from the plasma and leucocytes by centrifugation at 2000 g for 15 min (Model 2420, Kubota Inc., Tokyo, Japan). The raw RBCs thus obtained were then washed three times with cold 0.9% NaCl solution at two times the volume of RBCs. The resultant crudepacked cell suspension was kept in ice-cold water until the series of experiments.
Experimental procedure
The experimental procedures were also described in our previous report [4]. The RBC suspension (30 μl) was transferred into 0.6 ml of phosphate-NaCl buffer solution (pH 7.4) containing monocarboxylic or dicarboxylic acids at 0, 0.1, 0.25, 0.5, 1, 2.5, 5, 10, 25, 50 or 100 mM in 1.5-ml micro test tubes (Nichiryo Co., Ltd., Tokyo, Japan). The osmolarity was adjusted to 0.9% NaCl solution by the addition of an appropriate amount of NaCl added to the buffer solution when each substance was applied. For the experiments testing each monocarboxylic acid (parent chemical) and its corresponding dicarboxylic acid, OF was assayed using RBCs derived from the same animal. All RBC suspensions exposed to the chemical compounds were incubated by shaking (1 stroke/sec) at 37°C for 1 h (Shaking Bath TBK 202 DA. Advantec Co., Ltd., Tokyo, Japan). Each RBC suspension was mixed gently by mixer (Vortex Genie 2, model-G560, Scientific Industry, Inc. NY., USA) after incubation, and then 50 μl aliquots were transferred into a 96 deep-well micro-plate (2 ml volume, Whatman Inc., Piscataway, NJ, USA) containing 1 ml of 0.1 to 0.8%NaCl solution. The deep well plate was immediately centrifuged at 1300 g (Plate Spin II, Kubota Inc., Tokyo, Japan) for 10 min at room temperature. The supernatants (200 μl) of the hemolyzed RBCs were transferred into another 96 well micro-plate (300 μl volume, Whatman Inc., Piscataway, NJ, USA), and then hemoglobin concentrations were determined colorimetrically at 540 nm (Microplate Reader Model 680, Bio-Rad Laboratories, Tokyo, Japan).
Statistical analysis
The statistical analyses were also depicted in our previous report [5]. RBC suspensions were completely haemolysed with 0.1% NaCl solution and hemoglobin concentration was maintained to 100%. 0.8% NaCl solution was unable to haemolysed the RBCs completely thus concentration was defined as 0.1%. by using a straight-line equation of the hemolysis curve between the points immediately adjacent to 50%, the effective concentration of the NaCl solution inducing 50% hemolysis (EC50) of the applied RBCs was calculated. The EC50 value was used to indicate the OF in the erythrocytes. The differences in OF between at 0 (control) and for carboxylic acid application at 10 mM, 25 mM, 50 mM and 100 mM were obtained and expressed as the ΔEC50. All values are expressed as means ± S.D. The significance of the differences between the control (0 mM) and subsequent concentrations (0.1-100 mM) was determined by Dunnett’s test following one-way ANOVA. The partition coefficients of each substance examined in previous experiment [4] were quoted mainly from the PubChem website for chemical and physical properties [14]. Regression analysis was used to assess the relationship between partition coefficients of the carboxylic acids and the ΔEC50 of the rat RBCs. Statistical analyses were performed using Excel Tokei for Windows 2012 (SSRI Co., Ltd., Tokyo, Japan). A difference with P<0.05 was considered to be statistically significant.
Typical changes in hemolytic curves and calculations of the OF value for rat and guinea pig RBCs treated with monocarboxylic acids and dicarboxylic acids are shown in Figure 1. For the application of 100 mM n-caprylic acid to rat RBCs, the EC50 shifted to the right from 0.365 ± 0.015 (control) to 0.581 ± 0.049 (100 mM) to give a ΔEC50 of 0.216 ± 0.039% NaCl. Application of 100 mM succinic acid induced a left shift in the EC50 from 0.379 ± 0.018 (control) to 0.332 ± 0.013 (100 mM) to give a ΔEC50 of -0.047 ± 0.020 NaCl%. The ΔEC50 values for the other monocarboxylic and dicarboxylic acids at 10 mM, 25 mM, 50 mM and 100 mM are summarized in Tables 1-4.

Figure 1: Typical changes in the hemolysis curve induced by carboxylic acid application and calculation of the ΔEC50 in rat and guinea pig RBCs. Values are means ± SD (n=6). The EC50 value for hemolysis (% of NaCl concentration) was obtained by using a straight-line equation between the points immediately above and below 50%. The value for 50% of hemolysis (EC50), which is expressed as the NaCl concentration, was calculated from the application of n-caprylic acid (upper panel) and succinic acid (lower panel) to rat RBCs at 100 mM. Other data for ΔEC50 values for monocarboxylic and dicarboxylic acids applied at 10, 25, 50 and 100 mM are summarized in Tables 1-3.
| No of hydrocarbon | Monocarbixylic acid | Partition coefficient | Dose (mM) | Change in OF: ⊿EC50 (NaCl %) | |||
|---|---|---|---|---|---|---|---|
| Rat | Guinea pig | ||||||
| 0 | Formic acid H-COOH | -0.54 | 10 | -0.030 ± 0.005 | * | -0.029 ± 0.009 | ** |
| 25 | -0.029 ± 0.008 | * | -0.025 ± 0.008 | * | |||
| 50 | -0.030 ± 0.005 | * | -0.038 ± 0.017 | ** | |||
| 100 | -0.045 ± 0.025 | ** | -0.030 ± 0.020 | ** | |||
| 1 | Acetic acid CH3-COOH | -0.17 | 10 | 0.001 ± 0.009 | -0.004 ± 0.010 | ||
| 25 | -0.003 ± 0.010 | 0.013 ± 0.009 | |||||
| 50 | -0.003 ± 0.010 | -0.015 ± 0.014 | |||||
| 100 | -0.004 ± 0.015 | -0.006 ± 0.011 | |||||
| 2 | Propionic acid CH3-CH2-COOH | 0.33 | 10 | -0.001 ± 0.023 | 0.000 ± 0.016 | ||
| 25 | -0.005 ± 0.022 | -0.005 ± 0.017 | |||||
| 50 | -0.001 ± 0.027 | -0.011 ± 0.011 | |||||
| 100 | 0.011 ± 0.031 | 0.001 ± 0.018 | |||||
| 3 | n-Butyric acid CH3-(CH2)2-COOH | 0.79 | 10 | 0.005 ± 0.016 | 0.010 ± 0.011 | ||
| 25 | 0.006 ± 0.015 | 0.004 ± 0.012 | |||||
| 50 | 0.009 ± 0.022 | 0.005 ± 0.013 | |||||
| 100 | 0.034 ± 0.020 | ** | 0.011 ± 0.022 | ||||
| 4 | n-Valeric acid CH3-(CH3)3-COOH | 1.39 | 10 | 0.035 ± 0.016 | 0.008 ± 0.019 | ||
| 25 | 0.057 ± 0.015 | ** | 0.004 ± 0.015 | ||||
| 50 | 0.083 ± 0.018 | ** | -0.004 ± 0.017 | ||||
| 100 | 0.126 ± 0.018 | ** | 0.013 ± 0.023 | ||||
| 5 | n-Caproic acid CH3-(CH2)4-COOH | 1.92 | 10 | 0.085 ± 0.022 | ** | 0.009 ± 0.016 | |
| 25 | 0.133 ± 0.021 | ** | -0.002 ± 0.015 | ||||
| 50 | 0.188 ± 0.025 | ** | -0.009 ± 0.021 | ||||
| 100 | 0.216 ± 0.039 | ** | 0.005 ± 0.019 | ||||
| 6 | n-Enanthic acid CH3-(CH2)5-COOH | 2.42 | 10 | 0.135 ± 0.027 | ** | 0.010 ± 0.020 | |
| 25 | 0.171 ± 0.013 | ** | -0.007 ± 0.011 | ||||
| 50 | 0.200 ± 0.021 | ** | 0.017 ± 0.009 | ||||
| 100 | 0.225 ± 0.039 | ** | 0.022 ± 0.017 | ||||
| 7 | n-Caprylic acid CH3-(CH2)6-COOH | 3.05 | 10 | 0.091 ± 0.016 | ** | 0.006 ± 0.014 | |
| 25 | 0.105 ± 0.012 | ** | 0.012 ± 0.018 | ||||
| 50 | 0.236 ± 0.043 | ** | No data | ||||
| 100 | No data | No data | |||||
Table 1: Monocarboxylic acids possessing straight hydrocarbon chains, their chemical structure, partition coefficients and effect on the OF in rat and guinea pig RBCs in vitro. The partition coefficients were obtained from a website of the PubChem website [14]. Values are means ± SD (n=6). Asterisks indicate that there was a significant difference (* P<0.05 and ** P<0.01) between the control (0 mM) and subsequent concentration (0.1-100 mM) on the basis of Dunnett’s test [4]. As there were no significant changes for exposure to 0.1-5 mM of all tested monocarboxylic and dicarboxylic acids, the EC50 value at those doses are omitted and only the data for 10, 25, 50 and 100 mM are presented.
| No of hydrocarbon | Dicarbixylic acid | Partition coefficient | Dose (mM) | Change in OF: ⊿EC50 (NaCl %) | |||
|---|---|---|---|---|---|---|---|
| Rat | Guinea pig | ||||||
| 0 | Oxalic acid HOOC-COOH | -0.81 | 10 | -0.025 ± 0.020 | -0.011 ± 0.009 | ||
| 25 | -0.039 ± 0.028 | -0.021 ± 0.011 | |||||
| 50 | -0.050 ± 0.037 | ** | -0.023 ± 0.015 | ||||
| 100 | -0.068 ± 0.033 | ** | -0.036 ± 0.019 | * | |||
| 1 | Malonic acid HOOC-CH2-COOH | -0.81 | 10 | -0.016 ± 0.006 | * | 0.000 ± 0.009 | |
| 25 | -0.025 ± 0.014 | ** | -0.021 ± 0.016 | ** | |||
| 50 | -0.042 ± 0.023 | ** | -0.028 ± 0.012 | ** | |||
| 100 | -0.095 ± 0.010 | ** | -0.035 ± 0.012 | ** | |||
| 2 | Succinic acid HOOC-(CH2)2-COOH | -0.59 | 10 | -0.007 ± 0.017 | -0.004 ± 0.020 | ||
| 25 | -0.022 ± 0.016 | -0.023 ± 0.027 | |||||
| 50 | -0.034 ± 0.033 | ** | -0.041 ± 0.018 | ** | |||
| 100 | -0.043 ± 0.032 | ** | -0.047 ± 0.020 | ** | |||
| 3 | Glutaric acid HOOC-(CH2)3-COOH | -0.47 | 10 | -0.008 ± 0.012 | -0.001 ± 0.015 | ||
| 25 | -0.010 ± 0.011 | -0.010 ± 0.020 | |||||
| 50 | -0.029 ± 0.010 | ** | -0.024 ± 0.011 | * | |||
| 100 | -0.043 ± 0.014 | ** | -0.031 ± 0.013 | ** | |||
| 4 | Adipic acid HOOC-(CH2)4-COOH | -0.29 | 10 | -0.014 ± 0.013 | -0.006 ± 0.014 | ||
| 25 | -0.027 ± 0.028 | -0.013 ± 0.008 | |||||
| 50 | -0.043 ± 0.023 | * | -0.027 ± 0.013 | ||||
| 100 | -0.052 ± 0.035 | ** | -0.035 ± 0.015 | * | |||
| 5 | Pimelic acid HOOC-(CH2)5-COOH | 0.61 | 10 | 0.001 ± 0.027 | -0.004 ± 0.006 | ||
| 25 | -0.006 ± 0.017 | -0.014 ± 0.013 | |||||
| 50 | -0.026 ± 0.009 | -0.028 ± 0.013 | * | ||||
| 100 | -0.049 ± 0.030 | ** | -0.029 ± 0.012 | * | |||
| 6 | Suberic acid HOOC-(CH2)6-COOH | 0.8 | 10 | 0.007 ± 0.023 | 0.000 ± 0.011 | ||
| 25 | 0.006 ± 0.018 | -0.002 ± 0.022 | |||||
| 50 | -0.013 ± 0.015 | -0.022 ± 0.015 | |||||
| 100 | -0.042 ± 0.024 | * | -0.038 ± 0.020 | * | |||
| 7 | Azelaic acid HOOC-(CH2)7-COOH | 1.57 | 10 | 0.009 ± 0.017 | 0.005 ± 0.011 | ||
| 25 | 0.009 ± 0.018 | -0.004 ± 0.013 | |||||
| 50 | -0.001 ± 0.025 | -0.025 ± 0.013 | |||||
| 100 | -0.017 ± 0.031 | -0.038 ± 0.023 | * | ||||
Table 2: Dicarboxylic acids possessing straight hydrocarbon chains, their chemical structure, partition coefficients and effect on the OF in rat and guinea pig RBCs in vitro. The partition coefficients were obtained from a website of the PubChem website [14]. Values are means ± SD (n=6). Asterisks indicate that there was a significant difference (* P<0.05 and ** P<0.01) between the control (0 mM) and subsequent concentration (0.1-100 mM) on the basis of Dunnett’s test [4]. As there were no significant changes for exposure to 0.1-5 mM of all tested monocarboxylic and dicarboxylic acids, the EC50 value at those doses are omitted and only the data for 10, 25, 50 and 100 mM are presented.
| No of hydrocarbon | Dicarbixylic acid | Dose (mM) | Change in OF: ⊿EC50 (NaCl %) | ||||
|---|---|---|---|---|---|---|---|
| Rat | Guinea pig | ||||||
| 6 | Benzoic acid |
1.87 | 10 | 0.022 ± 0.013 | 0.001 ± 0.008 | ||
| 25 | 0.044 ± 0.020 | * | -0.006 ± 0.006 | * | |||
| 50 | 0.057 ± 0.026 | ** | -0.015 ± 0.005 | * | |||
| 100 | 0.105 ± 0.022 | ** | -0.034 ± 0.022 | * | |||
| 6 | Phthalic acid |
0.73 | 10 | 0.019 ± 0.029 | 0.005 ± 0.003 | ||
| 25 | 0.001 ± 0.016 | -0.010 ± 0.003 | |||||
| 50 | -0.008 ± 0.017 | -0.017 ± 0.008 | |||||
| 100 | -0.003 ± 0.027 | -0.043 ± 0.016 | |||||
| 6 | Isophthalic acid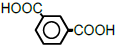 |
1.66 | 10 | -0.009 ± 0.015 | -0.006 ± 0.011 | ||
| 25 | -0.018 ± 0.007 | -0.007 ± 0.020 | |||||
| 50 | -0.040 ± 0.017 | ** | -0.013 ± 0.013 | * | |||
| 100 | -0.092 ± 0.024 | ** | -0.039 ± 0.023 | * | |||
| 6 | Terephthalic acid |
2.00 | 10 | -0.011 ± 0.007 | 0.015 ± 0.017 | ||
| 25 | -0.018 ± 0.013 | 0.013 ± 0.019 | |||||
| 50 | -0.041 ± 0.022 | ** | -0.003 ± 0.015 | ||||
| 100 | -0.066 ± 0.033 | ** | -0.018 ± 0.009 | * | |||
| 6 | Cyclohexane-monocarboxylic acid |
1.96 | 10 | 0.136 ± 0.043 | ** | -0.006 ± 0.014 | |
| 25 | 0.222 ± 0.032 | ** | -0.020 ± 0.013 | ||||
| 50 | 0.301 ± 0.023 | ** | -0.026 ± 0.012 | ||||
| 100 | 0.319 ± 0.054 | ** | -0.032 ± 0.012 | ** | |||
| 6 | 1,2-Cyclohexane-dicarboxylic acid |
0.64 | 10 | -0.002 ± 0.014 | -0.006 ± 0.015 | ||
| 25 | -0.011 ± 0.011 | -0.021 ± 0.022 | |||||
| 50 | -0.020 ± 0.029 | -0.028 ± 0.024 | * | ||||
| 100 | -0.033 ± 0.025 | -0.060 ± 0.029 | * | ||||
| 6 | 1,3-Cyclohexane-dicarboxylic acid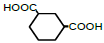 |
0.46 | 10 | 0.003 ± 0.018 | -0.008 ± 0.017 | ||
| 25 | 0.013 ± 0.011 | -0.017 ± 0.016 | |||||
| 50 | 0.011 ± 0.019 | -0.029 ± 0.018 | * | ||||
| 100 | 0.027 ± 0.035 | -0.030 ± 0.018 | ** | ||||
| 6 | 1,4-Cyclohexane-dicarboxylic acid |
0.83 | 10 | 0.014 ± 0.010 | -0.006 ± 0.007 | ||
| 25 | -0.011 ± 0.013 | -0.017 ± 0.019 | |||||
| 50 | -0.010 ± 0.009 | -0.048 ± 0.034 | ** | ||||
| 100 | -0.027 ± 0.013 | -0.066 ± 0.035 | ** | ||||
Table 3: Monocarboxylic and dicarboxylic acids possessing a benzene ring, their chemical structure, partition coefficients and effect on the OF in rat and guinea pig in vitro The partition coefficients were obtained from a website of the PubChem website [14]. Values are means ± SD (n=6). Asterisks indicate that there was a significant difference (* P<0.05 and ** P<0.01) between the control (0 mM) and subsequent concentration (0.1-100 mM) on the basis of Dunnett’s test [4]. As there were no significant changes for exposure to 0.1-5 mM of all tested monocarboxylic and dicarboxylic acids, the EC50 values at those doses are omitted and only the data for 10, 25, 50 and 100 mM are presented.
| Substances | Dose (mM) | Rat | Guinea pig | ||
|---|---|---|---|---|---|
| r value | P value | r value | P value | ||
| Monocarboxylic acids | 10 | 0.8322 | <0.005 | 0.6308 | 0.051 |
| 25 | 0.7823 | <0.01 | 0.5363 | 0.110 | |
| 50 | 0.8480 | <0.002 | 0.2290 | 0.553 | |
| 100 | 0.8873 | <0.002 | 0.1867 | 0.631 | |
| Dicarboxylic acids | 10 | 0.5110 | 0.062 | 0.5152 | 0.059 |
| 25 | 0.5302 | 0.051 | 0.7579 | <0.002 | |
| 50 | 0.3492 | 0.221 | 0.4656 | 0.093 | |
| 100 | 0.1588 | 0.588 | 0.1057 | 0.719 | |
Table 4: Correlation between the partition coefficients of carboxylic acids and change in EC50 during hemolysis in rat and guinea pig RBCs. (Values were calculated by regression analysis (mean value of each carboxylic acid; n=6) of the partition coefficients and changes in EC50 during hemolysis induced by each concentration of the monocarboxylic and dicarboxylic acids possessing straight hydrocarbon chains, or benzene and cyclohexane rings, Correlation efficiency “r” and significance “P” are shown. A value of P<0.05 is defined as statistically significant in the present study).
The chemical structures of monocarboxylic acids possessing straight hydrocarbon chains, their partition coefficients and their effects on ΔEC50 in rat and guinea pig RBCs are shown in Table 1. The partition coefficients of monocarboxylic acids increased in accordance with increase in the numbers of carbon atoms in their moiety. Although the application of formic acid decreased OF in a dose-dependent manner, acetic and propionic acid did not change OF, even at a dose of 100 mM, in rat RBCs.
Monocarboxylic acids from n-butyric acid (3 carbons) to n-caprylic acid (7 carbons) increased OF in rat RBCs in a concentration- and carbon atom-dependent manner. On the other hand, while application of formic acid decreased OF dose-dependently, monocarboxylic acids possessing 1 to 7 carbons did not change OF in guinea pig RBCs. The ΔEC50 values in rat RBCs at 100 mM and in guinea pig RBCs at 50 mM and 100 mM could not obtained for n-caprylic acid as its application at those concentrations immediately induced complete hemolysis.
The chemical structures of dicarboxylic acids possessing straight hydrocarbon chains, their partition coefficients and changes in EC50 in rat and guinea pig RBCs are shown in Table 2. Partition coefficients of the straight-chain dicarboxylic acids, except for oxalic acid, also increased with increases in the number of carbon atoms in their moiety. The application of dicarboxylic acids possessing straight hydrocarbon chains, except for azelaic acid, decreased OF in a dose-dependent manner in rat RBCs. In guinea pig RBCs, all dicarboxylic acids tested in this study decreased OF dose-dependently.
The chemical structure of monocarboxylic and dicarboxylic acids possessing cyclic hydrocarbon chains, partition coefficients and ΔEC50 in rat and guinea pig RBCs are shown in Table 3. The partition coefficients of benzoic acid, phthalic acid and its two isomers are dependent on the number and position of their carboxylic group. The effects of those substances on OF also depend on their molecular structure. While phthalic acid did not change OF, benzoic acid increased, and isophthalic and terephthalic acids decreased OF in rat RBCs. Although cyclohexane monocarboxylic acid markedly increased OF, none of the three cyclohexane dicarboxylic acids induced changes in OF in rat RBCs. On the other hand, benzoic acid, isophthalic and terephthalic acid decreased (P<0.05) and phthalic acid tended to decrease OF (P>0.05, not significant, N.S) in guinea pig RBCs. Cyclohexane monocarboxylic acid and all three kinds of cyclohexane dicarboxylic acid slightly but dose-dependently decreased OF in guinea pig RBCs (P<0.05).
Figure 2 shows the results of the regression analysis for the partition coefficients of carboxylic acids and their effects on OF in rat and guinea pig RBCs. Positive and statistically significant correlations were obtained between the partition coefficients of monocarboxylic acids, including benzoic acid and cyclohexane monocarboxylic acid, and their effects on ΔEC50 at concentrations of 50 mM and 100 mM in rat RBCs (Figure 2A). On the other hand, for dicarboxylic acids including phthalic acid and its 2 isomers, and three kinds of cyclohexane dicarboxylic acids, no statistically significant linear relationships were obtained between the partition coefficients and the ΔEC50 values in rat RBCs (Figure 2C). In guinea pig RBCs, there were no correlations between partition coefficients and OF in for either the monocarboxylic acids or dicarboxylic acids at 50 or 100 mM (Figures 2B and 2D).

Figure 2: Relationship between the partition coefficient and degree of change in OF obtained by exposure to monocarboxylic or dicarboxylic acids. Values are means (n=6). The partition coefficients were obtained from the PubChem website [14]. The OF value was obtained from the changes in ED50 induced by the application of monocarboxylic acids in rat (A) or guinea pig RBCs (B), and dicarboxylic acids in rat (C) or guinea pig RBCs (D) at 50 (open circles) and 100 mM (closed circles). Correlation efficiency “r” and significant values “P “ , including the data for the application of carboxylic acids at 10 and 25 mM, are shown in Table 4.
Table 4 shows the results of the regression analysis for the partition coefficients of carboxylic acids and changes in EC50 during hemolysis in rat and guinea pig RBCs. In the rat RBCs, positive and statistically significant correlations were observed between the partition coefficients and changes in OF induced by monocarboxylic acids at 10, 25, 50 and 100 mM, whereas no definite correlations were obtained for dicarboxylic acids at same four concentrations. In guinea pig RBCs, except for dicarboxylic acid at 25 mM (P<0.002), no definite correlations were obtained for monocarboxylic or dicarboxylic acids from 10 mM to 100 mM.
We have reported that the monocarboxylic and dicarboxylic acids induced different OF responses between rat and guinea pig RBCs [4]. Most of the monocarboxylic acids tested, except for those possessing a short straight hydrocarbon chain with less than 3 carbons, increased OF in the rat RBCs. However, none of the monocarboxylic acids showed OF-increasing activity in guinea pig RBCs. In terms of the dicarboxylic acids, most of the tested acids decreased OF in both rat and guinea pig RBCs. In addition, we have recently reported that there is positive and statistically significant correlation between the partition coefficients of monocarboxylic acids and their OF-increasing effects, whereas there is no correlation between the partition coefficients of dicarboxylic acids and their OF-decreasing effects in the rat RBCs [5].
In the present analysis, we evaluated the relationship between the degree of change in OF (ΔEC50) in rat and guinea pig RBCs [4] and the permeation of carboxylic acids into the phospholipid layer based on partition coefficient values. The partition coefficient is a physicochemical index of the permeation of a substance into the cell membrane, and it is useful for predicting the delivery or effect of chemicals on cells, tissues or the body [15-18]. We used regression analysis to evaluate the relationship between ΔEC50 in the RBCs exposed to carboxylic acids and their partition coefficients obtained the PubChem website [14].
The partition coefficients were found to increase with increase in the number of carbon atoms bonded to the one or two carboxylic groups in the monocarboxylic or dicarboxylic acids, respectively. The partition coefficients in monocarboxylic acids are higher than those in the corresponding dicarboxylic acids with the same number of carbons as the monocarboxylic acids, except for benzoic acid and the isomers of phthalic acids. These facts indicate that the affinity for the RBC membrane, particularly the hydrophobic acyl-chains, of monocarboxylic acids is higher than that of the corresponding dicarboxylic acids. In terms of rat RBCs, the ΔEC50 values were observed to increase with increases in the partition coefficient of monocarboxylic acids possessing straight hydrocarbon chains, or a benzene and cyclohexane ring. Positive and statistically significant correlations were obtained between the partition coefficients of the monocarboxylic acids and the ΔEC50 values induced by these acids. These results indicate that the partition coefficient of a monocarboxylic acid can be used as an indicator of its potential to decrease membrane resistance to osmotic pressure following hemolysis in the rat RBCs. While most of the dicarboxylic acids decreased OF in the rat RBCs, there was no definite correlation between the partition coefficients of the dicarboxylic acids and their effect on ΔEC50. This finding suggests that the partition coefficient is not an appropriate indicator for evaluating the changes in OF induced by the action of the dicarboxylic acids on the rat RBC membrane. We also obtained the same results from a regression analysis of the partition coefficients of carboxylic acids and their effect on OF in rat RBCs [5].
With regard to the guinea pig RBCs, except for formic acid which decreased OF in a dose-dependent manner, most of the monocarboxylic acids possessing straight hydrocarbon chains did not change OF. Benzoic acid and cyclohexane monocarboxylic acid also decreased OF dose-dependently. However, no definite correlation was demonstrated between the partition coefficients of the monocarboxylic acids tested and their effect on ΔEC50 in the guinea pig RBCs. Although, all of the dicarboxylic acids tested in this study decreased OF in a dose-dependent manner, there was no correlation between the partition coefficients of the dicarboxylic acids tested and their effect on ΔEC50 in guinea pig RBCs. These results indicate that the partition coefficient cannot be considered to be an indicator of the action of monocarboxylic and dicarboxylic acids on the RBC membrane in guinea pigs.
Monocarboxylic acids are composed of a hydrophobic hydrocarbon chain with a different number of carbon atoms and one hydrophilic carboxylic group, with the entire molecule being amphiphilic in physicochemical terms. There are some debates over whether monocarboxylic acids possessing a small number of carbon atoms (<10) should [10] or should not be [9] recognized as surfactants in pharmacological literature. In any case, as they have both hydrophilic and hydrophobic elements in the moieties, they are thought to have at least a weak surfactant-like effect on the cell membrane. Our previous experiments also demonstrated that they have a surfactant-like effect and induce partial and/or complete hemolysis in rat and guinea pig RBCs [1-4].
The mechanism underlying surfactant action has been examined in detail and described in many reviews [6-10]. The first step is permeation into the cell membrane and the partition coefficient can be used as an index of permeability into biological or artificial membranes [19-24]. The second step after permeation of the surfactant into the cell membrane is the production of mixed surfactant/lipid bilayers (known as mixed micelle formation) before saturation of the surfactant to phospholipid ratio [6-8]. The concentration at which each substance partitioned in the phospholipid layer changes to solubilize the membrane is called the critical micellar concentration (CMC). As a third step, destruction or puncture of cell occurs after solubilization of the membrane [6-8]. As cell lysis is generally evoked by membrane solubilization above the CMC, surfactants with a low CMC are more hemolytic. Hemolysis in relation with the CMC of each surfactant also occurs under hypotonic conditions [25,26]. The mechanism of hemolysis evoked by osmolarity was also clarified in detail and reported in many studies [27,28].
With regard to the reason why OF increased in rat, but not in guinea pig RBCs, we speculated that this might be explained by differences in the phospholipid composition of the RBC membrane between rats and guinea pigs [4]. Phospholipids in the cell membrane are composed of a hydrophilic head containing phosphorus and two acyl- chains derived from fatty acids. There are different kinds of head elements in the phospholipids in the RBC membrane and the head type of the phospholipids differ among animal species [29]. Although it was reported that the ratio and composition of the head group affect the fluidity of the RBC membrane [30], there are no difference in the ratio of the head group composition and the fluidity index calculated from their respective values between the rat and guinea pig RBC membranes [31,32]. On the other hand, the fatty acid composition of the phospholipids varies considerably between the rat and guinea pig RBCs [33]. We calculated the saturation index, which expresses cell membrane fluidity [34], and found that this index is lower in rat RBCs than in guinea pig RBCs [4]. This result suggests that membrane fluidity in rat RBCs is higher than that in guineas pig RBCs.
The most common fatty acid in rat RBCs is arachidonic acid, which accounts for approximately 30% of the total fatty acids [33,35]. In this respect, fatty acid composition in rat RBCs is unique compared to that in guinea pig RBCs [33] or other animal species [33,36]. Arachidonic acid is polyunsaturated fatty acids, which has four unsaturated carbon bonds and a crooked hydrocarbon chain in its moiety. This molecular structure is speculated to disturb the rigid binding of acyl-chains aligned linearly in the phospholipid layer of the cell membrane (Figure 3). In a previous experiment, total replacement of native phosphatidylcholine (PC) with 1-palmitoil-2-oleoyl and 1-palmitoil-2-linoleoyl PC in the outer layer of human RBCs by using a specific PC transfer protein did not have an effect on OF values or potassium ion (K+) permeability [37]. On the other hand, the introduction of 1-palmitoil-2-alachidonoyl PC into human RBCs induces K+ leakage from cells.

Figure 3:Schematic representations illustrating the distribution of monocarboxylic acids and dicarboxylic acids in the RBC membrane in rat and guinea pigs. Monocarboxylic acids with a high partition coefficient permeate deeply into the phospholipid layer and have a surfactant-like effect on the rat RBC membrane with its loose combination of acyl-chains, but not on the guinea pig RBC membrane with its rigid combination of acyl-chains. Monocarboxylic acids with la ow partition coefficient locate close to the water-lipid interface and do not have a surfactant effect. Dicarboxylic acids also locate close to the water-lipid interface and fill the space composed of the heads and roots of the acyl-chains of the phospholipids in the RBC membrane in both species. We proposed that the effect of dicarboxylic acids, including isomers of phthalic acids, on the RBC membrane can be regarded as a “wedge-like effect” [3].
In the rat RBC membrane, hydrophilic carboxylic groups bound to hydrocarbon elements were speculated to be pulled into the acyl-chain matrix which has loose bonds and fluidity within the phospholipid layer (Figure 3). It is speculated that a monocarboxylic acid/acyl-chain complex is produced and the micelle is formed in the rat RBC membrane. Water also invades from the lipid-water interface due to osmotic pressure, inducing perturbation and destruction of the membrane following hemolysis. Compounds with longer hydrocarbon chains have stronger effects on the RBC membrane, increasing OF following cell membrane lysis. Thus, differences in fatty acid composition between the RBC membranes are thought to be one of the explanations of the different OF responses between rat and guinea pig RBCs.
Contrary to the effects observed for monocarboxylic acids, the application of dicarboxylic acids decreased or tended to decrease OF in both the rat and guinea pig RBCs. These OF responses in the RBCs of the two species could not be explained by differences in the fatty acid composition of the RBC membranes. Except for benzoic acid and terephthalic acid, the partition coefficients of dicarboxylic acids are lower than those of the corresponding monocarboxylic acids. This fact means that the moieties of the dicarboxylic acids are more hydrophilic than those of the corresponding monocarboxylic acids. Thus, the dicarboxylic acids are not able to enter deeply the hydrophobic lipid regions of the RBC membrane from the water-lipid interface (Figure 3). There is a space in the lipid-water interface region of the RBC membrane that is enclosed by the roots of two acyl-chains and the phospholipid heads. The physicochemical character of this area dose not differ much between the rat and guinea pig RBCs as there is little difference in the reported composition of the head elements of the phospholipids. In addition, there are fewer unsaturated carbon atoms in the roots of acyl-chains close to the phospholipid heads than those in the trunks of acyl-chains far from the phospholipid heads (Figure 3).
When dicarboxylic acids act on the RBC membrane, the hydrocarbon chains can enter this region with the carboxylic groups at either end remaining in the water-lipid interface. Thus, the hydrocarbon chain between the two carboxylic groups should form a rigid U- or V-shaped structure in this area (Figure 3). We have already proposed the “wedge-like effect” of dicarboxylic acids in stabilizing the RBC membrane and increasing resistance to osmotic pressure [3]. In this study, although most monocarboxylic acids with straight hydrocarbon chains did not effect OF, benzoic acid (benzene monocarboxylic acid) demonstrated OF-decreasing effect in guinea pig RBCs.
This OF response to benzoic acid is also thought to be dependent with the characteristics of RBC membrane based to the fatty acids compositions. Thus, we need to expand our proposed idea to add the recognition that the “wedge-like effect” is not only induced by dicarboxylic acids, but also by monocarboxylic acid with a benzene ring possessing conjugated carbon bound (Figure 3).
The octanol/water partition coefficient has been widely used as an indicator of the distribution of hydrophobic drugs in cells, tissues and the body [38-40]. Compared to other non-polar solvents such as hexanol, cyclohexane, dodecane or chloroform, the n-octanol was reported to be a closer analogue of the phospholipids in the biological membrane [12]. It has been reported that for many chemicals, however, their action on a biological or artificial phospholipid membrane dose not correlate to their octanol/water partition coefficient [41-43]. This can be explained by the fact that not only factors associated with the chemical substance itself, but also the condition of the membrane, such as the type of phospholipids, including the type of head group and fatty acid composition, and the amount of cholesterol in the RBC membrane interacting with the chemical substances [44-47]. In the present analysis, the fatty acid composition in the rat RBC membrane is thought to correspond to the partition coefficient based on the log P octanol/water value, but this is not true for the guinea pig RBC membrane, Although the partition coefficient is a useful indicator of the physicochemical characteristics of substances, it is difficult to explain the whole effect of carboxylic acids on the RBC membrane inducing change in OF based simply on the partition coefficient.
Further experiments using RBCs from other species in which the RBC membranes have different fatty acid compositions in the phospholipid layer could reveal the mechanism for the carboxylic acid-induced changes in the membrane characteristics, especially the differences in the effects of monocarboxylic acids and dicarboxylic acids. The fatty acid composition of the RBC membrane is an interesting problem when examining the interactions with carboxylic acids. The ratio and type of acyl-chains in the phospholipid layer which is respond to the carboxylic acids need to be clarified.
This approach could help to reveal the mechanism for the changes in membrane resistance to osmolarity induced by carboxylic acids. In addition, further investigations using various types of carboxylic acids which have a more complex hydrocarbon structure, such as branched or cyclic hydrocarbons, are needed to clarify in more detail the interaction between the hydrocarbons in chemicals and the phospholipids in the cell membrane.
I would like to thank Mr. K. Kasai, R. Makihara and T. Yuuki of Hokkaido Bunkyo University, for their excellent technical assistance.