Journal of Horticulture
Open Access
ISSN: 2376-0354
ISSN: 2376-0354
Research Article - (2018) Volume 5, Issue 2
Population growth in towns and cities requires new construction of homes and conversion of native land use to urban and suburban landscapes. Municipal tap water is generally used for irrigating these urban and suburban landscapes and its water quality can differ globally dependent on whether it is sourced from ground or surface waters. We examined runoff dissolved organic carbon (DOC) and organic nitrogen (DON) concentrations, fluxes and exports from newly installed, fertilized and unfertilized St. Augustine (Stenotaphrum secundatum (Walt.) Kuntze ‘Raleigh’) sod irrigated with a sodic municipal tap water during two 5-week establishment periods (August and September). In unfertilized plots, concentrations of DOC in runoff significantly increased from 20.5 to 73.7 mg L-1 and from 29.6 to 113.3 mg L-1 Runoff concentrations of DOC in fertilized plots significantly increased from 27.3 to 72.0 mg L-1 and from 30.0 to 120.3 mg L-1. Concentrations of DON in runoff did not increase in either unfertilized or fertilized plots. Total DOC exports were 2036 ± 803 kg km-2 and 3341 ± 227 kg km-2 and DON exports were 99 ± 43 kg km-2 and 134 ± 15 kg km-2 respectively for the two turfgrass installation dates for the unfertilized plots. Fertilization had no significant effect on DOC and DON exports (p = 0.29 and 0.18). Na+, K+, Mg2+ and Ca2+ were implicated in both DOC and DON fluxes suggesting that as resources for irrigation water for urban landscapes decline and alternative irrigation water supplies such as grey and black water are utilized we would expect, due to their higher Na+ content that DOC and DON fluxes to urban watersheds will increase.
Keywords: DOC; DON; Cations; Urban; Turfgrass; Runoff
The southern region of the USA, characterized by a humid, sub-tropical climate, is one of the most rapidly urbanizing areas in the USA [1]. Between 1982 and 2007 a 79% increase (21 million acres) in the extent of land development occurred [1]. Over the next 30 years, Exum et al. [2] projected a 3 to 4 fold increase in the extent of urban land use in southern US states. This population growth in southern urban and suburban areas has resulted in increased home construction and the concomitant installation and establishment of landscaping in the form of turfgrass sod often with in-ground irrigation systems. The total area of irrigated lawns and landscapes in Texas is estimated at 6509 km2 [3]. In Bryan/College Station, south central Texas, irrigated landscapes are typically between 464 and 929 m2 (BCS Realtors, College Station, TX). While turfgrass is posited the largest single irrigated crop in the USA [4], few studies have examined dissolved organic carbon (DOC) or dissolved organic nitrogen (DON) exports from this type of land cover. Of those studies that have examined DOC, the effect of biosolid amended turfgrass on runoff concentrations rather than exports was the primary emphasis of research [5-7]. The importance of research on DOC and DON exports in urban ecosystems is that it quantifies the loss of terrestrial organic C and N to surface waters. While these losses typically represent a small fraction of the terrestrial soil organic carbon and nitrogen pools, losses of terrestrially derived DOC affects the solubility and mobility of metals [8,9] and the adsorption of pesticides to soils [10] both of which are likely to be high in urban ecosystems. Furthermore, both DOC and DON have been implicated in the formation of disinfectant byproducts when surface water is disinfected for drinking water supply [11-12].
Water consumption for the purposes of landscape irrigation increased dramatically during summer months in a city in southern USA [13]. In a study examining monthly water use of more than 900 single-family homes in Texas between 2000 and 2004, White et al. [13] reported that household water use more than doubled during the months of May, July, September and October and tripled during the month of August with the increased use likely in the form of irrigation. Observations by the authors suggested that much of the applied irrigation water runs off site in most sub-divisions.
Urban landscapes are typically irrigated with municipal tap water which originates from surface water (rivers, lakes, reservoirs), groundwater and, blends of these sources. Hence, the quality or chemistry of irrigation water varies across the nation. High Na+ concentrations in irrigation water has been linked to the release of DOC and DON from vegetation and soil at the laboratory, microcosm and small plot scale [14-17]. Pannkuk et al. [15] examined DOC and DON in leachate water under single and mixed urban landscape species at a small plot scale using irrigation water from two different municipal sources. They concluded that irrigation water chemistry had a greater effect on DOC and DON concentrations in leachate than landscape species. Steele and Aitkenhead-Peterson [17] examined the effect of saline and sodic irrigation waters on DOC and DON release from senescent urban vegetation and reported that irrigation water sodicity was more important for C and N leaching from senescent vegetation than irrigation water salinity. Holgate et al. [14] reported that the chemistry of irrigation water had a significant effect on soil microbial community composition which may in turn impact nutrient cycling.
The major objectives of this study were 1) to examine the effect of fertilization and timing of sod installation on DOC and DON exports and 2) to investigate if irrigation-induced DOC and DON fluxes are related to Na+ inputs.
Site description
The experiment was conducted at the Texas A&M University urban ecology runoff facility in College Station, Texas. The facility consists of twenty-four (4.12 m x 8.23 m) plots constructed on prior pasture land with an average 3.7% slope [18]. Soil beneath the installed turfgrass sod was an undisturbed Boonville Series (fine, smectitic, thermic Chromic Vertic Albaqualf) and a Zack series (fine smectic, thermic Udertic Paleustalf). Topsoil of both soil series is fine sandy loam underlain by massive marine clay which presents a relatively impermeable barrier for loss of soil solution to leachate. The depth of top soil to the clay ranged from 0.31 ± 0.04 to 0.43 ± 0.07 m [18]. Climate in the region is sub-tropical with a mean annual temperature of 20°C and an annual average precipitation of 1,000 mm.
Two experiments were conducted; the first, from 8 Aug to 4 Sept 2012 (August study) and the second, 12 Sept to 11 Oct 2012 (September study). For each experiment, St. Augustine grass (Stenotaphrum secundatum (Walt.) Kuntze ‘Raleigh’) sod was installed onto twelve 34 m2 plots, arranged in a randomized complete block design, with 3 replicates for each fertilizer treatment. One of four fertilizer treatments were randomly assigned to each of three replicate plots: 1) fast release urea applied six days after sod installed (U6), 2) slow release sulfur coated urea applied six days after sod installed (SCU6), 3) fast release urea applied 19 days after sod installed (U19), and an unfertilized control (UF). Fertilizer was applied at a rate of 4.9 g N m-2 for each factor level using a standard drop spreader.
Irrigation events
Plots were irrigated daily at a rate of 60% of historical ETo (FAO Penman-Monteith) which is a commonly recommended irrigation practice for warm season turfgrass lawns because the crop coefficient for C4 turfgrass is 0.6 x reference evapotranspiration [19,20]. Small volume and frequent irrigation was used to prevent runoff. Once, each week, runoff was forced by irrigating at an average precipitation rate of 37.6 mm hr-1 for a 20 min period delivering an average of 12.53 mm per irrigation event. Each plot had its own totalizing water meter to record the volume of irrigation water used. The volume of water applied to force runoff differed with turfgrass installation date (p = 0.04) and averaged 685 ± 12 L and 715 ± 19 L per event for the August and September studies respectively (Table 1).
| Treatment | Irrigation-Induced | Rain-Induced | |||||
|---|---|---|---|---|---|---|---|
| Input | Runoff | Runoff | Input | Runoff | Runoff | ||
| L | L | % | L | L | % | ||
| August | UF | 685.2 (28.4) |
212.6 (84.3) |
30.9 (11.7) |
864 | 550 (113) |
63.7 (13) |
| U6 | 700.0 (45.0) |
177.8 (72.7) |
25.3 (9.7) |
864 | 371 (321) |
42.9 (37) |
|
| SCU6 | 682.3 (68.4) |
126.8 (69.6) |
19.2 (11.1) |
864 | 180 (312) |
20.9 (36) |
|
| U19 | 670.7 (67.6) |
251.7 (97.1) |
37.7 (15.2) |
864 | 633 (142) |
73.3 (16) |
|
| September | UF | 714.2 (32.9) |
189.2 (81.7) |
26.7 (12.0) |
2320 | 1188 (117) |
51.2 (5) |
| U6 | 705.9 (37.0) |
202.2 (77.2) |
30.2 (9.9) |
2320 | 1538 (370) |
66.3 (16) |
|
| SCU6 | 697.6 (50.7) |
181.1 (102.7) |
26.2 (16.1) |
2320 | 1144 (251) |
49.3 (11) |
|
| U19 | 742.1 (46.4) |
219.6 (105.8) |
29.2 (13.7) |
2320 | 1437 (320) |
61.9 (14) |
|
Rainfall in August was 25.5 mm and in September 68.3 mm. UF = unfertilized, U6 = fast-release urea fertilizer applied 6 days after sod installed, SCU6 = slow-release sulfur coated urea applied 6 d after sod installed and U19 = fast-release urea fertilizer applied 19 days after sod installed
Table 1: Irrigation input and runoff volumes for the two turfgrass establishment months. Values in parenthesis are standard deviation (n=3). Irrigation was applied to a depth of 16.5 mm to each plot to induce runoff.
Each plot was equipped with a 1.2 m long H flume, an Isco model 4230 Bubbler Flow Meter, and an Isco model 6712 Portable Sampler (Teledyne Isco, Lincoln, NE 68504). Flow rates (L sec-1) were recorded at 2 min intervals. Irrigation-induced runoff volumes did not differ significantly (p = 0.74) with sod installation month and averaged 192 ± 53 L and 198 ± 17 L for August and September, respectively (Table 1). The percentage of irrigation water applied and lost to runoff during the weekly irrigation-induced runoff events averaged 28 ± 8% and 28 ± 2% for the August and September studies respectively (Table 1). In addition to the irrigation-induced runoff events (4 in August and 5 in September), one natural rainfall event occurred during each study. The August installation received 25.41 mm of rain three weeks into the study contributing 864 L to each plot. At four weeks into the September study, 68.3 mm of rain fell contributing 2,320 L to each plot (Table 1). The chemistries of municipal tap water used for irrigation and rain water and thus chemical inputs to the plots were quite different (Table 2).
| pH | EC | Na+ | K+ | Mg2+ | Ca2+ | |
|---|---|---|---|---|---|---|
| µS cm-1 | mg L-1 | |||||
| Municipal Water | 8.4 ± 0.1 | 648 ± 35 | 206 ± 25 | 3 ± 3 | 0.4 ± 0.1 | 3.0 ± 0.1 |
| Rain Water | 6.7 ± 0.3 | 37 ± 29 | 6 ± 5 | 1 ± 1 | 0.2 ± 0.2 | 0.8 ± 0.6 |
Table 2: Chemistry of municipal tap water and rain water input irrigation to the newly installed turfgrass plots.
Chemical analysis
DOC and total dissolved nitrogen (TDN) were measured using high temperature Pt-catalyzed combustion with a Shimadzu TOC-VCSH and Shimadzu total measuring unit TNM-1 (Shimadzu Corp., Houston, TX, USA). DOC was measured as non-purgeable carbon which entails acidifying the sample (250 mL 2M HCl) and sparging for 4 min with C-free air.
Ammonium-N was analyzed using the phenate hypochlorite method with sodium nitroprusside enhancement and nitrate-N was analyzed using Cd–Cu reduction. Orthophosphate-P was quantified using the ascorbic acid, molybdate blue method. All colorimetric methods were performed with a Westco Scientific Smartchem Discrete Analyzer (Westco Scientific Instruments Inc., Brookfield, CT, USA). Ca2+, Mg2+, K+ and Na+ were quantified by ion chromatography using an Ionpac CS12A analytical and Ionpac CG12A guard column for separation and 20 mM methanosulfonic acid as eluent at a flow rate of 1 mL min-1 and injection volume of 25 mL (DIONEX ICS 1000). DON was estimated as TDN – (NH4-N + NO3-N). NIST traceable and control standards plus replicate samples were run every 10th sample on all analyses.
Statistical analysis
Mean DOC and DON concentrations were calculated for each plot and runoff date and then averaged by fertilizer treatment. A time series of DOC and DON concentrations was constructed to illustrate the increases of DOC and DON over time for each fertilizer treatment and study.
Mean DOC and DON fluxes were calculated for a) irrigation-induced and b) rain-induced runoff for each plot (August: n=4 irrigation; n = 1 rain and September: n = 5 irrigation; n = 1 rain) (Equation 1).
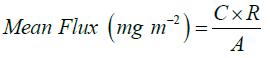
Where C = concentration (mg L-1), R = total runoff volume (L) and A = plot area (m2)
The DOC and DON flux (mg m-2) for each plot was then averaged by treatment (n=3). A univariate analysis of variance with fertilization as a fixed factor and month of sod installation as a random factor was used to test if there was fertilization, month of sod installation, or interaction of sod fertilization and month on DOC and DON fluxes.
Total DOC and DON exports (kg km-2) for the individual August and September studies were calculated by summing runoff event DOC and DON flux (municipal irrigation - plus rain-induced fluxes) for each plot and then averaging by treatment (n=3 plots). A one-way analysis of variance (ANOVA) was performed on the DOC and DON export data with fertilizer treatment as the dependent variable to test the hypothesis that fertilization had a significant effect on DOC and DON exports.
To examine the potential effect that pH, electrical conductivity and cations might have on DOC and DON fluxes, ammonium-N, Na+, K+, Mg2+ and Ca2+ fluxes along with pH and EC were used in backward stepwise multiple regression analyses to determine the best model for estimating DOC and DON fluxes. Eighty percent of the available data (August: n = 38, September: n = 48) was used to construct predictive models and 20% of the data used as a test set to test the predictive models (August: n = 9, September: n = 12).
All statistical analyses were completed with SPSS v.22 (IBM Corp., Armonk, NY, USA).
DOC and DON concentrations in runoff
DOC concentrations in the August installation runoff events ranged from 20.5 to 27.3 mg L-1 in and 25.3 to 30.9 mg L-1 in September for the first runoff event. Rain events midway through each study diluted the concentrations somewhat but by the last runoff event DOC concentrations in runoff had significantly increased three- to four-fold to 72.0 to 78.1 mg L-1 in the August study (p < 0.0001) and to 106.7 to 120.3 mg L-1 in the September study (p < 0.0001) (Figure 1A and B). DON concentrations did not show a similar pattern to DOC concentrations for all fertilizer treatments and appeared instead to be affected by fertilizer type and timing (data not shown). DON concentrations in the first runoff event ranged from 1.1 to 1.6 mg L-1 in the August study and from 1.5 to 1.9 mg L-1 in the September study. The rain events diluted DON concentrations in the August study but increased DON concentrations in the September study. During the last runoff event DON concentrations in the August study ranged from 2.6 to 5.0 mg L-1 and in the September study ranged from 1.4 to 1.6 mg L-1.

UF = unfertilized, U6 = Urea applied 6 days after turf installed, SCU6 = sulfur-coated urea installed 6 days after turf installed and U19 = Urea applied 19 days after turf installed.
Figure 1: Time series of DOC concentrations for A) August study and B) September study.
Average irrigation- and rain-induced fluxes of DOC and DON
Average irrigation-induced fluxes of DOC ranged from 185 ± 74 (SCU6) to 401 ± 173 mg m-2 (U19) and from 306 ± 31 (UF) to 401 ± 82 mg m-2 (U19) for the August and September studies, respectively (Table 3). Fertilization (p = 0.24) or month of sod installation (p = 0.15) had no significant effect on irrigation-induced DOC fluxes. Average rain-induced DOC fluxes ranged from 734 ± 203 (UF) to 912 ± 135 mg m-2 (U19) for the August study and 1775 ± 185 (UF) to 2689 ± 958 mg m-2 (U6) for the September study (Table 3). Fertilization had no significant effect on rain-induced DOC fluxes but month of sod installation did (p < 0.05).
| Irrigated with Municipal Tap Water | |||||||||
|---|---|---|---|---|---|---|---|---|---|
| UF | U6 | SCU6 | U19 | ||||||
| Aug | Sep | Aug | Sep | Aug | Sep | Aug | Sep | ||
| pH | 8.6 ± 0.1 | 8.6 ± 0.0 | 8.6 ± 0.1 | 8.6 ± 0.0 | 8.5 ± 0.0 | 8.6 ± 0.0 | 8.6 ± 0.0 | 8.7 ± 0.0 | |
| EC (µS cm-1) | 1416 ± 42 | 1265 ± 5 | 1437 ± 167 | 1262 ± 9 | 1466 ± 84 | 1278 ± 18 | 1473 ± 111 | 1308 ± 35 | |
| DOC (mg m-2) | 320 ± 149 | 306 ± 31 | 280 ± 54 | 364 ± 36 | 185 ± 74 | 307 ± 78 | 401 ± 173 | 401 ± 82 | |
| DON (mg m-2) | 16 ± 8 | 9 ± 1 | 18 ± 5 | 11 ± 3 | 14 ± 7 | 10 ± 2 | 22 ± 10 | 15 ± 5 | |
| Na+ (mg m-2) | 1726 ± 686 | 1293 ± 218 | 1589 ± 168 | 1430 ± 137 | 1007 ± 414 | 1332 ± 353 | 2077 ± 749 | 1581 ± 395 | |
| K+ (mg m-2) | 71 ± 33 | 48 ± 7 | 61 ± 8 | 57 ± 9 | 76 ± 36 | 79 ± 23 | 85 ± 22 | 78 ± 16 | |
| Mg2+ (mg m-2) | 20 ± 10 | 15 ± 2 | 18 ± 3 | 18 ± 2 | 14 ± 6 | 16 ± 4 | 25 ± 12 | 19 ± 4 | |
| Ca2+ (mg m-2) | 85 ± 45 | 61 ± 5 | 75 ± 8 | 72 ± 8 | 57 ± 26 | 64 ± 16 | 107 ± 53 | 75 ± 18 | |
| Irrigated with Rain Water | |||||||||
| UF | U6 | SCU6 | U19 | ||||||
| Aug | Sep | Aug | Sep | Aug | Sep | Aug | Sep | ||
| pH | 8.0 ± 0.1 | 8.0 ± 0.0 | 8.0 ± 0.1 | 8.0 ± 0.1 | 7.8 ± 0.0 | 7.8 ± 0.0 | 7.9 ± 0.0 | 8.0 ± 0.1 | |
| EC (µS cm-1) | 562 ± 77 | 595 ± 19 | 575 ± 46 | 544 ± 46 | 606 ± 0 | 500 ± 48 | 595 ± 19 | 570 ± 12 | |
| DOC (mg m-2) | 734 ± 203 | 1775 ± 185 | 831 ± 102 | 2689 ± 958 | 813 ± 0 | 1834 ± 603 | 912 ± 135 | 2261 ± 790 | |
| DON (mg m-2) | 30 ± 10 | 90 ± 13 | 31 ± 0 | 132 ± 50 | 43 ± 0 | 91 ± 32 | 35 ± 4 | 116 ± 35 | |
| Na+ (mg m-2) | 2100 ± 694 | 3804 ± 378 | 2018 ± 35 | 5048 ± 1527 | 2053 ± 0 | 3390 ± 901 | 2514 ± 609 | 4704 ± 1234 | |
| K+ (mg m-2) | 145 ± 58 | 228 ± 56 | 122 ± 2 | 268 ± 98 | 208 ± 0 | 231 ± 60 | 172 ± 30 | 286 ± 50 | |
| Mg2+ (mg m-2) | 29 ± 17 | 49 ± 5 | 28 ± 2 | 69 ± 22 | 27 ± 0 | 45 ± 13 | 35 ± 12 | 61 ± 13 | |
| Ca2+ (mg m-2) | 118 ± 76 | 211 ± 25 | 116 ± 3 | 305 ± 121 | 113 ± 0 | 199 ± 60 | 143 ± 48 | 270 ± 54 | |
± = standard deviation. Treatments are UF = Unfertilized, U6 = Fast-release urea applied 6 days after sod installed, SCU6 = Sulfur-coated urea applied 6 days after sod installed and U19 = Fast release urea applied 19 days after sod installed.
Table 3: Average pH, electrical conductivity (EC) and fluxes (mg m-2) of DOC, DON, and cations from municipal tap water irrigation-induced and rain-induced runoff during August and September sod establishment.
Average irrigation-induced fluxes of DON ranged from 14 ± 7 (SCU6) to 22 ± 10 mg m-2 (U19) and from 9 ± 1 (UF) to 15 ± 5 mg m-2 (U19) for the August and September studies respectively (Table 3). DON fluxes were significantly affected by fertilizer type (p = 0.02) and month of sod establishment (p = 0.005). Average rain-induced fluxes of DON ranged from 30 ± 10 (UF) to 43 ± 0 (SCU6) mg m-2 in the August and from 90 ± 13 (UF) to 132±50 (U6) mg m-2 in the September studies (Table 3).
Average irrigation- and rain-induced fluxes of base cations
August Na+ flux in runoff induced by municipal tap water irrigation ranged from 1007 ± 414 mg m-2 (SCU6) to 2077 ± 749 mg m-2 (U19). K+ ranged from 61 ± 8 mg m-2 (U6) to 85 ± 22 mg m-2 (U19). Ca2+ ranged from 57 ± 26 mg m-2 (U6) to 107 ± 53 mg m-2 (U19) and Mg2+ from 14 ± 6 mg m-2 (SCU6) to 25 ± 12 mg m-2 (U19) (Table 3). Fluxes of base cations were higher with rain induced runoff; Na+ ranged from 2018 ± 35 mg m-2 (U6) to 2514 ± 609 mg m-2 (U19) and K+ from 122 ± 2 mg m-2 (U6) to 208 ± 0 mg m-2 (SCU6). August fluxes for Ca2+ ranged from 113 ± 0 mg m-2 (SCU6) to 143 ± 48 mg m-2 (U19) and Mg2+ from 27 ± 0 mg m-2 (SCU6) to 35 ± 12 mg m-2 (U19) (Table 3).
For the September installation flux in runoff induced by municipal tap water irrigation Na+ ranged from 1293 ± 218 mg m-2 (UF) to 1581 ± 395 mg m-2 (U19). K+ ranged from 48 ± 7 mg m-2 (UF) to 79 ± 23 mg m-2 (SCU6). Ca2+ ranged from 61 ± 5 mg m-2 (UF) to 75 ± 18 mg m-2 (U19) and Mg2+ from 15 ± 2 mg m-2 (UF) to 19 ± 4 mg m-2 (U19) (Table 3). Fluxes of base cations were also higher in the September installation with rain induced runoff; Na+ ranged from 3309 ± 901 mg m-2 (SCU6) to 5048 ± 1527 mg m-2 (U6) and K+ from 231 ± 60 mg m-2 (SCU6) to 286 ± 50 mg m-2 (U19). September fluxes for Ca2+ ranged from 199 ± 60 mg m-2 (SCU6) to 305 ± 121 mg m-2 (U6) and Mg2+ from 45 ± 13 mg m-2 (SCU6) to 69 ± 22 mg m-2 (U6) (Table 3).
Total exports of DOC and DON
One extra irrigation runoff event and a large rain event occurred in the September study which increased total DOC and DON exports (irrigation plus rain induced runoff) relative to the August study. Total DOC exports were 2036 ± 803 kg km-2 in August and 3341 ± 227 kg km-2 in September for the unfertilized plots (Figure 2A). Highest DOC export was from the U6 treatment in September (4556 ± 1142 kg km-2) and lowest DOC export was from the SCU6 treatment in August (1023 ± 735 kg km-2). Fertilization had no significant effect on total DOC exports (p = 0.29).

UF = unfertilized, U6 = Urea applied 6 days after turf installed, SCU6 = sulfur-coated urea installed 6 days after turf installed and U19 = Urea applied 19 days after turf installed.
Figure 2: DOC and DON exports from newly installed turfgrass plots. The August and September studies ran for one month each. Exports are the result of 4 irrigation and 1 rain event in August and 5 irrigation and 1 rain event in September. Error bars are standard deviation and show the variance among plots for each fertilizer treatment (n=3).
DON exports were 99 ± 43 kg km-2 in August and 134 ± 15 kg km-2 in September for the unfertilized plots (Figure 2B). Highest DON export was from U19 in September (195 ± 59 kg km-2) and lowest DON export was from SCU6 in August (73 ± 55 kg km-2). Fertilization had no significant effect on total DON exports (p =0.18) (Figure 2).
Models of DOC and DON fluxes from newly installed turfgrass sod
Individual models were produced for the estimation of DOC and DON fluxes from turfgrass for the two sod installation dates. Ammonium-N, Na+ and Ca2+ were important for the estimation of DOC flux in August (R2 = 0.88; p < 0.001) and Na+ and Mg2+ important for its estimation in September (R2 = 0.56; p < 0.001). For DON, Ammonium-N, Na+, K+ and Ca2+ in August (R2 = 0.86; p < 0.001) and ammonium-N, Na+ and Mg2+ in September (R2 = 0.79; p < 0.001) best estimated DON fluxes (Table 4) Examination of observed vs. estimated DOC fluxes showed that for a the August test group, DOC was estimated extremely well (R2 = 0.88; p < 0.001) but the September test group was not (R2 = 0.69; p < 0.001) due to an over-estimation of lower DOC fluxes (< 400 mg m-2) (Figure 3A). For DON fluxes, the August test group showed some scatter due to under and over-estimations (R2 = 0.40 p < 0.05) but for the September test group DON was estimated well (R2 = 0.85; p < 0.001) (Figure 3B).
| Constant | NH4-N | Na+ | K+ | Mg2+ | Ca2+ | R2 | SEE | F | Significance | |
|---|---|---|---|---|---|---|---|---|---|---|
| August | ||||||||||
| DOC | -37.936 (24.595) |
0.923 (2.145) |
0.314 (0.023) |
- | - | -2.049 (0.298) |
0.88 | 67.07 | 81.26 | <0.001 |
| DON | -0.75 (1.81) |
1.867 (0.42) |
0.016 (0.002) |
-0.99 (0.058) |
- | -0.058 (0.033) |
0.86 | 5.40 | 55.54 | <0.001 |
| September | ||||||||||
| DOC | 6.133 (64.18) |
- | 0.511 (0.085) |
- | -23.22 (7.08) |
- | 0.56 | 178.43 | 28.27 | <0.001 |
| DON | 2.016 (1.43) |
0.174 (0.20) |
0.13 (0.002) |
- | -0.58 (0.18) |
- | 0.79 | 3.86 | 46.42 | <0.001 |
Table 4: Constants, coefficients and standard error derived from backward stepwise multiple regression analysis for the estimation of test set DOC and DON fluxes in irrigation-induced runoff from St. Augustine turfgrass established in August and September. Data were pooled across each fertilizer level (n=3 per treatment within each sod establishment month). There were 4 irrigation events for the August installation and 5 irrigation events for the September installation. SEE is standard error of the estimate. Values in parenthesis are standard error.

Figure 3: Observed and predicted irrigation exports of A) DOC and B) DON for a test set of 20% samples (August n = 9; September n = 12) based on the predictive models generated using the coefficients in Table 4 for August (white circles) and September (black circles) studies.
Population growth in southern cities of the USA is increasing [1] and with this increase comes the need for new construction of homes, schools, hospitals and commercial enterprises all of which have green space, typically in the form of turfgrass. Turfgrass sod is the preferred means of establishing lawns because a lawn can be established quickly thus avoiding soil erosion. Ephemeral or intermittent streams are common in urban areas of southern sub-tropical states and would typically only flow during a rain event, however with landscape irrigation, many of these flow during the summer months fed by mainly turfgrass runoff. As landscape runoff meets an impervious surface such as a road of parking lot it is quickly lost to storm drains to enter the nearest stream channel.
In rural and urban surface waters in south-central Texas DOC and DON concentrations ranged from 20.4 to 52.5 mg C L-1 and 0.6 to 1.9 mg N L-1 [21] and were similar to the concentrations found in the irrigation induced runoff of this study (DOC: 20-31 mg L-1; DON: 1.1- 1.9 mg L-1). An ephemeral stream draining a golf course in Michigan reported annual average dissolved organic matter (DOM) at 21.6 mg L-1[22]. Other studies of DOC in urban surface waters have reported lower DOC concentrations; for example a study of an urban and forested stream in Florida reported mean annual urban surface water DOC concentrations of 13 mg L-1 compared to forest surface water concentrations of 26 mg L-1 [23]. Research by Beasley [24] examined soil pore water DOC in newly created urban soil in Scotland, UK and reported similar DOC concentrations (range: 10 to 100 mg L-1) at 15 cm depth as found in our study. Their soils maintained high DOC concentrations (approximately 50 mg L-1) for the two years of their study [24].
Effect of Na+ on DOC and DON fluxes
Strong and significant relationships between aquatic or soil DOC and DON concentrations and Na+ or the sodium adsorption ratio (SAR) have been reported [14,16,17,21]. However these previous studies did not fully account for the mechanisms that might be responsible for causing DOC and DON release to solution. The relationship between soil DOC and DON losses and Na+ has been researched at the laboratory scale in several past studies. For example, Fettig and Sontheimer [25] suggested that Na+ exchange with Ca2+ on soil exchange sites effectively solubilizes soil organic matter fixed in calcium complexes. Na+ was also shown to effectively initiate the disaggregation of immobile aggregates into mobile colloids [26]. These readily soluble organic salts have no ability to form inter- or intra-molecular bridges [25]. Furthermore, Na+ has the ability to remove divalent bridges between clay mineral surfaces and organic anions [27]. More recently, while examining the potential reasons for increased DOC in surface waters in Canada, Kerr and Elmers [28] reported that declining Ca2+ in soil solution resulted in equilibrium DOC increasing, indicative that changes in DOC adsorption on exchange sites may be caused by cation bridging or the lack thereof. A recent study in California examined the use of wastewater effluent as an alternative irrigation water source for urban landscapes and concluded that pH, SAR and DOC of wastewater was high enough to reduce soil infiltration rate and aggregate stability in soils [29] Thus, based on this prior research on the interaction between Na+ and organic matter and the results from our study, we suggest that the major mechanism of DOC and DON release from urban landscapes irrigated with high Na+ municipal water is likely to be a combination of Na+ exchange with cations on soil exchange sites, followed by calcium- DOC decomplexation and a consequential displacement of adsorbed organic DOC and DON from soil exchange sites to pore water. The reduction in a soils infiltration rate, caused in part by lower aggregate stability and high clay dispersion will result in greater runoff from urban landscapes.
Examination of the use of cations to estimate DOC and DON fluxes from turfgrass we found that Na+ flux was an important ion in all of our models as it was strongly and significantly positively correlated to DOC and DON in the August study (DOC: R = 0.84; DON: R = 0.72) and moderately but significantly in the September study (DOC: R = 0.67; DON R = 0.66). We believe that the positive correlations between DOC with other cations (NH4 +, K+. Mg2+ and Ca2+) is a result of their loss from soil exchange sites due to their replacement by Na+.
Municipal water and alternative water for irrigating landscapes
As the scarcity of potable water available for irrigation of urban landscapes increases in southern US states due to higher demand and climate change, municipalities will have to utilize reclaimed water such as treated sewage effluent to irrigate landscapes [30]. Na+ concentrations in effluent can be almost six-times higher than in the municipal water supplied for potable use [31]. In a study comparing the effect of different irrigation water chemistries on vegetables, the Na+ concentration in potable water was 25 mg L-1 while in sewage effluent it was 143 mg L-1 [31]. Devitt et al. [32] used recycled sewage effluent for turfgrass irrigation in Las Vegas, USA and reported that of the Na+, Ca2+ and Mg2+ applied in irrigation water,70% Na+ and 200% Mg2+ was leached from a sandy-loam soil and 35% Na+, 50% Mg2+ and >100% Ca2+ was leached from a loamy-sand soil. Our base cation imports and exports displayed a similar pattern with Na+ highly retained during irrigation compared to other cations (Table 5). Of the K+, Mg2+ and Ca2+ added in irrigation water release of these ions was 48, 35 and 31% respectively whereas 91% of Na+ added in irrigation water was retained and only 9% released (Table 5). The story was very different during rain events when most of the cations retained during irrigation events were lost to runoff (Table 5). This study used ground-water sourced municipal water for turfgrass irrigation. While not every city will have municipal water so high in Na+, we felt the study illustrated the losses of organic C and N from turfgrass and its underlying soil should an alternative water source high in Na+ was used.
| Import | Export | Retained | Released | |
|---|---|---|---|---|
| mg m-2 | % | |||
| Irrigation | ||||
| Na+ | 69,676 | 6,585 | 91 | 9 |
| K+ | 640 | 306 | 52 | 48 |
| Mg2+ | 231 | 80 | 65 | 35 |
| Ca2+ | 1,055 | 327 | 69 | 31 |
| Rain | ||||
| Na+ | 197 | 3,204 | - | 1,626 |
| K+ | 14 | 208 | - | 1,537 |
| Mg2+ | 5 | 43 | - | 858 |
| Ca2+ | 20 | 184 | - | 922 |
Table 5: Average imported and exported cations from irrigation and rain events across all treatments and sod establishment periods.
Expansion of exurban landscapes
Exurban landscapes are expanding in the USA [33]. Theobald [33] states that the developed footprint has increased at roughly 1.6% per year between 1980 and 2000 with expectations of an increase of 14.3% by 2020. At a local scale, permits for new single-family home builds in Bryan College Station totaled 12,345 between 2000 and 2014 (http://www.city-data.com/city/College-Station-Texas.html and http://www.city-data.com/city/Bryan-Texas.html) and with an average lot size of 700 m2 we can extrapolate from our study losses of 196-255 g m-2 DOC and 7.7-12.6 g m-2 DON from each individual lot during the month after late summer-early fall sod installation if recommended irrigation practices of 60% ETo and fertilization 6 days after sod installation are met. While there are benefits of irrigated landscapes, a more practical approach would be to use best management practices such as deficit irrigation [34] and cycle irrigation to limit both soil Na+ accumulation and overall runoff volumes [35]. To counteract the high Na+ in our irrigation water we now apply gypsum annually at a rate of 8.3 kg for each 34 m2 plot.
• Installation and irrigation of turfgrass sod with high Na+ municipal tap water promoted significantly higher DOC concentrations in runoff over time.
• Replacement of soil cations by Na+ on soil exchange sites in irrigated lawns might be in part responsible for increasing DOC concentrations and fluxes in urban surface waters.
• DOC fluxes during irrigation events were not significantly affected by fertilizer type or installation month.
• DON fluxes during irrigation events were significantly affected by fertilizer type and installation month.
The construction of the 24 fully instrumented runoff plots was a joint project between Texas A&M AgriLife Research and Scotts Miracle Gro’ Company. This is a publication of Texas AgriLife Research Hatch Project TEX09194 (Aitkenhead- Peterson). We thank Nina Stanley for analyses of runoff samples and graduate student Laura Kolb and undergraduate student Gretta Sharp for their help in the collection and processing of samples.