Journal of Stock & Forex Trading
Open Access
ISSN: 2168-9458
ISSN: 2168-9458
Review Article - (2018) Volume 6, Issue 1
In FY 2014-15, the buffalo population was 14.64 lakh that means 3 per cent of the total ruminants, but its’ socioeconomic importance is remarkable. So, the present study was attempted to identify the socioeconomic profile of the buffalo keeping farmers and to estimate the income from buffalo farming. To achieve the objectives 10 (ten) districts namely: Mymensingh, Jamalpur, Moulovibazar, Bhola, Potuakhali, Noakhali, Laxmipur, Chittagong, Tangail and Sirajgong were selected purposively on the basis of buffalo population and project implementation areas and 01 (one) Upazila was taken from each district. A total of 500 (50 from each district) buffalo farmers were interviewed following simple random sampling technique. Data were collected during the month of January 2016 to April 2016 and analyzed using SPSS and STATA software tools. In this study, ‘Logit model’ was adopted using binary dependent variable. Study revealed that the highest per cent of farmers were in age group 31-45 years and engaged in agriculture as primary occupation. The highest number of farmers had primary level education and had above 15 years of experience of rearing buffalo. Average farm size was calculated 1.05 hectare, average family size was 6.17 persons per family and dependency ratio was also estimated 1.05. Per lactation total cost was estimated BDT 24,507, lactation period was 255 days and average milk production per day was 2 liters. The highest return from milk production was BDT 27,189 and the BCR was 1.31 (undiscounted). It was found that about 64 per cent farmers had access to artificial insemination (AI) and seventy per cent farmers vaccinated their buffaloes where 66 per cent FMD, 24 per cent BQ and 20 HS. Ninety eight per cent farmers feed colostrum to the new born buffalo calves and almost 90 per cent farmers had done D-warming. Buffalo population was found highest in Ramgoti and lowest in Haluaghat and on average per farm buffalo number was 18.91. The highest (33%) family income was derived from buffalo rearing followed by service, business, farming and livestock (except buffalo). The value of coefficient of Binary Logistic Regression Model showed that most of the prediction was justified and statistically significant and buffalo development program was helpful and necessity for the buffalo farmers. *
<Keywords: Buffalo; Income; Cost; Return and variable
The agrarian economy of Bangladesh is primarily depending on production of crop, livestock and fisheries. The livestock sub-sector contributes 1.78% to the GDP, contributes 16.71% to the agricultural GDP, generates 20% of country’s employment directly and 40% indirectly, contributes 4.31% to country’s total export earning, provides 25% of households energy supply, produces 125 MMT of organic manure utilized for crop production. In financial year 2014-15, the livestock population is 539.72 lakh (ruminant) whereas the buffalo is 14.64 lakh [1,2]. Buffaloes hold strategic place in overall livestock economy of Bangladesh and serve three important purposes such as milk, meat and drought power supply [3]. Farmers prefer to use buffaloes for draught purpose because of larger body size than the native cattle, higher draught power ability, long working life and docile temperament. Ninety six percent of the world buffalo population is found in Asia, where only 0.6 percent buffaloes are found in the particular agroecological zones in Bangladesh [4,5]. In fact, buffaloes have a better capacity of converting coarse feed stuffs into quality milk and meat. Though they can utilize roughage in the same ability as the cattle, their ability to process and communicate forages appears to be associated with relief of protein deficiencies rather than to extract energy. Buffalo have significant contribution to GDP through production of meat, milk and skin representing about 27.0, 23.0 and 28.0%, respectively to the total production from livestock sector in Bangladesh. Buffalo is the ‘Black gold’ of Bangladesh next to cattle as a major source of draft power, milk, meat, hide and skin etc.
Indigenous buffaloes are three times heavier than cattle and produce two times more milk than cattle. Buffalo milk is popular and has a high nutritive value and is excellent for the preparation of dairy products. Buffalo milk is usually processed to curds and cheese. It contains higher solid fat and protein and urban dwellers relished it very much. The distribution of buffalo is conspicuous in the areas where animal husbandry is poorly developed and badly organized. However, the great adaptability of this species in areas where hardly enough subsistence to survive for stubble fields or marshy lands with sludge, reeds water weeds and grasses, mostly refused by cattle, the buffalo is capable of maintaining itself in good condition. The buffalo not only maintains itself but can also work and supply milk with poor diets. The farmers maintain buffaloes not for ignorance but they find that in the prevailing agricultural situation no other domestic animal will thrive like buffalo and will be so useful and economical. As the demand for buffalo meat and milk is increasing day after day, the number of buffalo population is also increasing simultaneously. In Bangladesh, a number of studies have been undertaken on the productive and reproductive performances of buffalo. But no study has yet been conducted on the socio-economic status of the buffalo rearing, costs involved in raising buffalo, socio-economic constraints they faced in rearing buffalo and resource they do have to rear buffalo, marketing of buffalo milk etc. So, the present study will be an attempt to examine the different socioeconomic factors related with buffalo production.
The overall objectives of the baseline study are to explore the current socio-economic status and livelihood conditions of target households within the studied areas in Bangladesh. Moreover, the specific objectives of the study are as follows:
• To identify the socioeconomic profile of the buffalo keeping farmers;
• To estimate the income from buffalo and its contribution to farm income; and
• To suggests policy implications arising from the findings.
The review of literature in any research is necessary as it provides a new dimension for reviewing the stock of knowledge and information relevant to the proposed research. This knowledge gives a guideline in furnishing the future problem and validating the existing findings. Although a very few researches related to present study have been carried out in our country, but numerous researches have been carried out in different parts of the world.
The study showed that about 66 percent of total milk production (24.2 million tonnes) is received from buffaloes in Sindhi. There is only one breed of buffalo in Sindh called “Kundhi”. It is raised in dairy colonies of urban and pre-urban and households in rural areas of Sindh. The average milk production in lactation is 2000 liters. Total costs of dairy farms were estimated as Rs. 264938/-, 1094658/- and 2791760/- for small, medium and large respectively. The net return of selected dairy farms were analyzed and found that average net return was Rs. 67134/-, 390482/- and 1346580/- received small, medium and large size farms respectively [6].
Rahman et al. carried out a research to identify the socioeconomic factors, constraints and profitability of buffalo rearing in some rural areas of Bangladesh. Agriculture was the main occupation of 86.50% of the buffalo farmers and it was the highest in Rajshahi (100%) and the lowest in Patuakhali (62.50%). On average, the highest (23.02%) level of literacy prevailed in Primary up to Class-V followed by Class-VIIX (22.01%), SSC-HSC (11.45%) and Graduation & above 93.90%) in the study areas. The study further showed that the average number of male buffalo, castrated buffalo, dry buffalo, pregnant buffalo, milking buffalo, shared-out male-calf and female-calf shared out were 1.02, 0.48, 0.71, 1.25, 1.08, 0.40, 0.83, 0.28 respectively. The milk yield/cow/ day was the highest (3.67 lit.) for Kushtia and the lowest (1.05 lit.) for Patuakhali, with an average of 2.46 lit. The total milk production/farm/ lactation was the highest (753.30 lit.) for Patuakhali and the lowest (124.88 lit.) for Moulvibazar, with an average of 317.52litres [7].
Sumesh and Singh carried out a study on the economic aspects of milk production in the Pampat district of Haryana, India. The study revealed that buffalo rearing was more profitable than crossbred and local cows to supplement the farm income [8].
Rahman et al. conducted a study on buffalo production of Bangladesh. The study revealed that cost of rearing buffalo per farm per annum was TK. 46774.31 and gross income per farm per annum was TK. 61343.42. The benefit cost ratio was 1.31, indicating that buffalo rearing was profitable in the study areas [5].
Sajjad et al. conducted a study on economics of economies of scale in buffalo milk production in district Di Khan. The objective of the study was to find out cost and net revenue from buffaloes milk production and to estimate return to scale in milk production. The results of Cobb-Douglas production function suggested that buffalo milk yield was more sensitive to change in herd size i.e., one percent increase in herd size creates approximately 0.65 percent increase in milk yield, other things being constant. The results of the model also suggested that increasing return to scale. This indicates that increase in milk is higher than the increase in inputs. It was concluded that buffalo farming in the study area was a profitable enterprise.
In the study indicated that buffaloes in Bangladesh are classified into 2 categories: (I) indigenous buffaloes found in the coastal areas and marshy land of the country, (ii) migrated buffaloes from India and Myanmar found in the sugarcane producing belt. A number of cross bred between swamp and river types found in the coastal areas. Most of the farmers were rural small holders who had traditionally integrated their livestock with crop production and buffaloes were raised mainly to provide draught power in crop production. In a semi intensive production system, buffaloes were kept mainly for specific purposes, i.e., either for draught or for milk production. The low productivity is due to the genetic character of the breed and also poor quality nutrition. It was suggested that productivity of these buffaloes mainly depends on genetic improvement, good ration, good management and also climatic condition of the area [9].
The study was conducted to investigate the socioeconomic status of the buffalo farmers and the management practices of buffaloes in Bagerhat district of Bangladesh. The investigation revealed that buffalo rearing was practiced by the middle (30-40 years) and old (>40 years) aged farmers than the young (10].
In a study to analyze the economic feasibility of water buffalo rearing under rough wet grassland conditions in Germany. The analysis was based mainly on data from one of Germany’s largest water buffalo herds, which was kept by the landscape preservation farm. To check a variety of cost-benefit constellations, conducted a Monte Carlo simulation. The overall total rearing costs per cow was 1039 €. The direct marketing yields per bull ranged from 3797 € to 5298 €. Reproductive performance, e.g., calf-to-calf interval, was found to have the highest impact on overall economic performance. The results suggest that water buffalo rearing in Germany has the potential to be economically feasible [11].
Senturk conducted a study on evaluation of decrease in buffalo production in Turkey from economic viewpoint. It was determined by the study that the number of buffaloes in Turkey was reduced by 93% between 1970 and 2010. Annual milk production of buffaloes which was 830 kg/head in 1970 changed to 1004 kg/head as of 2010 with an increase of 21%. Carcass production increase between 1970 and 2010 was calculated to be 56% for buffalo and 156% for cattle. Prices of buffalo meat became lower than cattle beef in market of animal products in Turkey and price of cattle beef was calculated to be $4848 per tonne in average between 1991 and 2010. Within the same period average annual buffalo milk price was calculated as $4484 per tonne. Buffalo milk producer price became higher than cow milk as of 2007 and in 2010 cow milk/buffalo milk parity was determined as 1/2 [12].
Nahar and Yasmin carried out a study on economic evaluation of buffalo production in some selected regions of Bangladesh. The objectives of the study were to determine the socioeconomic status of buffalo rearing farmers, to estimate the income from buffalo production, to determine production coefficients of buffalo rearing and to analyze the efficiency of resources used. Multiple regression model was estimated for buffalo rearing farmers. Estimated production function exhibited increasing returns to scale indicating that there is bright prospect to earn more through the use of more inputs in the production process. The study identified some major problems and recommended some valuable measures to take based on research [13].
The study was designed to compare costs of rearing and returns received from major dairy buffalo breeds (Nili-Ravi and Kundhi) in various agro-ecological zones of Pakistan. The study revealed that milk production of buffaloes of Nili-Ravi and Kundhi breeds were 2889 and 2375 liter per annum, respectively. Total costs of milk production of Nili-Ravi and Kundhi buffalo breeds were Rs. 96155 and Rs. 90604 per annum, respectively. Net income per liter from milk of Nili-Ravi and Kundhi breeds was Rs. 12 and Rs. 11, and benefit-cost ratios were 1.4 and 1.3, respectively. Econometric analysis of milk production in the country revealed that use of green fodder and concentrates contribute positively and significantly to milk production [14].
The purpose of this study was to analyze the socio-economic structure of water buffalo farming in the province of Muş, in Turkey. The stratified sampling method was used to calculate sample size of buffalo farms. A single budget analysis method was used to calculate production cost and profit for water buffaloes. Plant production constituted 37.85% of the gross production value, while animal production accounted for 62.15%. The biggest share in the gross production value derived from water buffalo farming (45.71%). Fixed and variable costs were 51.44% and 48.56% of the production cost (USD11691.06), respectively. The largest part of the variable cost was the feed cost (75.81%). The cost of per kilogram buffalo milk in the region was calculated as USD0.64. Consequently, it was important to ensure the continuation of breeding studies to increase milk yield, giving information to farmers about modern techniques, developing policies to increase the scale of the farms, and implementing regional and national policies to increase awareness of buffalo milk and milk products [15].
From the above studies it is clear that most of the studies are of production, reproduction, rearing & marketing of buffalo and buffalo products. Milking buffaloes are very important for our whole economy because from buffalo we get huge amount of meat and milk. The studies also indicate that buffalo rearing is a profitable business. This condition influences the researchers to undertake a research on economic evaluation of buffalo production in some selected areas of Bangladesh.
Methodology for study was as follows
As study areas 10 (ten) districts namely: Jamalpur, Tangail, Mymensingh, Laxmipur, Noakhali, Moulovibazar, Sirajgong, Potuakhali, Bhola and Chittagong were selected on the basis of density of buffalo population and project implementation areas. Then 01 (one) upazila was taken from each district.
Field survey method was followed to collect primary data. A total of 500 (50 from each district) buffalo farmers were interviewed following simple random sampling technique (Table 1).
| Sl. No. | Districts | Upazilas | Sample size |
|---|---|---|---|
| 1. | Mymensingh | Haluaghat | 50 |
| 2. | Jamalpur | Madarigong | 50 |
| 3. | Moulvi Bazar | Rajnagar | 50 |
| 4. | Bhola | Charfashan | 50 |
| 5. | Potuakhali | Galachipa | 50 |
| 6. | Noakhali | Hatia | 50 |
| 7. | Laxmipur | Ramgati | 50 |
| 8. | Chittagong | Swandip | 50 |
| 9. | Tangail | Shakhipur | 50 |
| 10. | Sirajgonj | Ullahpara | 50 |
| Total | 500 | ||
Table 1: Sample distribution in the study areas.
An interview schedule was prepared and then pre-tested in the field among some buffalo keepers before final data collection. After pre-testing, the interview schedule was finalized Secondary data and information was also collected as required by the study. During the month of September 2015 to December 2015 data were collected by the enumerators and cross check was done by the researcher [16].
Collected data were edited, processed, summarized and scrutinized carefully. Data were analyzed using Statistical Package for Social Sciences (SPSS) & STATA software tools. Beside quantitative survey, qualitative tools such as Focus Group Discussion (FGD) and KII (Key Informant Interview) were carried out to have better understanding on existing constraints, challenges and opportunities of buffalo keeping.
Analytical technique: Both tabular and statistical techniques were used to analyze the data.
A) Tabular technique: Tabular technique is a technique that is widely used to find out the crude association or difference between variables. Tabular analysis was used to find out simple statistical measures like average, percentage, ratios etc.
Profitability analysis: In this study, costs and returns analyses were done on total cost basis. The following equation was used to assess the profitability of the buffalo rearing farmers.
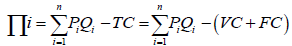
Where, Profit from ith buffalo production
Qi=Quantity of the ith buffalo product (kg/year)
Pi=Average price of ith buffalo product (BDT/kg)
TC=Total cost (BDT/year)
FC=Fixed cost (BDT/year)
i=1, 2, 3,........, n
B) Statistical technique: Variance and co-variance were measured to determine the relationship between family income from buffalo keeping and management system of buffalo. Furthermore, to find out the factors influencing the buffalo keepers to participate in buffalo development program, the following logistic regression analysis was adopted. In this proposed study, ‘logit model’ was estimated using binary dependent variable. The binary variable was assigned the value 1 under buffalo development project and zero (0) otherwise. The independent variables were age, education, family size, occupation, experience, farm size, number of buffalo, distance from AI centre, household income, artificial insemination facility and number of death buffalo in the last year etc. Logit model could be written as:
Y=a+ß1X1+ß2X2+ß3X3+ß4X4+ß5X+ß6X6+ß7X7+β8X8+β9X9+β10X10+β11X11
Where,
Y=Types of farmers (1=under buffalo development project and 0=otherwise)
X1=Age
X2=Education
X3=Family size
X4=Occupation dummy (1=farming, 0=otherwise),
X5=Experience
X6=Farm size
X7=Number of buffalo
X8=Distance of AI centres
X9=Household income
X10=Artificial insemination facility dummy (1=Yes, 0=No)
X11=Number of death buffalo
a=Intercept
ß=Coefficient
Socioeconomic profile of the buffalo farmer
Socioeconomic parameters such as age, education, occupation, experience of buffalo rearing, farm size, family size and dependency ratio were studied to know the sample farmers’ socioeconomic condition.
Age: The classified age groups were up to 30 years, 31-45 years, 46-60 and above 60 years. The highest per cent of farmers were in age group of 31-45 years indicating that farmers were mature for taking household decisions properly and timely and strong enough to give more labour to their farming activities followed by age group 46-60 years, up to 30 years, and above 60 years, respectively (Table 2).
| Areas | Age range (Years) | |||
|---|---|---|---|---|
| Up to 30 | 31 to 45 | 46 to 60 | Above 60 | |
| Haluaghat | 6 (12) | 20 (40) | 18 (36) | 6 (12) |
| Madarganj | 13 (26) | 21 (42) | 13 (26) | 3 (6) |
| Rajnagar | 4 (8) | 19 (38) | 19 (38) | 8 (16) |
| Charfasion | 7 (14) | 20 (40) | 18 (36) | 5 (10) |
| Golachipa | 10 (20) | 20 (40) | 16 (32) | 4 (8) |
| Hatiya | 10 (20) | 16 (32) | 21 (42) | 3 (6) |
| Ramgoti | 3 (6) | 27 (54) | 15 (30) | 5 (10) |
| Sandip | 7 (14) | 20 (40) | 20 (40) | 3 (6) |
| Sokhipur | 8 (16) | 17 (34) | 19 (38) | 6 (12) |
| Ullahpara | 6 (12) | 29 (58) | 13 (26) | 2 (4) |
| Average | 7.4 (15) | 21 (42) | 17 (34) | 4.5 (9) |
Source: Field survey 2016 and author’s calculation. (Value in the parenthesesindicate percentage).
Table 2: Farmers’ age.
Primary occupation: In the study areas, the buffalo farmers were engaged with various form of income generating activities viz. agriculture, business and service. On average, 85 per cent buffalo farmers were engaged purely on agriculture as primary occupation. Besides, 12 per cent of buffalo farmers had business and 3 per cent had service as primary occupation (Table 3).
| Areas | Occupation | ||
|---|---|---|---|
| Agriculture | Business | Service | |
| Haluaghat | 49 (98) | 1 (2) | - |
| Madarganj | 50 (100) | - | - |
| Rajnagar | 45 (90) | 2 (4) | 3 (6) |
| Charfasion | 35 (70) | 10 (20) | 5 (10) |
| Golachipa | 36 (72) | 12 (24) | 2 (4) |
| Hatiya | 36 (72) | 13 (26) | 1 (2) |
| Ramgoti | 31 (62) | 15 (30) | 4 (8) |
| Sandip | 47 (94) | 3 (6) | - |
| Sokhipur | 49 (98) | - | 1 (2) |
| Ullahpara | 47 (94) | 3 (6) | - |
| Average | 42.5 (85) | 6 (12) | 1.5 (3) |
Source: Field survey 2016 and author’s calculation. (Value in the parenthesesindicate percentage).
Table 3: Primary occupation.
Secondary occupation: Along with primary occupation, buffalo farmers had secondary occupation also. It was found from Table 3 that 46 per cent buffalo farmers had taken business as secondary occupation whereas 37 per cent agriculture and only 18 per cent service (Table 4).
| Areas | Occupation | ||
|---|---|---|---|
| Agriculture | Business | Service | |
| Haluaghat | 1 (2) | 3 (6) | 2 (4) |
| Madarganj | 1 (2) | 21 (42) | - |
| Rajnagar | 3 (6) | 9 (18) | 5 (10) |
| Charfasion | 11 (22) | 1 (2) | 5 (10) |
| Golachipa | 14 (28) | 17 (34) | 18 (36) |
| Hatiya | 13 (26) | 7 (14) | 2 (4) |
| Ramgoti | 19 (38) | 1 (2) | - |
| Sandip | 3 (6) | 12 (24) | - |
| Sokhipur | - | 11 (22) | - |
| Ullahpara | 1 (2) | - | - |
| Average | 18.5 (37) | 23 (46) | 9 (18) |
Source: Field survey 2016 and author’s calculation. (Value in the parentheses indicate percentage).
Table 4: Secondary occupation.
Education: The level of education is generally considered as an index of social advancement of a community or a nation as hole. Education has its own merit and contributes to economic, social, environmental and ethical development. It plays a pivotal and significant role in adoption of new and innovative technology and agricultural modernization especially in rearing buffalo. Education helps men to have day-to-day information on the modern technology and techniques together with technological changes in various production processes. It makes a man more capable of managing scarce resources and maximizing profit. Table 4 showed the education level of the buffalo farmers in the study areas. The highest 47 per cent farmers had primary level education followed by 41 per cent illiterate, 7 per cent SSC, 3 per cent HSC and 2 per cent Degree & up, respectively (Table 5).
| Areas | Education | ||||
|---|---|---|---|---|---|
| Illiterate | Primary | SSC | HSC | Degree & Up | |
| Haluaghat | 21 (42) | 28 (56) | 1 (2) | - | - |
| Madarganj | 29 (58) | 17 (34) | 3 (6) | 1 (2) | - |
| Rajnagar | 14 (28) | 19 (38) | 12 (24) | 3 (6) | 2 (4) |
| Charfasion | 9 (18) | 39 (78) | 1 (2) | - | 2 (4) |
| Golachipa | 23 (46) | 26 (52) | 10 (20) | - | 5 (10) |
| Hatiya | 15 (30) | 15 (30) | 2 (4) | 5 (10) | 3 (6) |
| Ramgoti | 19 (38) | 23 (46) | 2 (4) | 3 (6) | - |
| Sandip | 11 (22) | 36 (72) | 3 (6) | 1 (2) | - |
| Sokhipur | 27 (54) | 19 (38) | - | 1 (2) | - |
| Ullahpara | 38 (76) | 12 (24) | - | - | - |
| Average | 20.5 (41) | 23.5 (47) | 3.5 (7) | 1.5 (3) | 1 (2) |
Source: Field survey 2016 and author’s calculation (Value in the parentheses indicate percentage).
Table 5: Education.
Experience: As the experience is a good indicator for measuring the farm management practices and entrepreneurs’ skills. So, the study was also determined the farmers experiences of rearing buffalo. It was found that 53 per cent buffalo farmers had above 15 years of experience followed by 18 per cent 6-10 years, 16 per cent 11-15 years and 13 per cent up to 5 years of rearing buffalo (Table 6).
| Areas | Range (Years) | |||
|---|---|---|---|---|
| Up to 5 | 6 to 10 | 11 to 15 | Above 15 | |
| Haluaghat | 1 (2) | 8 (16) | 14 (28) | 27 (54) |
| Madarganj | 5 (10) | 7 (14) | 9 (18) | 29 (58) |
| Rajnagar | 2 (4) | 9 (18) | 5 (10) | 34 (68) |
| Charfasion | 7 (14) | 3 (6) | 6 (12) | 34 (68) |
| Golachipa | 7 (14) | 17 (34) | 8 (16) | 18 (36) |
| Hatiya | 2 (4) | 11 (22) | 15 (30) | 22 (44) |
| Ramgoti | 2 (4) | 6 (12) | 7 (14) | 35 (70) |
| Sandip | 6 (12) | 4 (8) | 9 (18) | 31 (62) |
| Sokhipur | 18 (36) | 10 (20) | 3 (6) | 19 (38) |
| Ullahpara | 13 (26) | 15 (30) | 4 (8) | 18 (36) |
| Average | 6.5 (13) | 9 (18) | 8 (16) | 26.5 (53) |
Source: Field survey 2016 and author’s calculation. (Value in the parentheses indicate percentage).
Table 6: Experience.
Farm size, family size, active members and dependency ratio: Average farm size was calculated 1.05 hectare meaning that buffalo farmers belonged to small and medium size farm category. Average family size was estimated 6.17 persons per family which was slightly higher than the national average. Average Active members and dependency ratio were calculated 3.18 persons per family and 1.05, respectively (Table 7).
| Areas | Farm size (ha) | Family size | Active members | Dependency ratio |
|---|---|---|---|---|
| Haluaghat | 1.61 | 6.02 | 3.52 | 0.71 |
| Madarganj | 0.11 | 5.68 | 2.20 | 1.58 |
| Rajnagar | 0.58 | 7.40 | 4.12 | 0.80 |
| Charfasion | 1.61 | 6.02 | 2.92 | 1.21 |
| Golachipa | 1.06 | 6.72 | 2.92 | 1.37 |
| Hatiya | 1.37 | 7.24 | 3.86 | 1.02 |
| Ramgoti | 1.03 | 5.8 | 2.46 | 1.39 |
| Sanwdip | 0.54 | 6.06 | 3.18 | 0.95 |
| Sokhipur | 1.25 | 4.82 | 3.46 | 0.46 |
| Ullahpara | 0.52 | 6.10 | 3.14 | 1.00 |
| Average | 1.05 | 6.17 | 3.18 | 1.05 |
Source: Field survey 2016 and author’s calculation.
Table 7: Family size.
Rearing cost of milking buffalo: For milking buffalo rearing the cost items involved in the production chain are human labour, feed cost, medicine, vaccination, insemination, various equipments and housing etc. These cost items were split into two variable cost and fixed cost. Cash expenditure and imputed value of family supplied inputs were also included in this computation. Human labour was the prime cost factors in milking buffalo rearing in the study areas. Study found that per lactation labour cost was estimated BDT 13913 that was about 57 per cent followed by feed cost 41 per cent and medicine, vaccination & insemination 1 per cent of the total cost. Per lactation total cost was estimated BDT 24507, whereas variable cost was BDT 24249 that was about 99 per cent and fixed cost was BDT 258 that was about 1per cent only (Table 8).
| Cost/ Return | BDT/Lactation | ||
|---|---|---|---|
| A. Variable cost | Buffalo | Percentage (%) | |
| Human labour | 13913 | 56.77 | |
| Feed cost | Dry roughage/straw | 2744 | 11.20 |
| Green fodder | 4313 | 17.60 | |
| Concentrate | 3006 | 12.27 | |
| Medicine, vaccination & insemination | 248 | 1.01 | |
| Rope | 25 | 0.10 | |
| Total variable cost | 24249 | 98.95 | |
| B. Fixed cost | |||
| Capital cost of housing | 134 | 0.55 | |
| Repairing | 76 | 0.31 | |
| Equipment | 48 | 0.20 | |
| Total fixed cost | 258 | 1.05 | |
| Total cost (A+B) | 24507 | 100.00 | |
Source: Field survey 2016 and author’s calculation.
Table 8: Rearing cost of buffalo in the study areas.
Return from milking buffalo: The study found a good number of return items from a milking buffalo namely milk sold, milk consumption by the family members, value of dung and ploughing. It was found that per lactation return from milk sold was estimated BDT 17293 that was 54 per cent followed by the value of milk consumption by the family members 31 per cent, value of dung 5 per cent and earnings by ploughing 11 per cent of the total return (Table 9).
| Items | BDT/Lactation | Percentage (%) |
|---|---|---|
| Milk sale | 17293 | 54 |
| Milk consumption (In family) | 9896 | 31 |
| Value of dung | 1460 | 5 |
| Ploughing | 3465 | 11 |
| Gross return | 32114 | 100 |
Source: Field survey 2016 and author’s calculation.
Table 9: Return from a milking buffalo in the study areas.
Profitability of rearing milking buffalo: From the study, it was estimated that average lactation period was 255 days in the areas. And average milk production was estimated 2 litres/day. The highest return was come from milk production that was BDT 27189. The gross return was estimated BDT 32114 / lactation. The net return was calculated BDT 7865. The BCR was 1.31 (full cost basis) (Table 10).
| Costs & Returns | BDT/Lactation |
|---|---|
| A. Variable cost | 24249 |
| B. Fixed cost | 258 |
| C. Gross cost (A+B) | 24507 |
| D. Gross return | 32114 |
| E. Gross margin (D-A) | 7865 |
| F. Net return (D-C) | 7607 |
| G.BCR (Full cost basis) | 1.31 |
Source: Field survey 2016 and author’s calculation.
Table 10: Profitability of rearing milking buffalo in the study areas.
Artificial Insemination (AI) facilities and distance from AI centre: It was found from the Table 10 that 64 per cent farmers opined that they had artificial insemination facilities and for one service they had to pay about BDT 540. The average distance was 8.81 kilometer from the farmers’ house to AI centre indicating that the access to AI was not easy for the remote farmers (Table 11).
| Selected Areas | AI facility (%) | Average Cost (BDT) | Average distance (Km) |
|---|---|---|---|
| Haluaghat | 44 (88) | 550 | 7.66 |
| Madarganj | 29 (58) | 500 | 4.32 |
| Rajnagar | 39 (78) | 369 | 12.42 |
| Charfasion | 42 (82) | 675 | 10.04 |
| Golachipa | 23 (46) | 550 | 12.18 |
| Hatiya | 18 (36) | 655 | 10.10 |
| Ramgoti | 16 (32) | 510 | 12.14 |
| Sandip | 33 (66) | 525 | 9.06 |
| Sokhipur | 45 (90) | 665 | 4.70 |
| Ullahpara | 31 (62) | 400 | 5.50 |
| Average | 32 (64) | 540 | 8.81 |
Source: Field survey 2016 and author’s calculation. (Value in the parentheses indicate percentage).
Table 11: A.I Facilities and distance of A.I center.
Vaccination: Seventy percent farmers in the study areas vaccinated their buffalo. Where 66 per cent vaccination was done for FMD, 24 per cent for Black quarter (BQ) and 20 per cent for HS, respectively (Table 12).
| Selected areas | Vaccination (%) | Name of vaccines | |||
|---|---|---|---|---|---|
| BQ (%) | FMD (%) | HS (%) | |||
| Haluaghat | 36 (72) | 7 (14) | 33 (66) | 5 (10) | |
| Madarganj | 48 (96) | 13 (26) | 44 (88) | 4 (8) | |
| Rajnagar | 35 (70) | 5 (10) | 34 (68) | 3 (6) | |
| Charfasion | 28 (56) | Nil | 46 (92) | 11 (22) | |
| Golachipa | 47 (94) | 8 (16) | 18 (36) | 13 (26) | |
| Hatiya | 40 (80) | 27 (54) | 34 (68) | 22 (44) | |
| Ramgoti | 48 (96) | 10 (20) | 46 (92) | 15 (30) | |
| Sandip | 20 (40) | 7 (14) | 16 (32) | 8 (16) | |
| Sokhipur | 44 (88) | Nil | 11 (22) | 3 (6) | |
| Ullahpara | 8 (16) | Nil | 3 (6) | Nil | |
| Average (%) | 35 (70) | 12 (24) | 33 (66) | 10 (20) | |
Source: Field survey 2016 and author’s calculation. (Value in the parentheses indicate percentage).
Table 12: Vaccination for buffalo.
Colostrum feeding, D-warming and medical facility: Ninety eight percent farmers feed colostrum to the new born buffalo calf indicating that nowadays farmers are aware of the caring of new born. In the study areas, almost 90 per cent farmers have done D-warming for their buffaloes. On the other hand, 78 per cent farmer showed positive opinion towards good medical services from the Upazila Livestock Hospital (Table 13).
| Selected Areas | Feed colostrums | D-warming | Good medical facility |
|---|---|---|---|
| Haluaghat | 50 (100) | 50 (100) | 22 (44) |
| Madarganj | 50 (100) | 49 (98) | 43 (86) |
| Rajnagar | 50 (100) | 36 (72) | 48 (96) |
| Charfasion | 50 (100) | 50 (100) | 36 (72) |
| Golachipa | 50 (100) | 43 (86) | 41 (82) |
| Hatiya | 50 (100) | 50 (100) | 47 (94) |
| Ramgoti | 49 (98) | 50 (100) | 33 (66) |
| Sandip | 49 (98) | 44 (88) | 38 (76) |
| Sokhipur | 50 (100) | 50 (100) | 46 (92) |
| Ullahpara | 43 (86) | 30 (60) | 35 (70) |
| Average | 49 (98) | 45 (90) | 39 (78) |
Source: Field survey 2016 and author’s calculation. (Value in the parentheses indicate percentage).
Table 13: Information on colostrum feeding, D-warming and medical facilities.
Buffalo population: From the study, it was found that buffalo population was highest (64.24/ farm) in Ramgoti Upazila under Laxmipur district and lowest (2.3/farm) in Haluaghat Upazila under Mymensingh district. Average number of buffalo per farm was found 18.91 (Table 14).
| Selected Areas | Number/Household |
|---|---|
| Haluaghat | 2 |
| Madarganj | 23 |
| Rajnagar | 3 |
| Charfasion | 32 |
| Golachipa | 11 |
| Hatiya | 36 |
| Ramgoti | 64 |
| Sandip | 13 |
| Sokhipur | 2 |
| Ullahpara | 3 |
| Average | 19 |
Source: Field survey 2016 and author’s calculation.
Table 14: Buffalo population in the selected areas.
Family income: had various income sources in the study areas. Among the income sources farming (crop production), service, business, livestock (except buffalo), and buffalo rearing were the major sources. The family income was depicted in Table 15.
| Areas | Crop | Business | Services | Livestock (Except Buffalo) | Buffalo |
|---|---|---|---|---|---|
| Haluaghat | 111594 | 118000 | 164500 | 26634 | 101942 |
| Madarganj | 28929 | 43800 | 36000 | 25833 | 625329 |
| Rajnagar | 53122 | 39821 | 252500 | 34545 | 50084 |
| Charfasion | 103400 | 131250 | 250000 | 31250 | 151594 |
| Golachipa | 118163 | 108276 | 157333 | 10818 | 59458 |
| Hatiya | 103043 | 121667 | 166667 | 10500 | 147697 |
| Ramgoti | 176512 | 240000 | 158200 | 35142 | 475114 |
| Sandip | 35600 | 192500 | 145205 | 51364 | 379399 |
| Sokhipur | 40691 | 254000 | 200000 | 26556 | 85796 |
| Ullahpara | 37553 | 243300 | 205780 | 58152 | 34280 |
| Average | 80861 | 149261 | 173619 | 31079 | 211069 |
Source: Field survey 2016 and author’s calculation.
Table 15: Annual family income from various sub-sectors (BDT).
Buffalo farmers’ the highest (33%) family income was derived from buffalo rearing followed by service 27 per cent, business 23 per cent, crop farming 12 per cent and livestock (except buffalo) 5 per cent. The livestock sector as a whole income was estimated 38 per cent in the study areas (Figure 1).

Figure 1: Percentages of total respondents.
Determinants of participation in buffalo development program: To investigate the determinants of participation in buffalo development program, binary logistic regression analysis was adopted. Logistic regression analysis is used when the dependent variable (farmer type) was dummy. In this study, “Binary logistic model’ was used applying binary dependent variable i.e., value was given one (1) for those household who had under buffalo development project otherwise zero (0). The independent variables were age, education, family size, occupation, experience, farm size, number of buffalo in the household, distance from AI centre, household income, AI facility and number of death buffalo. It was predicted that age, education, farm size, occupation, experience, household income, AI facilities, number of death buffalo and number of buffalo in the household might have positive influence to come under buffalo development project. Similarly, it was hypothesized that distance from AI centre and larger family size might negatively influence in participation of buffalo development program. It was apparent from the value of coefficient that most of the prediction was justified and statistically significant. One the other hand, the households those were far away from AI centre participated less in the buffalo development program than that of nearby households which was found statistically non-significant (Table 16). So, it could be concluded that participation of buffalo development program was helpful and necessary for the buffalo farmers [17-20].
| Independent variables | Coefficients | Standard error | P-value |
|---|---|---|---|
| Age | 0.017 | 0.013 | 0.190 |
| Education | 0.015 | 0.043 | 0.713 |
| Family size | -0.011 | 0.053 | 0.829 |
| Occupation | 0.404 | 0.484 | 0.404 |
| Experience | -0.009 | 0.011 | 0.434 |
| Farm size | 0.323* | 0.194 | 0.097 |
| Number of buffalo | -0.028*** | 0.009 | 0.003 |
| Distance from AI centre | -0.003 | 0.040 | 0.935 |
| HH income | 0.000*** | 2.44e | 0.000 |
| AI facilities | -0.043 | 0.289 | 0.880 |
| Number of death buffalo | -0.142** | 0.070 | 0.041 |
| Constant | -2.762*** | 0.862 | 0.001 |
***, ** and * stands for significant at 1%, 5% and 10% level.
Table 16: Determinants of participation in buffalo development project.
Problems faced by buffalo rearing farmers: Buffalo farmers in the study areas encountered different problems in rearing buffalo. The major problems were lack of feeds and fodder, lack of grazing land, lack of fresh water during flood or prevalence of saline water, lack of good medical facilities, lack of high quality breed, Artificial insemination (A.I) problem, devastation of sea rover/forester, lack of government support (Table 17).
| Problems | Haluaghat | Madarganj | Rajnagar | Charfashan | Galachipa | Hatia | Ramgati | Sandwip | Shakhipur | Ullapara | All |
|---|---|---|---|---|---|---|---|---|---|---|---|
| Lack of feeds & fodder | 7 (14) |
38 (76) | 35 (70) |
45 (90) |
43 (86) |
46 (92) |
31 (62) |
28 (56) |
10 (20) |
23 (46) |
306 (61.2) |
| Lack of grazing land | 4 (8) |
21 (42) |
- | 25 (50) |
5 (10) |
14 (28) |
40 (80) |
30 (60) |
12 (24) |
37 (74) |
188 (37.6) |
| Lack of fresh water | 45 (90) |
12 (24) |
10 (20) |
42 (84) |
10 (20) |
38 (76) |
15 (30) |
40 (80) |
43 (86) |
43 (86) |
298 (59.6) |
| Lack of medical facilities | 12 (24) |
18 (36) |
25 (50) |
8 (16) |
40 (80) |
25 (50) |
12 (24) |
30 (60) |
15 (30) |
46 (92) |
231 (46.2) |
| Lack of high quality breed | 5 (10) |
7 (14) |
- | 4 (8) |
3 (6) |
- | 5 (10) |
12 (24) |
7 (14) |
- | 43 (8.6) |
| A.I problem | 18 (36) |
9 (18) |
38 (76) |
10 (20) |
45 (90) |
43 (86) |
35 (70) |
22 (44) |
9 (18) |
48 (96) |
277 (55.4) |
| Devastation of sea rover & forester | - | - | - | 32 (64) |
- | 16 (32) |
34 (68) |
15 (30) |
- | - | 97 (19.4) |
| Lack of government support | 5 (10) |
14 (28) |
13 (26) |
15 (30) |
18 (36) |
27 (54) |
12 (24) |
24 (48) |
13 (26) |
35 (70) |
176 (35.2) |
Source: Field survey 2016 and author’s calculation.
Table 17: Problems faced by buffalo rearing farmers.
Note: Figure in the parentheses indicates the percentages of total respondents.
As southern parts of the country was observed buffalo farms concentrated areas than other parts and it provided main livelihood support to remote small and medium buffalo holders. In contrast, farmers felt veterinary and other necessary assistance regarding buffalo rearing from government level was minimal. Measurement of benefit cost ratio (BCR) from buffalo rearing was estimated greater than unity indicated that buffalo rearing is a profitable enterprise. For milking buffalo, per lactation total cost was estimated BDT 24507, where variable cost was 99 per cent and fixed cost was 1 per cent only. The gross return was estimated BDT 32114 per lactation and net return was BDT 7865. The study exposed that 31% annual household income generated from buffalo, 5% from livestock except buffalo, 12% from crop, 23% from business and 27% from service sector. Logistic regression analysis indicated that the value of coefficient that most of the prediction was justified and statistically significant meaning that the buffalo development project was helpful for the farmers. Although farmers encountered some problems related to buffalo rearing and profitability of buffalo rearing depends upon successfully overcoming such constraints.
In the light of research findings and suggestions from buffalo farmers the most obvious recommendations for the improvement were as follows:
• Government should provide feed support to the flood affected areas and also should provide subsidies for feed and forage production.
• Good medical facilities should be ensured by the veterinary service providers.
• Government should be taken proper steps for good quality seed and develop public-private partnerships in diversified vaccine production for the prevention diseases.
• Government should provide financial support to buffalo keeping farmers as they can afford treatment of their buffaloes & also can afford high quality breed.