Journal of Stock & Forex Trading
Open Access
ISSN: 2168-9458
ISSN: 2168-9458
Research Article - (2025)Volume 12, Issue 4
The study examined the level of efficiency of rice producers and investigates the determinants of allocative and economic efficiency in Fogera district of Ethiopia. For the successful accomplishment of the study, we use multistage sampling technique to select 153 rice producers and data had been collected using interview and questioners for 2018 production season. The mean technical, allocative and economic efficiencies were 79%, 86% and 68% respectively. The estimation result from Tobit regression result revealed that age and sex were the variables that affect allocative inefficiency positively and significantly while education and experience influences allocative inefficiency negatively and significantly. Similarly economic inefficiency was positively and significantly influenced by age, sex and extension service while training affects economic inefficiency negatively and significantly. Thus, the researcher recommended policies targeting institutional improvements (training, education and membership of farmer associations) and focusing on experience of farmers would improve farmer’s efficiency in rice production.
Ethiopia; Economic efficiency; Tobit model; Stochastic frontier models
Agriculture is the most crucial sector in the Ethiopian economy. The sector contributes about 36.7% of the country annual GDP, about 85% of the employment of the labor force and almost 85% of the sources of foreign exchange currency are also dependent on the agricultural sector. In Ethiopia wide varieties of agricultural crops are cultivated. Of which cereal crops are the largest. Cereal crops accounts for 62% of total agricultural output, absorbs 60% of rural employment and about 80% of cultivated land areas are allocated for these crops. Cereal crops also account 40% of household’s food expenditure and 60% of calorie intake. These crops alone account for about 30% of the country’s GDP. Among the food products, rice has continued to be the foremost important cereal in term of consumption by quite 2.6 billion people within the world [1].
Rice is the most important cereal food crops grown in different agricultural regions and agro ecological zones of Ethiopia. From the total cultivated area, the potential rice production area in the country is estimated to be about thirty million hectares. Currently, mainly rice is produced in Amhara, SNNP, Oromiya, Somalia, Gambella, Benu Shangul Gumuz, Tigray and Afar regions in Ethiopia. In Ethiopia, rice is among the target cereal crops that have received due emphasis in promotion of agricultural mechanization and production and as such it is considered as the ‘millennium crop’ expected to contribute large to ensuring food security and rural poverty reduction in the country. Rice has become a point of interest because it offers a number of advantages (including easy storage, well adapted to hydromorphic land during rainfall season and high potential demand mainly for domestic consumption) compared to other cereal crops [2].
Although rice production in terms of yield show improvements, its productivity did not record any increase. Instead, it fell from 66 quintal to 63.6 and to 62 quintal during the 2015, 2016 and 2017 production period respectively. Thus, adopting new technologies, use of modern input and improving the production and productivity of the agriculture sector to reduced poverty and achieve food security is the basic strategies of the Ethiopian government. But still now the country is food insecure and majority of the country’s population is found in sever poverty mainly because of lack of improved agricultural technology and inefficient agricultural production. Rapid population growth also multiplies the problems related to food and other fundamental human needs. Increasing food production is itself a complex process involving more intensive and extensive use of resources like land and water, increased supply of basic modern agricultural inputs, establishing appropriate agricultural policies, developing rural institutions and strengthened agricultural researches and inventions. However, if large effort is made, the potential for increasing food production in every country in the world would be successful. The smallholder farmers, who are producers of the major share of the agricultural output in Ethiopia, commonly employ backward production technology and limited use of modern agricultural inputs. For developing countries like Ethiopia food self-sufficiency can be realized by enhancing crop production which accounts large proportion of agricultural production and productivity of the agriculture sector in which the livelihood of the dominant population depends [3].
In the study area rice is a major staple food and it takes the lion share in terms of the extent of production, food consumption, number of producers and area coverage relative to other cereal crops which are produced in the district. However, still its production was owned by small holder farmers which use traditional way of farming, backward technologies and less modern inputs. This is due to the difficulty for agricultural researchers to identify when and how new technologies are used by farmers, shortage of finance to farm technologies and other farm expenditure owing to the lower per capita income of farmers and higher prices of agricultural technologies.
Theory of production is defined as an effort to explain the principle by which a firm decides how much of each commodity will produce for selling and how many of factors of production will employ in the production of an output. According to Henderson et al., the objective of a rational firm is maximizing profit using either maximizing quantity of output or minimizing cost subject to producing a given output level in the process. The production method is cost economical if it prices less of inputs by manufacturing a lot of the output and explained by the improvement behavior of the producer. Within the production process, the behavior of the producer is either maximizing output given cost or minimizes cost given output level constant [4].
Cobb-Douglas production theory explains the factors of production or resources that are used in the production process to produce output that is finished goods and services. The production function is the amount of the various inputs used to determine the quantity of output to be produced. In economics, there are three factors of production or resources; labor, land and capital. These factors are also frequently labeled either producer goods or consumer goods. In the factor market firms are purchase inputs from households and convert it into merchandise and services for the objectives of profit maximization. Within the alternative approach, households are the house owners of factors of production and earn financial gain from commerce their resources. According to them Cobb- Douglas production performs is that the practical sort of function that accustomed represents the technological relationship between inputs and outputs [5].
Ali et al. expected the EE of wheat and faba bean manufacturing in Northern State Sudan the use of the SFPF and price functions (CF). A pattern of a hundred and twenty farmers from Dongola locality inside the North and Ed-abba locality inside the South of the State in 2004/05 wintry weather season had been selected using a randomized multi-degree stratified sampling technique. SFPF and CF had been used to estimate the EE of farmers. The outcomes confirmed that the suggest TE of wheat had been 0.75 and 0.66 in Dongola and Ed-abba, respectively, whilst for faba bean they had been 0.65 and 0.71, the general suggest AE of wheat in the localities had been 0.72 and 0.68, whereas, they had been 0.86, 0.84 for faba bean. The expected common imply of EE that expected as inverse in their CE of wheat had been 0.41 and 0.45 inside the localities, while in faba bean manufacturing they had been 0.57 and 0.62 in Dongola and Ed-abba, respectively. It shows that the EE of faba bean is best than wheat. Nansak N. carried out a look at on financial evaluation of maize manufacturing in Soba nearby authorities’ location of Nigeria. The expected suggest technical performance for maize farmers became 0.87. The suggest allocative performance of the maize farmers became 0.62, whilst the suggest financial performance of the maize farmers became 0.54. The studies discovered that, a few of the important constraints diagnosed in maize manufacturing within side the look at location had been excessive price of inputs (24%), insufficient capital (23%) insufficient extension services (18%), bad promoting marketplace price (15%), bad weather conditions (11%) and pest and disease (6%). High price of farm enter like fertilizers, advanced seeds and herbicides are the main constraints confronted through maize farmers. Finally he endorsed that, the authorities in partnership with the personal area must make to be had those inputs at backed costs via the small and medium scale enterprises. Ndayitwayeko and Korir expected technical performance of rice manufacturing beneath irrigated gadget in Gihanga in Burundi and diagnosed the determinants of technical inefficiency. The look at used a Cobb- Douglas stochastic frontier manufacturing function. On average, they located that there may be a room to use up manufacturing through successfully combining inputs. The look at discovered in addition that revel in of the rice farmer became improving drastically the performance stage whilst age of the rice manufacturer became located to have an effect on negatively the performance stage. Other elements diagnosed to have an effect on undoubtedly the performance stage had been the extension services, farmer’s schooling and well-timed pesticide delivery. Magreta et al. hired the SFA to assess TE, AE and EE of rice manufacturing and additionally explored the elements that have an impact on the performance tiers of the rice farmers in Nkhate irrigated scheme in Malawi. The look at used trans-log stochastic manufacturing frontier to studies technical performance and used additionally tarns-log price function to studies the financial performance. The look at discovered that farmers have a rice yield capacity of 35% to be exploited and farmers should increase their profitability through 47% through adjusting enter use. It has additionally been located that soil fertility status, get admission to credit, family length and farmers revel in had been the elements that have an impact on the performance tiers. Ouedraogo carried out a look at on financial performance at the irrigated land of Bagre in Burkina Faso making use of SFA. He had an goal of assessing the potentials for growth rice manufacturing and figuring out the determinants of performance that had to be boosted. The outcomes indicated that there may be a capacity to be exploited if farmers integrate inputs in a green manner. Factors like mineral fertilizer, advanced seed and capital had been diagnosed to enhance financial performance if nicely utilized by rice farmers [6].
Getachew et al., studies economic potency of farmer farmers in barley production in Meket district, Ethiopia by exploitation cross sectional knowledge collected from a sample of 123 barley producers throughout the 2015/2016 production season. The calculable random production frontier model indicated input variables like fertilizer, human labor and oxen power as vital variables that increase the number of barley output, whereas barley seed had a negative effect. The estimated mean levels of technical, allocative and economic efficiencies of the sample farmers were concerning 70.9, 68.6 and 48.8%, severally that discovered the presence of a neighborhood to increase their technical, allocative and economic efficiencies level on the common by 29.1%, 31.4% and 51.2%, severally with the prevailing resources [7].
The study conducted by Solomon, uses stochastic production frontier model to estimate TE, AE and EE levels, whereas Tobit model was used to identify factors affecting efficiency levels. The results indicated that there was significant inefficiency in wheat seed production within the study area. Accordingly, the mean TE, AE and electrical engineering of sample households were 79.9%, 47.7% and 37.3%, respectively.
Description of the study area
Fogera district is one of the rural districts found in the South Gondar Zone and it is one of the 151 districts found in the Amhara region. The capital city of the district is Woreta and it far from 625 km northwest of Addis Ababa and 55 km from the regional capital, Bahir Dar. The land use pattern of the district is characterized by 48% cultivated land, 22% grazing land, 21% water bodies, 2% forest land and 7% for others. There are total 30 rural Kebele’s and 5 urban Kebele’s. As per population census conducted in 2015, the population of the district was 258,883 [8].
The district is endowed with diverse natural resource and it is one of the surplus foods producing district as in the region with capacity to grow diverse agricultural crops. According to the district office of agriculture, different types of crops are grown in the summer and dray season. Farmers in the district depend on rainfall season for crop production. The crops that are grown in Fogera district in the summer season include rice, teff, maize, nug and finger millet. Farmers in the district also produced onion and tomatoes in the dry season by using irrigation.
In this Fogera district, rice was first produced in the early 1970's and it was the beginning for rice introduction in the woreda as well as in the regional state. Now the time it is the most commonly cereal crop produced in the district. Almost 21 rural kebeles in the district produced rice and large number of the livelihood use rice for consumption and it is the main source of their farm income [9].
Sampling technique and sample size determination
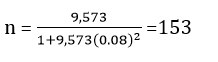
In this study, samples are selected at two successive stages. In the first stage out of 21 rural rice producing kebeles of the district a total of representative rice producing kebeles were selected purposely based on the extent of their rice production. In the second stage, 153 sample farmers are selected by using simple random sampling technique from 6 Gotes (two Gotes from each kebeles). Given that the population size of Gotes is comparable, sample size is taken proportionately. The sample size of farmers is determined by applying Yamane’s formula with confidence interval of 92% and variability of 0.08.

Where, n is sample size, N is number of household head and e is the desired level of precision.
Data type, sources and methods data collection
The cross-sectional primary data on socio economic and farm related, cost and production information is collected from 153 rice producing households through interview using structured questionnaire in 2018 production period. The primary data is collected by preparing structured questionnaires and interview is conducted on those household who is selected as sample of study area. While secondary data is also collected from different governmental and non-governmental institutions include both published and unpublished documents regarding the baseline general information to support the primary data and website [10].
Model specification
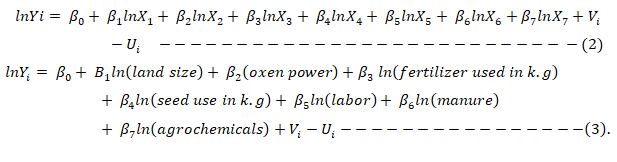
Stochastic frontier models: The two most important approaches to estimate/measure technical, allocative and economic efficiency levels are the stochastic frontier analysis (stochastic) and the Data Envelopment Analysis (DEA) or nonparametric approach. The DEA fails to take into consideration the possible impact of random shock in production like measurement error and other noise in the data set and it is not parametric. Because of its possible advantages over the other methods that are usually used in efficiency analysis, the stochastic frontier production and cost frontier approaches are employed to estimate the level of technical, allocative and economic efficiencies. The cob-Douglas production function for stochastic frontier can be written as:

Where: Yi indicates the production of the ith farmer in kg, f(Xi, β) is suitable functional form (like Cobb-Douglass, translate to log), Xi is a vector of inputs used by the ith farmer, β is a vector of unknown parameters to be estimated, Vi is a random variable which is assumed to be N (0,σv2) that captures the stochastic effects outside the farmer’s control and independent of the Ui which is nonnegative random variable assumed to account for technical inefficiency in production and are assumed to be independently distributed as truncations at zero with mean μi and variance σu2 (N(μi, σu2)). To mention, it is selected due to its simplicity and the logarithmic nature of the production function that makes econometric estimation of the parameters a simple matter. It is also very parsimonious with respect to degrees of freedom and it is convenient in interpreting elasticity of production and the fact that it has a universally smooth and convex isoquant.
The technical efficiency of the ith firm is estimated by the ratio of the observed output to maximum possible output, where the former is provided by the stochastic frontier production function.

Where, Yi is the actual output and Yi* is the potential output of the ith farmer technical inefficiency=1-TE
The linear functional form of Cobb Douglas production function which can be used for this study is given by:
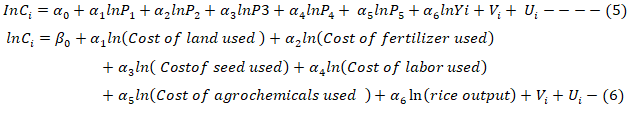
To estimate the level of allocative efficiency the researcher used stochastic cost frontier with respect to its Cobb Douglas form. The selection of stochastic cost frontier has similar reason as to the selection of stochastic production frontier. Production function is self-dual, the dual cob-Douglas cost frontier can be written mathematically and written in a general form as;

Where, Ci=the production cost if rice for the ith farmer; Yi= the output as defined before; pi=vector of cost of inputs used by the ith farmer; α=vector of parameters to be Estimated; Vi and Ui are defined as mentioned earlier. The linear cost frontier function is
The last step for completing objective one is to compute economic efficiency for each individual farmer and this is achieved by combining the above results for Technical efficiency and allocative efficiency. According to Bravo-ureta and Pinheiro economic efficiency is the product of technical and allocative efficiency. At each individual farm level, EE is therefore computed as follows:

Inefficiency model: From the stochastic frontier production model, the farmer-specific technical efficiency and inefficiencies are estimated. The estimated inefficiencies are then assumed to be explained by socioeconomic, institutional and demographic factors which includes; age of the household head, sex of the household head, family size, education level of the household head, membership of farm association, extension service, year of experience in farming and training received. Ui in the stochastic production frontier represents non-negative random variables which are assumed to account for technical inefficiency in production and are assumed to be independently distributed as truncations at zero with mean μi and variance σu2 (N(μi, σu2). The technical inefficiency model is specified as follows using the Tobit model:

Where, Wi’s are socioeconomic, demographic and farm relate d factors and σ’s are unknown parameters to be estimated.

Where, W1=age, W2=sex, W3=family size, W4=Education, W5=extension service, W6=membership of farmers association, W7=experience, W8=training and eI is the error term.
It was assumed that allocative inefficiency effects were independently distributed and Ui* arise by truncation at zero of the normal distribution.

Where Z’s represent the above socioeconomic, demographic and farm related variables such as, age, gender, family size, education, extension service, membership of association, experience and training.
Summary statistics of variables
The levels of inputs used and output produced description in the study area are shown in Table 1. The inputs that are used in rice production include; land, oxen, fertilizer, seed, labor, manure and agrochemicals. Analysis of input use quantities aims at indicating the characteristics nature of rice farming activities that dominate the rice production system and helps to the understanding of efficiency levels and to identify the factors that attributes to inefficiency for rice producers in Fogera district.
|
Variable |
Mean |
Minimum |
Maximum |
Std. dev. |
|
Rice output |
2652 |
100 |
10000 |
1639 |
|
Land size |
1 |
0.25 |
5 |
0.54 |
|
Oxen |
1.7 |
0 |
5 |
1.77 |
|
Fertilizer |
187.5 |
25 |
600 |
97.5 |
|
Seed |
96 |
25 |
200 |
35 |
|
Labor |
27 |
2 |
70 |
11.4 |
|
Manure |
70 |
0 |
800 |
143 |
|
Agrochemicals |
2 |
0 |
10 |
1.5 |
Table 1: Summary statistics of production level and inputs used of rice farmers.
The result in Table 1 indicates that the mean land size was 1 hectare. The minimum and maximum land size was 0.25 hectares and 5 hectares, respectively. From the result it has been found that fertilizer input is underutilized in the study area. The average quantity of seed used by the rice farmers was 96 kilogram. This average seed rate was found between the recommended rates of 80-100 kilogram. The maximum and minimum quantity of seed used by rice producers was 25 kg and 200 kg respectively. The average laborers participated was 27 man/day while the minimum and maximum were observed to be 6 man/days and 70 man/days respectively. This shows that rice production in the study area is small scale and labor intensive. The average quantity of manure used by rice producers was 70 kg. The maximum and the minimum amount is 0 and 800 kg respectively which indicates that rice producers underutilized manure due to shortage of labor to prepare, inadequacy of animals to prepare and even due to lack of awareness of farmers. The average quantity of agro-chemicals used by the rice producers was 2 liters/hectare which was lower than the recommended rate of 4 liters/hectare.
Econometric analysis
Stochastic frontier production function model results: As the estimated values of the coefficients and related statistics of the Cobb-Douglas production function for the sample farmers producing rice presented in Table 2 shows out of 7 independent variables used in the model, five variables are found to be positively significant.
The γ parameter is very important because it shows the relative magnitude of the inefficiency variance associated with the frontier model which assumes that there is no room for inefficiency in the model.
| Variable | Coefficient | Std. Error | P value |
| Constant | 5.457*** | 0.462 | 0 |
| Ln(land size) | 0.445*** | 0.074 | 0 |
| Ln(oxen) | 0.085 | 0.055 | 0.125 |
| ln(fertilizer) | 0.117** | 0.054 | 0.032 |
| ln(seed) | 0.242** | 0.088 | 0.006 |
| ln(labor) | 0.248*** | 0.057 | 0 |
| Manure | 0 | 0.0001 | 0.291 |
| Agrochemical | 0.042** | 0.017 | 0.016 |
| Variance parameter for the error component | |||
| Sigma squared σ2=σv2+σu2 | 0.11 | 0 | |
| Gamma=σu2/σ2 | 0.88 | 0 | |
| Mean technical efficiency | 0.79 | ||
| Mean technical inefficiency | 0.21 | ||
Table 2: Maximum likelihood estimation of the stochastic frontier production function.
Technical efficiency score
The Cobb-Douglas frontier production function was used to estimate the level of technical efficiency of rice farmers in the study area.
Given the functional form used, estimation of procedures implemented, distributional assumption of the inefficient effect Ui assumed, the mean technical efficiency of sampled rice farmers in the study area is estimated to be 79 percent. This figure indicates that most farmers are not technically efficient in producing rice and then they can increase output. This implies that farmers can increase output by 21 percent without increasing the existing level of inputs; labor, land, oxen, fertilizer and agrochemical. Put differently, farmers on average could decrease inputs by 21 percent to produce the existing level of output if they use inputs efficiently. In another words, since output oriented considerations were essential for rice producers, they could increase production by an average 21 percent with the existing inputs and currently available technology by operating at full technical efficiency level (on the frontier).
Stochastic frontier cost function model results
Stochastic frontier cost function analysis gives summary statistics of six input cost variables used in rice production and rice output such as, cost of land, cost of fertilizer, cost of seed, cost of labor, cost of agrochemicals and ln(rice output). In the frontier cost function the dependent variable of the estimated model was log of total cost of rice production incurred in the main cropping season of 2018 G.C
All coefficients associated with cost variables were positive, implying that the assumption of non-decrease of cost function in output and input prices was satisfied. For the cost function, the sigma σ2=0.05 and the gamma γ=0.66 are quite high and highly significant at 1% level of significance. The high and significant value of the sigma square (σ2) indicate the goodness of fit and correctness of the specified assumption of the composite error terms distribution assumed. The gamma (γ=0.66) shows that 66% of the variability in the output of rice farmers that are unexplained by the function, is due to allocative inefficiency (Table 3).
| Variable | Coefficient | Std. error | P value |
| Constant | 1.388*** | 0.396 | 0 |
| Ln(c of land) | 0.554*** | 0.071 | 0 |
| Ln(c of fert) | 0.058* | 0.031 | 0.062 |
| Ln(c of seed) | 0.037 | 0.065 | 0.564 |
| Ln(c of labor) | 0.154*** | 0.025 | 0 |
| Ln(c of agroche) | 0.061** | 0.024 | 0.012 |
| Ln(output) | 0.134** | 0.06 | 0.026 |
| Variance parameter for the error component | |||
| Sigma squared σ2=σv2+σu2 | 0.0549 | Mean allocative efficiency | 0.86 |
| Gamma=σu2/σ2 | 0.66 | Mean allocative inefficiency | 0.14 |
| Note: ***,** and * indicates significant at 1%, 5% and 10% | |||
Table 3: Maximum likelihood parameter estimation of the Stochastic Frontier cost function.
The coefficient of cost of land (0.554) is positive and significant at 1% level of significance level. This implies that land is important in cost rice production. The implication of this is that 1% increase in the rental cost of land will give rise to 0.55% increase in the total cost of rice production. The coefficient of cost of fertilizer of rice producers was 0.058 which is positive and significant at 10% level of significance. This implies that 1% increase in the cost of fertilizer used will increase the cost of rice production by about 0.058%. Rice farmers can minimize cost of fertilizer by using compose in place of fertilizer.
The cost of labor (0.154) is positive and significant at 1% significance level. This implies that 1% increment in cost of labor will increase the total cost of rice production by 0.15%. Since rice farmers used cheap family labor cost of labor contributes only 15% to total cost of rice production. The result is in conformity with Mohammed et al., on comparative study of rain-fed and irrigation methods of rice production in Dadinkowa Gombe State, Nigeria.
The cost of agrochemicals was 0.061 which is positive and significant at 5% significance level. Which means that 1% increment in cost of agrochemicals used in liters will increase the cost of rice production by 0.06%.
The coefficient of rice output (0.134) is positive and significant at 5% level of significance. This implies that as the quantity of rice produced increased, the cost of rice production increases. This shows that the cost of production is influenced by the quantity of rice output realized and it satisfied the assumption of cost function is non-decreasing in output. The result is similar with Mohammed, on economics of rain-fed and irrigated rice production.
Allocative and economic efficiency scores and their distributions
The mean allocative efficiency is estimated 86% implying that rice farmers are not producing with minimal cost and farmers still have a room to reduce their cost about 14% in order to be efficient allocatively.
The mean economic efficiency is 68% to mean that rice producers in the study area could raise their profitability by about 32% if they could undertake efficient allocation of inputs with their minimal cost with the existing technology in the study area. The distribution of the technical efficiency estimates for sampled rice farmers in the study area as obtained from the stochastic frontier production model is presented in Table 3. The study revealed that 70.4% of the rice farmers had Technical Efficiency (TE) of 0.61 and above while 29.6% of the farmers operate at less than 0.61 technical efficiency levels.
As shown in the table below (Table 3), the rice farmers with the best and least practices had technical efficiencies of 0.95 and 0.35 respectively. This implies that on the average, rice output fall by 5% from the maximum possible level of 1.00 due to technical inefficiencies and the mean technical efficiency is given to be 0.79.
This implies that on the average, rice farmers are able to obtain 79% potential output from a given mix of productive resources. There is room for increasing rice output by 21% by adopting the techniques and technologies employed by the best practiced rice farmers. The result of distribution of allocative efficiency revealed that 12.92% of the sampled rice farmers had allocative efficiency of below 0.8 while majority (87.08%) of the farmers had allocative efficiency levels of above 0.8 (Table 4).
| Efficiency | TE | AE | EE | |||
| Levels | Freq. | Percentage | Freq. | Percentage | Freq. | Percentage |
| 0.01-0.20 | 0 | 0 | 0 | 0 | 0 | 0 |
| 0.21-0.40 | 7 | 4.69 | 0 | 0 | 0 | 0 |
| 0.41-0.60 | 33 | 24.91 | 0 | 0 | 14 | 9.52 |
| 0.61-0.80 | 52 | 34.89 | 19 | 12.92 | 133 | 90.48 |
| 0.81-1.0 | 54 | 35.51 | 128 | 87.08 | 0 | 0 |
| Total | 146 | 100 | 147 | 100 | 147 | 100 |
| Mean | 0.79 | 0.86 | 0.68 | |||
| Minimum | 0.35 | 0.62 | 0.49 | |||
| Maximum | 0.95 | 0.96 | 0.76 | |||
| Std. dav | 0.12 | 0.06 | 0.05 | |||
Table 4: Summary of distribution of TE, AE and EE scores of rice farmers.
This implies that the greater majority of rice farmers were allocativelly efficient as 87% of them attained efficiency level 0.8 and above. The estimated allocative efficiencies among the rice farmers were ranging between the minimum value of 0.62 and maximum value of 0.96. The farmers had average allocative efficiency of 0.86 implying that farmers still can to reduce their cost by 14% in order to be efficient allocatively.
The frequency distribution of the economic efficiency estimates of the farmers in the study area shows that about 9.52% of the farmers operate below 0.61 efficiency levels. The mean economic efficiency of the farmers in the study area was 0.68. The farmers with the best and least practice had economic efficiencies scores of 0.76 and 0.49 respectively. Rice farmers have the possibility of increasing their economic efficiency by 32%.
Technical inefficiency and factors influencing of rice production
Under objective two of this study, this section intends to identify some of the factors that influence inefficiency levels among rice farmers in fogera district. The results for this analysis are important to be used as basic information to agricultural policy makers on what factors should interventions is focused to improve rice productivity. Since the dependent variable of the function represents inefficiency, a positive sign of an estimated parameter implies that the associated variable has a negative effect on technical efficiency and a negative sign (Table 5).
| Variables | Coefficient | Std. error | P value |
| Age | 0.0004 | 0.0005 | 0.341 |
| Sex | 0.0389*** | 0.0146 | 0.009 |
| Education | 0.0189 | 0.1286 | 0.143 |
| Family size | 0.0065** | 0.0303 | 0.032 |
| Ext. service | 0.0164* | 0.0086 | 0.059 |
| Membership | -0.0360*** | 0.0122 | 0.004 |
| Experience | -0.0001 | 0.0008 | 0.901 |
| Training | -0.0329*** | 0.0086 | 0 |
| Constant | 0.0914*** | 0.0217 | 0 |
| LR chi2 | 56.34 | ||
| Prob. chi2 | 0 | ||
| Pseudo R2 | -0.1326 | ||
| Note: ***, **, * indicates significant at 1%, 5% and 10% | |||
Table 5: Tobit regression results on determinants of technical inefficiency levels.
The result of the technical inefficiency model presented in Table 4 shows the estimated coefficients with negative signs attached indicate that they reduce technical inefficiency of the rice farmers. The results showed that sex, family size, extension visits/service, membership farm associations and training were the determinants of technical inefficiency of the sampled rice farmers. Membership of farm association and training were negatively related with technical inefficiency while sex, family size and extension visit were positively related with technical inefficiency of sampled rice farmers.
The dummy sex of the household head showed positive and significant effect on technical inefficiency of rice farmers at 1% level of significance. Implies that male headed households were technically inefficient than female headed household by 0.038%. Women farmers were found to be more efficient than their men counterparts. Female-headed households would have better opportunities to carry out frequent follow up and supervision of the farm activities on their plot and female farmers are more likely to attend meetings.
The estimated coefficient of family size (0.006) is positive and significant at 5% level of significance. This implies that as household size increases by 1 member, the technical inefficiency increases by 0.006% thereby reducing technical efficiency of farmers. Those households which have large family members were faced with the challenge of attending to numerous family needs, which reduced the magnitude of resources allocated to rice farming activities.
The estimated coefficient of extension contact/service (0.016) has a positive sign related to technical inefficiency and significantly at 10% level of significance. This implies that increase in extension contact will increase technical inefficiency or this shows that the more extension visit a rice farmer receives, the higher will be his level of technical inefficiency or the lower his level of technical efficiency. The sign is inconsistent with the priori prediction and the result is contradictory with that of Berhan, Taddesse, et al. and Abawiera.
The estimated coefficient of membership to farm association (-0.0360) is negative and significant at 1% level significance. This means that as rice farmers belongs to member of farm association their technical inefficiency will decline. This shows that farm association contributes increasing in the technical efficiency of the rice farmers. Farmers association has more access to agricultural information, credit and other production inputs. In this study, training was a fundamental factor of technical inefficiencies. It was found to have a negative (-0.0329) and significant at 1% effect on technical inefficiencies. The negative coefficient of training shows that a farmer who gets training so many times or frequently in the last crop season is technically more efficient or less inefficient than those who get few training in the last crop season. Providing continuous training to smallholders and follow-up smallholders’ farming activities about input practice during rice production is therefore significant.
Factors influencing allocative inefficiency of rice producers
The Tobit regression result of the inefficiency model of the stochastic frontier cost function estimated level of allocative inefficiency revealed that age, sex, education and experience were the determinants of allocative inefficiency of the rice farmers. Age and sex influence it positively while education level of the household head and year of farming experience influence allocative inefficiency negatively. Since the dependent variable of the function represents inefficiency, a positive sign of an estimated parameter implies that the associated variable has a negative effect on allocative efficiency and a negative sign indicates the associated variable has a positive effect on allocative efficiency of rice production.
As seen from the table below, Age has an estimated positive coefficient of 0.001 and is significant at 1% level of significance. When the farmer’s age is increased by 1 year his/her allocative inefficiency is increased by 0.001%. This implies that the more advanced in age a rice farmer is, the higher will be his allocative inefficiency. The older a farmer is, the poorer his ability as a decision maker to obtain and process information about prices and technology. The result of the study is similar with Abdur Rouf, Bealu et al. and K.W Sibiko et al.
The coefficient of the dummy sex was 0.037 which is positive and significant at 5% level of significance. This implies that male household headed is inefficient allocatively than their counter part or female. This result is consistent with Aynalem, Isahet et al., and Kifle. The estimated coefficient of the categorical education was (-0.033) which has negative and significance at 5% level effect on allocative inefficiency. This indicates that when the farmer has primary and secondary education his or her level of allocative inefficiency has to be reduced or the level of allocative efficiency has to be increased.
The negative and significance effect of experience (-0.002) on allocative inefficiency indicates that farmers with more experience of rice production were more efficient than those with less experience. When the farmers become experienced in rice farming they develop risk aversion nature. The result revealed that rice farmers be efficient in allocation as their years of farming experience increases because they capture learning by doing principle by learning from their past mistakes of inputs utilization (Table 6).
| Variable | Coefficient | Std. error | P value |
| Age | 0.001*** | 0.0006 | 0.01 |
| Sex | 0.037** | 0.018 | 0.042 |
| Education | -0.033** | 0.159 | 0.035 |
| Family size | -0.003 | 0.003 | 0.294 |
| Ext. service | 0.011 | 0.01 | 0.286 |
| Membership | 0.007 | 0.015 | 0.617 |
| Experience | -0.002* | 0.001 | 0.06 |
| Training | -0.012 | 0.107 | 0.264 |
| Constant | 0.094 | 0.026 | 0.001 |
| Log likelihood | 205 | Prob. Chi2 | 0.012 |
| LR chi2 | 19.54 | Pseudo R2 | -0.049 |
| Note: ***,** and * indicates significant at 1%, 5% and 10% | |||
Table 6: Tobit regression results on determinants of allocative inefficiency.
The result indicates that, allocative efficiency requires better knowledge and managerial skill of operating farm activity. Generally the significant effect of education on allocative efficiency indicates the importance of education in increasing the efficiency of rice production. The finding is also consistent with Abawiera et al., Bahati and Kunzilua and Shumet and in line with research done by Aynalem in North Ethiopia.
Economic inefficiency of rice production
This section presents the main factors that influence economic/ overall inefficiency levels among rice farmers in fogera district. The economic inefficiency model presented in Table 6 showed that four out of eight variables were statistically significant at influencing economic inefficiency of sample farmers. Since the dependent variable of the function represents inefficiency, a positive sign of an estimated parameter implies that the associated variable has a negative effect on economic efficiency and a negative sign indicates the associated variable has a positive effect on economic efficiency of rice production.
Age contributed negatively to the economic efficiency or positively to economic inefficiency in this study; in other words, younger farmers were relatively more efficient than older farmers. The reason could be younger farmers had more contacts with extension agent services, plot demonstration and agricultural meetings. The younger the farmer is, the more reluctant he/she is to accept new farm technologies. The dummy Sex of household head was found to have positive and significant influence on economic inefficiency at 1% level of significance. This implies that male household head are found to be economically inefficient than their counterpart. If the household head were male his or her economic inefficiency have increased by 0.065%.
The coefficient of extension service is 0.0239 and it has significant effect on economic inefficiency at 5% level of significance. This is an indication that extension service contributed towards increasing economic inefficiencies of the rice farmers.
This is because most of the time extension agents were more focused on political issues rather than agricultural advises. The result is inconsistent with the priori expectation. But extension service help farmers to respond fast to new technologies and appreciate correct management practices like timely planting and weeding, the correct amount of fertilizer to be applied. Training farmers about agricultural operation is important for farmers to improve their productivity and efficiency. Training influence economic inefficiency negatively and significantly at 1% level of significance. The coefficient is -0.039. This shows that as farmers receive frequent training their level of economic inefficiency decreased or their level of economic efficiency increased. To improve economic efficiency of rice farmers both the government and non-governmental organization should provide training and expanding their coverage to rice farmers in the study area (Table 7).
| Variable | Coefficient | Std. error | P value |
| Age | 0.0018*** | 0.0006 | 0.008 |
| Sex | 0.0653*** | 0.1985 | 0.001 |
| Education | -0.0131 | 0.0174 | 0.454 |
| Family size | 0.0025 | 0.0041 | 0.54 |
| Ext. service | 0.0239** | 0.0117 | 0.043 |
| Membership | -0.0239 | 0.0169 | 0.162 |
| Experience | -0.0018 | 0.0011 | 0.121 |
| Training | 0.0390** | 0.0117 | 0.001 |
| Constant | 0.1774 | 0.0296 | 0 |
| Log likeliho | 190 | Prob. Chi2 | 0 |
| LR chi2 | 44.1 | Pseudo R2 | -0.1312 |
| Note: ***,** and * implies significant at 1%, 5% and 10% | |||
Table 7: Tobit regression results on determinants of economic inefficiency levels.
This study was investigated to estimate the technical, allocative and economic efficiency of rice farmers and to determine the socio-economic, farm specific and institutional factors that affect the technical, allocative and economic efficiencies in Fogera district. Using primarily collected data from households, the maximum likelihood estimation of the production stochastic frontier shows that land size which is used for rice production has the highest elasticity, implying that land is the most important input in the production of rice followed by labor, seed, fertilizer and agrochemical with value 0.445, 0.248, 0.242, 0.117 and 0.042 respectively. The mean economic efficiency of sampled rice producers was 68%. This figure implies that rice producers in the study area could raise their profitability by about 32% if they could undertake efficient allocation of inputs with their minimal cost. Generally there is room for further increase in output without increasing the level and cost of inputs.
Tobit model was used to identify the main factors affecting the level of technical, allocative and economic inefficiency or efficiency of rice farmers in the study area. These factors are age of the household head, sex of the household head, family size, extension service, membership farm association, training received, education level of the household head and years farming experience.
Rice production inputs such as land size, fertilizer, seed and agrochemical are significantly and positively influenced rice output in the study area. Hence, the timely and adequate supply of those inputs should be available to rice producers at affordable price. The ever increasing higher cost of inputs such as cost of fertilizer and agrochemical are the other constraints faced by rice producers. Therefore the government should supply those inputs at subsidized price.
Educational level of the household head influenced allocative efficiency positively and hence, interventions to improve educational status of farmers by the government and other NGOs should be promoted. The government has to give attention for strengthen formal education. Finally, the study recommended that both the government and NGOs involved in rice production should provide continuous training on better inputs usage, on modern agricultural technology and on technical know-how and follow up farmers’ activity.
The data used for this finding is primmery cross section data collected from respondenrs and the data is on the hand of the principal researcher and hence I can provide it to editors when needed.
No conflict of interest.
The study did not receive any fund in any form.
All co-authors equally participate and contribute in this scentific work.
Citation: Abate TW, Ali MY, Ayele GA, Sitotaw KW. Economic Efficiency Analysis of Rice Production in Fogera District, South Gondar Zone of Amara Regional State, Ethiopia. J Stock Forex. 12:278.
Received: 01-Feb-2024, Manuscript No. JSFT-24-29431; Editor assigned: 05-Feb-2024, Pre QC No. JSFT-24-29431 (PQ); Reviewed: 19-Feb-2024, QC No. JSFT-24-29431; Revised: 03-Mar-2025, Manuscript No. JSFT-24-29431 (R); Published: 10-Mar-2025 , DOI: 10.35248/2168-9458.25.12.278
Copyright: © 2025 Abate TW, et al. This is an open-access article distributed under the terms of the Creative Commons Attribution License, which permits unrestricted use, distribution and reproduction in any medium, provided the original author and source are credited.