Journal of Chemical Engineering & Process Technology
Open Access
ISSN: 2157-7048
ISSN: 2157-7048
Research Article - (2023)Volume 14, Issue 1
The reactive distillation is very important unit. The main objective of this research was to improve the controller performance of the reactive distillation unit. The theoretical study was made to represent the production of methyl acetate by the liquid phase reaction of acetic acid and methanol throughout reactive distillation and the simulation study was performed by using Matlab-Simulink. The model estimates the liquid and vapor composition profiles on each tray and in the reboiler and condenser, the temperature of each tray, and the liquid and vapor flow rates on each tray as well as the distillate and bottom flow rates. The validity of the proposed model had been evaluated by the comparison with previous works. An analysis steady state study was performed to study the effect of catalyst amount on each tray, the number of reactive trays effect, acetic acid feed tray location effect, and the effect of the operating pressure of the column.
Reactive distillation; Mathematical model; Simulation study; Operating pressure; Distillation unit
Reactive distillation is the operation that combines reaction and distillation within a single integrated process unit. It is one of the most important industrial applications of the multifunctional reactor concept. Only a single column is required for the process alternative of a reactor followed by a number of distillation columns, so, both capital investment and energy costs are minimized. As advantages, for example, of this combination are: Chemical equilibrium limitations can be overcome in this technique, a higher selectivity towards the desired product may be achieved, and zoetrope or closely boiling temperatures mixtures can be more easily separated than in conventional distillation process [1]. Increasing the efficiency and reducing the operational cost are also direct advantages of this combination. The reactive distillation process improves the conversion for reversible reactions by continuous withdrawn of the products from reaction zone which causes the equilibrium conversion to move towards the product side. The removal of the products from the reactive zone improves selectivity for desired products by preventing these (products) from undergoing further reactions to byproducts [2]. As another benefit is the heat integration due to heat generation by chemical reaction for exothermic reactions which can be directly utilized to vaporize liquid results in reduction in energy requirements for reboiler duty. However, reactive distillation is not extensively used in the chemical processes industries since its operation is more difficult and poses higher requirements on the quality of the design and control than conventional flowsheet in which a reactor is typically followed by a train of distillation columns [3]. It is important to mention here that the development, design and operation of RD processes are highly complex tasks. Furthermore, the number of design variables for such an integrated unit is much higher than the overall design degrees of freedom of separate reaction and separation units [4].
Due to the interaction between reaction and separation in one single unit, the steady state and dynamic behavior of RD column can be very complex. Olanrewaju and Al-Arfaj [5] studied the impact of disturbance magnitudes and directions on the dynamic behavior of a generic reactive distillation. They showed that using an excess amount of the heavy reactant slightly increased the rate of product formation but when the step direction was inverted it had a severe impact on the system and the system was driven to an unstable operation. Kumar and Kaistha [6] studied the dynamics and control of ideal and methyl acetate systems. They investigated the effect of reboiler duty on the temperature and conversion in different reactive trays for fixed reflux flowrate and fixed reflux ratio. For a fixed reflux ratio the reactive temperatures did not show output multiplicities.
The objectives of this work are to develop the dynamic model of reactive distillation column for the production of methyl acetate. It estimates steady state liquid and vapor composition profiles, steady state temperature profile, liquid and vapor flowrates inside the column, reaction profile for reactive trays, bottom and distillate flowrate. This is done by solving the MESH equations of RD by EQ stage model. It also includes the establish of a dynamic simulation model for the solution of the model equations, for the open loop dynamic studies, and control studies by using Matlab/Simulink. The dynamic model of the RD column is tested by using disturbances to the system by the reflux ratio, the two feeds flowrates, the feeds compositions, and the reboiler heat duty.
Mathematical modelling of reactive distillation
In the present study, the set of the ordinary differential and algebraic equations that describe the system are solved numerically. The unsteady state mass balance equations of the components were integrated numerically to get the steady state composition profile inside the column. The energy balance equations are used for calculating vapor flow rates on each stage. The steady state total material balance equations are used to calculate the liquid flow rates on each stage. The temperatures of the column on each tray and vapor composition are calculated using bubble point iteration. Figure 1 shows a reactive distillation column for Methyl Acetate (MeOAc) production by the liquid phase reaction of Acetic Acid (AcAc) and Methanol (MetOH) where the acid, heavier reactant, is introduced at the top and alcohol, lighter reactant, is introduced at the bottom.

Figure 1: Reactive distillation column of methyl acetate production.
In this simulation study, the column is modeled as a tray column and some assumptions are made. The dynamic model is made to meet all the assumptions. The vapor and liquid on each tray and the vapor and liquid leaving the tray are perfectly mixed and always in thermodynamic equilibrium with each other. The condenser and the reboiler are treated as equilibrium stages. The condenser is assumed of total condensation type while reboiler is assumed partial vaporization. Heat balance equations are assumed at steady state [7]. The vapor molar hold up is assumed negligible in comparison with the liquid molar hold up. Reaction proceeds only in the liquid phase. The liquid on each tray has the same composition with the liquid leaving the tray. The vapor phase is assumed ideal for all the components in the mixture. The operating pressure of the system is the atmospheric pressure and the differences in pressure along the column are assumed negligible. However, the first assumption is reasonable for all small and medium diameter columns where the liquid on each tray is mixed with the flowing vapor leaving the tray but this assumption is not valid for the large diameter columns. The fifth assumption related about the neglected vapor hold up is reasonable for the columns working under atmospheric pressure. In this case, the liquid density on each tray is much higher than the vapor density. Those assumptions above will lead to a model that consists of a set of ordinary and algebraic equations describing the system on each stage in the column [8].
In the present study, the trays are numbered from top down. So, the condenser is assumed to be tray number 1 and the reboiler is assumed to be tray number NT.
Material balance
Material balance around condenser.
• Total material balance.
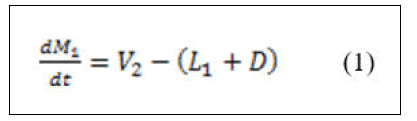
• Component material balance.
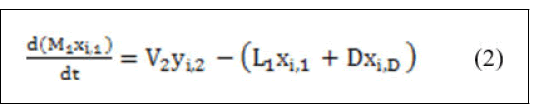
Derivation of the left hand side of equation (2) for both variables yields:
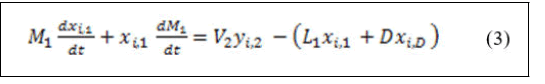
Substitution of equation (1) in equation (3) yields:
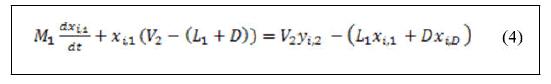
Rearranging equation (4) yields:
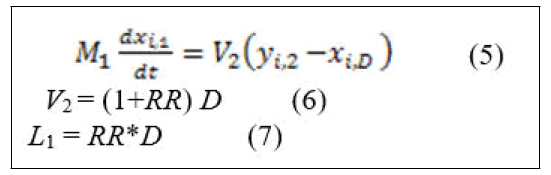
The assumption of constant liquid hold up in equation (1).
Would also give equation (5) since the assumption of total condensation results in the same composition of the distillate and reflux and equation (6) will be obtained.
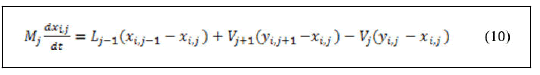
Material balance around rectifying and stripping trays.
• Total material balance.
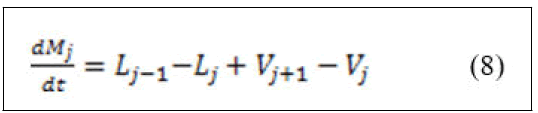
• Components material balance.
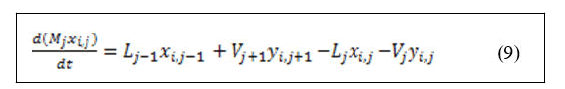
Derivation of left hand side of equation (9) and substitution of equation (8) yields:
Material balance around feed trays.
• Total material balance.
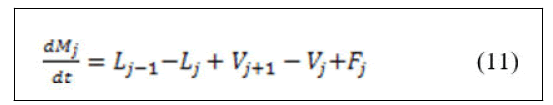
• Components material balance.
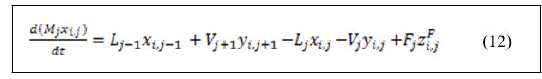
Derivation of the left hand side of equation (12) and substitution of equation (11) yields:
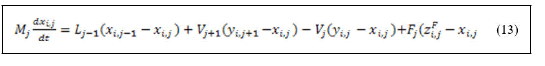
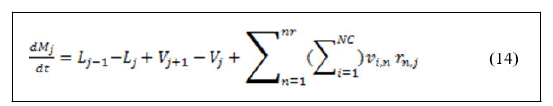
Equation (13) represents a general form of material balance around feed trays. When the feed trays are inside the reactive zone the reaction term should be added to equation (13).
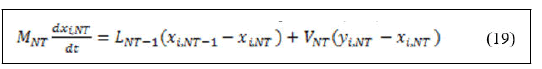
Material balance around reactive trays.
• Total material balance.
• Components material balance.
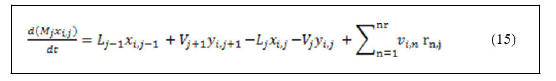
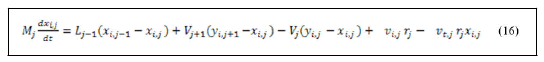
Derivation of left hand side of equation (15) and substitution of equation (14) with reaction rate and stoichiometric coefficients summation yields:
Material balance around reboiler.
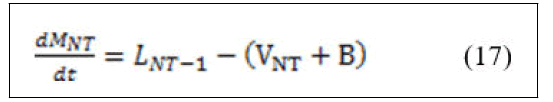
• Total material balance.
• Component material balance.
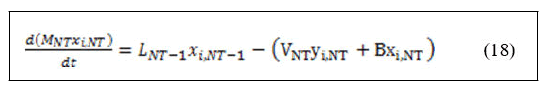
Derivation of left hand side of equation (3.18) and substitution of equation (17) yields:
The definitions of all the variables that appeared in the material balance equations are as follows:
NT: Total number of trays
NC: Total number of components
RR: Reflux ratio
nr: Total number of reactions
j: Index of trays number j= 1...NT
i: Index of components number i=1...NC
n: Index of reaction number n = 1…nr
D: Distillate flowrate
B: Bottom flowrate
Lj: Liquid flowrate of tray j
Vj: Vapor flowrate of tray j
Fj: Feed flowrate to tray j
M1: Hold up of condenser
Mj: Hold up of tray j
MNT: Hold up of reboiler
ri,j: Reaction rate of component i on tray j
rj: Total reaction rate on tray j
xi,j: Liquid mole fraction of component i on tray j
yi,j: Vapor mole fraction of component i on tray j
ZFi,j: Feed mole fraction of component i on tray j
νi,j: Stoichiometric coefficient of component i on tray j
νt: Total stoichiometric coefficients
Energy balance
• Energy balance around condenser.
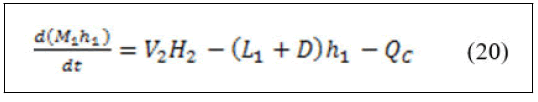
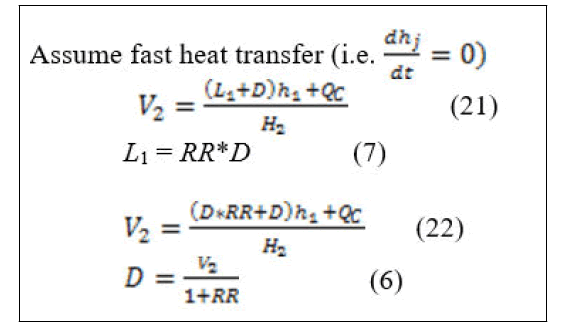
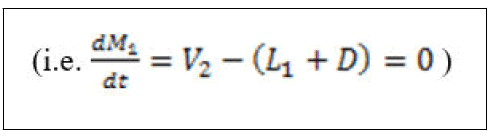
Equations (22) and (6) can be simultaneously solved as algebraic loop in Matlab-Simulink.
• Energy balance around stripping and rectifying trays.
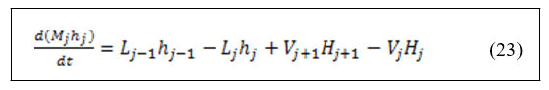
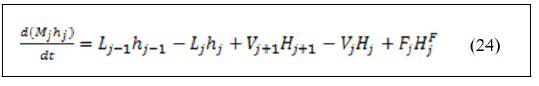
• Energy balance around feed trays.
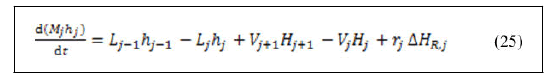
• Energy balance around reactive trays.
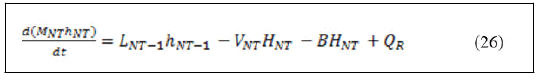
• Energy balance around reboiler.
However, an overall energy balance equation that combines the reactive trays, the stripping trays, the rectifying trays and the feed trays can be constructed from the above equations as follows:
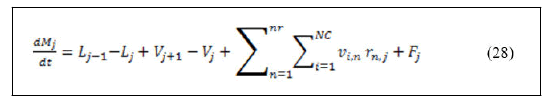
An overall total material balance equation around these trays would give the following equation:
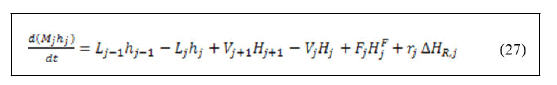
When equation (27) left hand side is derived for both variables, the resulted equation is:
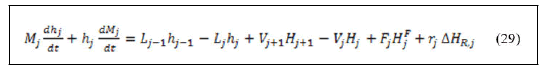
Substitution of equation (28) in equation (29) and rearranging gives:
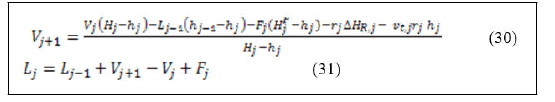
Equation (30) is used to calculate the vapor flowrates for j=2...NT-2. V2 (vapor flowrate entering the condenser) is calculated from equation (22) depending on reflux ratio and distillate rate [9]. Moreover, reflux flowrate can also be calculated depending on reflux ratio and distillate rate. Liquid flowrates can be calculated from equation (31) since the reaction rate has no effect on the total material balance equations because the total summation of the stoichiometric coefficients is equal to zero [10].
For trays where no reaction is proceeding are set equal to zero in equation (30). For trays where no feed is introduced Fj is set equal to zero in equation (31).
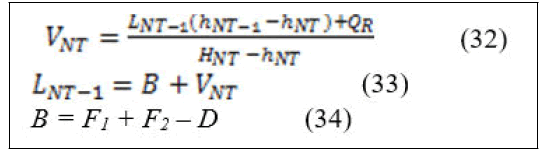
From the total energy and material balance around reboiler the vapor boil up in the reboiler and the liquid enters the reboiler can be calculated according to the following equations after derivation and arrangement [11].
Definitions of all the variables that appeared in the energy balance equations are below:
F1: Acetic acid feed flowrate
F2: Methanol feed flowrate
Hj: Vapor enthalpy of tray j
hj: Liquid enthalpy of tray j
HFj: Feed enthalpy of tray j
LNT-1: Liquid flowrate enters the reboiler
QC: Condenser duty
QR: Reboiler duty
ΔHR,j: Heat of reaction on tray j
VNT: Vapor boils up in the reboiler
Vapor liquid equilibrium equations
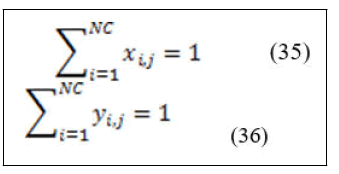
The summation of the liquid and vapor mole fractions are as follow:
In general, equilibrium is a static condition that no changes occur in macroscopic properties of the system with time. The assumption of equilibrium is justified when it leads to results of satisfactory accuracy. For a system consisting of liquid and vapor phases in perfect contact eventually reaches a final state wherein no tendency exists for change to occur within the system. However, the simplest model that describes vapor-liquid equilibrium is Raoult's law. The major assumptions for this model are vapor phase is an ideal gas and liquid phase is an ideal solution. The ideal gas assumption can be applied only for systems operate under low to moderate pressure. Ideal solution behavior is almost approximated by liquid phases wherein the molecular species are not too different in size and are of the same chemical nature.
Although ideal system is simpler to be implemented, it's not accurate especially in representing the liquid phase. This leads to a much more realistic equation representing VLE which is called modified Raoult's law. The mathematical expression of modified Raoult's law results when fugacity coefficient, and activity coefficient, are inserted into Raoult's law to correct the vapor phase and liquid phase non-ideality respectively. The starting point of VLE calculations is:
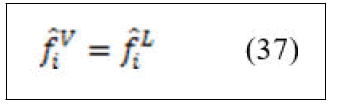
For species i in the vapor mixture
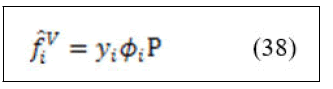
For species i in the liquid mixture
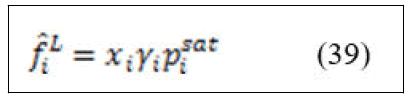
At low to moderate pressure ⌀=1 then equation (37) can be written in the form of
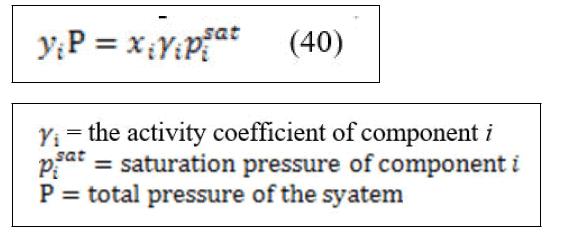
Equation (40) is known as modified Raoult's law and often used for bubble point calculations. Inserting activity coefficients makes the calculations little more complex than the same calculations made with Raoult's law. The activity coefficients are functions of temperature and liquid phase mole fraction. There are many empirical correlations used to predict the liquid phase non-ideality via activity coefficients. Wilson equation is one of the correlations that are often used to describe VLE and is used in this study.
Simulation work
The design and simulation of reactive distillation operations are very different types of calculations and calling for very different approaches. However, the design of RD distillation is almost performed by the use of steady state EQ stage modeling and fewer studies dealt with the dynamic EQ stage model. The rate based model, on the other hand, is less used. The difficulty of estimation of the liquid vapor interface mass and heat transfer parameters makes it hard to be implemented. So, most of the literatures dealt with the rate based type take the steady results of EQ stage model as initial conditions to get a convergence towards a solution. The simulation is performed with specified states of feeds and all the design parameters such as reflux ratio, heat duties, stages number, catalyst load, and column pressure are specified. Thus in this study all the design parameters are specified and the dynamic simulation is run to calculate the composition profiles on each tray, the temperature on each tray, and the bottom and top flowrates as well as the liquid and vapor flowrates inside the column. In the present study, the set of the ordinary differential and algebraic equations that describe the system are solved numerically. The unsteady state mass balance equations of the components were integrated numerically to get the steady state composition profile inside the column. The energy balance equations are used for calculating vapor flow rates on each stage. The steady state total material balance equations are used to calculate the liquid flow rates on each stage. The temperatures of the column on each tray and vapor composition are calculated using bubble point iteration. Figure 1 shows a RD column for MeOAc production by the liquid phase reaction of acetic acid and methanol where the acid, heavier reactant, is introduced at the top and alcohol, lighter reactant, is introduced at the bottom.
We will consider here a simple tray equations to be solved by Matlab-Simulink, which is the tray number 1 (condenser), and all the other trays can be constructed in the same way including the necessary differences. Figure 2 represents the subsystem of tray 1. The complete constructed tray is shown in Figure 3 where bubble point iteration is used to calculate temperature. The Sfunction has five inputs represented in the liquid mole fraction of four components and total pressure of the system and five outputs represented in the vapor mole fraction of the four components and temperature of the tray.

Figure 2: Simulink blocks of tray 1 (Condenser) subsystem.
Some definitions of the blocks appear in Figure 3 are as follows: "tray1 (condenser)" represents the material balance equations around condenser represented in equation (5). Its unconnected ports represent the vapor mole fraction coming from tray 2 (i.e. Y12, Y22, Y32, Y42), which is not presented here. The subsystem of "tray1 (condenser) “is as shown in Figure 2. "Energy balance around condenser" block represents energy equations for liquid energy balance around condenser with the inputs liquid mole fraction and temperature and enthalpy calculation were performed in subsystem to calculate h1. "Calculation of V2" block represents the calculation of V2 from equation (22). The unconnected port (H2) is the vapor enthalpy resulted from vapor energy balance around tray 2. "Calculation of D" block represents the calculation of D from equation (6). "Calculation of L1" block represents the calculation of L1 from equation (7). "S-function for bubble temperature" block represents the calculation of the bubble point temperature around condenser and on each tray.
However, the bubble point technique is the only single method available in the open literature for condenser temperature calculations.
Figure 3 does not show the complete description of the Simulink model as it was implemented to the program since signals from liquid mole fraction of condenser should be inputs in tray 2, but because tray 2 is not shown here; these connections are also not shown. Signals of vapor mole fraction from tray 2 and they are inputs to tray 1 are also not connected.
When the Simulink model is completed, it looked like a huge block with complicated connections but in fact, it can be easily constructed when each stage is constructed individually and the Simulink model is gradually built. Figure 3 represents all the energy balance equations, summation equations, equilibrium equations, and material balance equations around condenser as a Simulink model.
All the remaining trays are constructed in the same manner depending on the energy and material balance equations on each tray. For the reactive trays, a subsystem in each tray was constructed to calculate reaction rate depending on activities, temperature of the tray, and liquid mole fraction. The heat of reaction is added to the total energy balance equations.
For all the open loop dynamic studies and closed loop control studies, all the integrators are initialized with steady state liquid mole fraction. From the above we can illustrate the steps of simulation as follows:
• Step 1: Initializing liquid mole fraction for one component at least on each tray. This step is made by the user after the Simulink model is constructed and all the following steps are made automatically by the program until a steady state is achieved.
• Step 2: Calculating vapor mole fraction and temperature on each tray by bubble point iteration.
• Step 3: Calculating liquid and vapor enthalpies on each tray depending on temperature, liquid mole fraction, and vapor mole fraction.
•Step 4:Calculating vapor flowrates on each tray depending on energy balance equations and liquid flowrates depending on total material balance equations and reaction rates in reactive trays depending on temperature and liquid mole fraction.
•Step 5: Integrating the unsteady state composition equations in, condenser, trays, and reboiler depending on the calculated vapor flowrate, liquid flowrate, and reaction rate on each tray.
• Step 6: Repeating steps 2-5 until a steady state is achieved.
• Step 7: Stop simulation.
As a convergence criterion for the steady state reaching, the program continues until the specified value of the relative error tolerance is achieved. The relative error tolerance can be specified in the configuration parameters of the Simulink model.

Figure 3: Simulink block of tray 1 (Condenser).
Table 1 illustrates the steady state operating conditions of MeOAc RD system. The two feeds are introduced at their bubble point temperature.
In this work, the steady state analysis included the effect of catalyst holdup, effect of number of reactive trays, effect of column pressure, and effect of acetic acid feed tray locations. The study depended on running the dynamic simulation after change introducing in the model parameter and investigating how the process affected by this change after steady state is reached.
| Total number of trays including condenser and reboiler | 40 |
| Number of trays in stripping section (NS) | 3 |
| Number of trays in reactive section (Nrxn) | 34 from (3-36) counted from top down |
| Number of trays in rectifying section (NR) | 1 |
| Acetic acid feed tray from the top including condenser | 4 |
| Methanol feed tray from the top including condenser | 27 |
| Reflux ratio | 1.966 |
| Acetic acid feed flowrate (kmol/hr) | 50 |
| Methanol feed flowrate (kmol/hr) | 50 |
| Condenser duty (kW) | -1280.22 |
| Reboiler duty (kW) | 1035.71 |
| Mass of catalyst on each reactive tray (kg) | 29.5 |
| Operating pressure of the column (atm) | 1 |
| Diameter of the column (m) | 1.03 |
Table 1: Steady state operating conditions for MeOAc RD system Tang, et al.
The validity of the present simulation work
In this study, the production of methyl acetate (MeOAc) and water from the reversible reaction of acetic (AcAc) and methanol (MetOH) is simulated. The system consists of 40 trays including condenser and reboiler and they are numbered from top to down. The heavy reactant AcAc is introduced at tray 4 and the light reactant MetOH is introduced at tray 27. The light product MeOAc is withdrawn from the top and heavy product water is withdrawn from the bottom. The fresh feed flowrates of pure acetic acid and methanol are 50 kmol/hr. For this design, both reactants are introduced inside the reactive section not at the top or the bottom of it.
Figures 4 and 5 show the steady state liquid molar composition and temperature profiles respectively on each tray for the present work, and Kaymak and Luyben work. Comparison of the distillate and bottom values between the two studies is shown in Table 2.
Table 2 shows that distillate values of the present work are in good agreements with Kaymac and Luyben work while there is a significant difference in reboiler temperature between the two studies.
Figures 4 and 5 show that the liquid mole fraction of the distillate and bottom are in good agreements with those of Kaymac and Luyben but there is a noticeable difference of liquid composition and temperature profiles along the column between the two studies. However, the simulation of Kaymac and Luyben was performed in Aspen Plus and the simulation of Aspen Plus and Matlab are quite different. Aspen Plus has built in equations of state and predefined models, which are not available at Matlab. This makes the simplification assumptions tolerable matter in simulation by Matlab and this has its effects on results. This also may be due to using different VLE model or reaction rate expression.
Figure 4 shows that along the reactive section, the AcAc and MetOH have moderate concentrations but they are prevented from leaving out from the top or the bottom of the column by the rectifying and stripping sections. The concentration of AcAc stays almost constant in the reactive section above MetOH feed tray then drops down significantly near MetOH feed tray because of the continuous consumption of AcAc by MetOH. Keeping the concentration of MetOH higher around the lower feed tray is essential to consume all AcAc before it reaches to the bottom of the column, since AcAc is heavier than the heavy product water. Therefore, any unreacted AcAc near the base will leave from the bottom. The composition profiles of Figure 4 indicating that we are primarily separating AcAc and MeOAc in the rectifying section. It also shows that we are stripping MetOH from water in the stripping section and returning it to reactive zone. This clearly shows the advantages of reactive distillation. As the acid moves towards the lower part of the reactive section, it consumes all the alcohol in the way.
The reaction rate profile is shown in Figure 6. Reaction rate represents the production of methyl acetate and it is the same for water since their stoichiometric coefficients are the same. Acetic acid and methanol reaction rates also have this same magnitude with negative signs. Figure 6 shows that the upper part of the reactive section slightly contributes in reaction. Reactive trays in the upper part of reactive section seem to serve for the purpose of separation rather than reaction and most of the reaction occurs in the middle part of reactive section. The first reactive tray has a negative sign reaction rate; a reasonable analysis is that because of the accumulation reflux methyl acetate in the upper part, leads to that the system cannot separate the mixture and this drives the reaction to the opposite direction (Figures 4-6). This indication is in a good agreement with that of Luyben and Yu (Table 2).

Figure 4: The profile of liquid phase composition at steady state.

Figure 5: The profile of temperature at steady state.
| Distillate values | Bottom values | ||||
|---|---|---|---|---|---|
| Present work | Kaymak and Luyben work | %Dev. | Present work | Kaymak and Luyben work | %Dev. |
| XAcAc=0.02035 | XAcAc=0.01237 | 64.5 | XAcAc=0.002642 | XAcA=0.00087 | 203.7 |
| XMetOH=0.01552 | XMetOH=0.00763 | 103.4 | XMetOH=0.007464 | XMetOH=0.00556 | 34.24 |
| XMeOAc=0 | XMeOAc=0 | 0 | XMeOAc=0.9768 | XMeOAc= 0.98 | -0.32 |
| XH2O=0.96413 | XH2O=0.98 | -1.61 | XH2O=0.013094 | XH2O=0.01357 | -3.5 |
| B=49.99(kmol/hr) | B=49.65(kmol/hr) | 0.684 | D=50.01(kmol/hr) | D=50.35(kmol/hr) | -0.6 |
| Treb.=370.53 K | Treb.=378 K | -1.97 | Tcond.=329.7 K | Tcond.=330 K | -0.09 |
Table 2: Comparison of distillate and bottom values of present work and Kaymac and Luyben 2006 work at steady state.

Figure 6: The profile of reaction rate at steady state.
Effect of catalyst weight
Subheadings follow the number of the main heading above it. They should follow the numerical sequences which they fall under. Figure 7 shows the influence of catalyst weight on MeOAc purity at distillate. The amounts of catalyst that were used in the runs have the values of (10 Kg, 20 Kg, 30 Kg and 40 Kg per tray).
In each run, the amount of the catalyst is changed and the simulation is done until steady state is reached. If more catalyst is used on each tray, MeOAc purity at distillate is higher. This indicates that the conversion is higher. However, the increase in purity is not significant and it is only slightly increases even with increasing the amount of catalyst from its base case value to 40 Kg per tray. Increasing the amount of catalyst needs special construction operations; this is to fix the catalyst particles in the reaction zone. This leads to construction and operation problems in addition to cost increase, for no significant increase in purity. Therefore, it is not helpful to increase catalyst amount in reactive trays.
Effect of operating pressure
The effect of the pressure is studied by changing the operating pressure of the column from 1 atm to 2 atm with interval of 0.2 atm for each run.
The effect of pressure on purity is shown in Figure 8. Unlike conventional distillation, column pressure is more critical in reactive distillation. This is because of its direct effect on temperature in reactive section. A low pressure reduces the temperature in the reactive section and thus reducing the reaction rate. At high pressure, there is high temperature in the reactive section and thus high reaction rate. Figure 7 shows the opposite, a reduction in purity at high pressure. This is because high temperature encourages reverse reaction and results in low conversion because the forward reaction is exothermic. Thus, the product purity decreases because less product is generated in the reactive zone.

Figure 7: Effect of catalyst holdup on MeOAc purity at distillate.

Figure 8: Effect of pressure on MeOAc purity at distillate.
Effect of number of reactive trays
The impact of eliminating reactive trays was studied and it is shown in Table 2. The total number of trays is kept constant and every eliminated reactive tray is converted into stripping one. The results further improve the indication of Figure 6. Even when the first 13 reactive trays are converted into stripping trays, this has no significant effect on concentrations of distillate and bottom. The reactive trays in the upper part of reactive section are used for separation and their elimination has no significant impact on purities.
It is obvious that changing reactive trays into stripping trays in this part of reactive section can reduce catalyst cost and keeping concentrations in an acceptable range. However, when more than 19 reactive trays are converted into stripping trays, this has unacceptable effect on the distillate and bottom concentrations. As more trays that are reactive are converted into stripping trays, the concentration of MetOH increase at distillate and the concentration of AcAc increases at bottom. This is because the number of reactive trays is not enough to drive the reaction to completion. When unreacted MetOH escapes from reactive zone, it will be separated at the top because it is the lighter reactant. Moreover, when the reactive section does not consume all the acid it will be withdrawn from the bottom because it is heavier than the heavy product.
Effect of acetic acid feed tray location
The effect of acid feed tray location changing is studied and it is shown in Table 3. At the base case the acid was introduced at tray 4 counted from the top. Introducing the acid at trays 5, 6, or 7 has no significant effect on purities at distillate and bottom. This is because the upper part of reactive section has no major contribution in reaction. When the acid is introduced at lower parts, trays 16 and 17, there is a decrease in the distillate and bottom purities. This is because the acid is heavier than the heavy product water. Therefore, any reactive tray above feed tray will not participate in reaction and therefore less product is generated. As a result, the purities of the products at distillate and bottom decrease (Tables 3 and 4).
| NS/NRX/NR | 2/33/3 | 3/32/3 | 4/31/3 | 5/30/3 | 12/21/3 | 20/15/3 | NS/NRX/NR |
|---|---|---|---|---|---|---|---|
| Distillate (mole fraction) | |||||||
| AcAc | 0.003048 | 0.0026 | 0.0026 | 0.0026 | 0.0025 | 0.0019 | 0.0006 |
| MetOH | 0.006782 | 0.0076 | 0.0085 | 0.0095 | 0.03 | 0.1925 | 0.3591 |
| MeOAc | 0.9769 | 0.9767 | 0.9765 | 0.9762 | 0.9613 | 0.8942 | 0.6402 |
| H2O | 0.01327 | 0.0131 | 0.0124 | 0.0117 | 0.0062 | 0.0014 | 0.0001 |
| Bottom (mole fraction) | |||||||
| AcAc | 0.0203 | 0.0204 | 0.0206 | 0.0208 | 0.0369 | 0.1099 | 0.367 |
| MetOH | 0.0162 | 0.0154 | 0.0147 | 0.0139 | 0.0094 | 0.0108 | 0.0293 |
| MeOAc | 0 | 0 | 0 | 0 | 0 | 0 | 0.0001 |
| H2O | 0.9635 | 0.9642 | 0.9647 | 0.9653 | 0.9537 | 0.8793 | 0.6036 |
Table 3: Effect of changing reactive trays on purities of distillate and bottom.
| Acetic acid feed tray location | XD,MeOAc (mole fraction) | XB,H2O (mole fraction) |
|---|---|---|
| 5 | 0.977 | 0.9667 |
| 6 | 0.975 | 0.9656 |
| 7 | 0.9737 | 0.9635 |
| 16 | 0.9322 | 0.9118 |
| 17 | 0.9222 | 0.8995 |
Table 4: Effect of acetic acid feed tray location on purities of distillate and bottom.
The conclusions are illustrated for this study regarding to the steady state analysis, the dynamic behavior and the closed performance of the reactive distillation column for methyl acetate production. The steady state analysis showed the possibility of keeping the purities of the products at the distillate and bottom at an acceptable range even when some reactive trays in the upper part of the column are converted into stripping trays. However, when reactive trays in the lower part of the column are converted into stripping trays, this had a significant effect on purities. Increasing the catalyst holdup on each reactive tray had not shown any advantage when increased from its base case value. The upper part of the methyl acetate reactive distillation column seemed to work for the purpose of separation rather than reaction. Open loop performance of the column showed that in most cases the purities of the products at distillate and bottom as well as the condenser and reboiler temperature can be described as a first order system with a very small time delay. Negative step change in reflux ratio of -5% had nearly no effect on the purity of the methyl acetate at distillate but for -10% step change, this caused a significant decrease in methyl acetate purity at distillate.
The author wishes to acknowledge and thank Tikrit University for their financial support of this research. Thanks are also extended to chemical engineering department staff for technical assistance, advice and for the all facilities.
Citation: Ahmed DF, Homoud AT (2023) Dynamic Simulation of Catalyzed Esterification of Methanol and Acetic Acid in Reactive Distillation Column. J Chem Eng Process Technol. 14:314.
Received: 29-Oct-2022, Manuscript No. JCEPT-22-19887; Editor assigned: 31-Oct-2022, Pre QC No. JCEPT-22-19887 (PQ); Reviewed: 14-Nov-2022, QC No. JCEPT-22-19887; Revised: 25-Jan-2023, Manuscript No. JCEPT-22-19887 (R); Published: 01-Feb-2023 , DOI: 10.4172/2157-7048.23.14.314
Copyright: © 2023 Ahmed DF, et al. This is an open-access article distributed under the terms of the Creative Commons Attribution License, which permits unrestricted use, distribution, and reproduction in any medium, provided the original author and source are credited.