Journal of Medical Diagnostic Methods
Open Access
ISSN: 2168-9784
ISSN: 2168-9784
Review Article - (2017) Volume 6, Issue 2
Accurate diagnosis is the prerequisite for effective treatment of diseases. Various biostatistics indices have been used to evaluate the performance of diagnostic tests. The distribution of test results commonly shows a relatively fixed overlap between the diseased and non-diseased populations, and the two main properties of laboratory tests sensitivity (Se) and specificity (Sp) usually demonstrate an inverse relationship of each other. An inverse relationship is also seen in the two sides of a right triangle where the hypotenuse serves as an integrated functional index of the two sides, as reflected in the geometric equation Pythagorean Theorem (PT). We have developed a novel test performance index named diagnostic availability (DA) based on the theory of PT, which integrates and reflects the combined efficiency of Se and Sp. When Se and Sp were changing inversely as seen in the vast majority of clinical settings, DA was superior to the other indices diagnostic efficiency (DE), Youden index, and Kappa coefficient (К) in reflecting the overall test performance of a test. It was also the only one responsive to the reciprocal changes of Se and Sp. Therefore, we propose the additional consideration of DA besides Se and Sp during the determination of the optimal test result cut-off point. In the rare scenarios that Se and Sp are changing in the same direction, DA, J and К outperforms DE in reflecting test performance. Furthermore, DA can also help identify the better test when two tests exhibit similar areas under the curve (AUC) in the receiver operating characteristic curve (ROC) analysis. In conclusion, DA is a novel index for overall performance evaluation of diagnostic tests reflecting the combined efficiency of Se and Sp. It shows superiority over other commonly used indices in the assessment of overall test performance and serves as a valuable addition to the existing indices.
Keywords: Diagnostic test; Sensitivity, Specificity, Diagnostic efficiency; Youden index; Kappa coefficient; Receiver operating characteristic curve
Before clinical implementation of a new laboratory test, its performance should be carefully evaluated given the significant impact on disease diagnosis and subsequent medical intervention. There are multiple biostatistical indices assessing different facets of diagnostic tests. The common ones include sensitivity (Se), specificity (Sp), and other more global measurements of laboratory test performance such as diagnostic efficiency (DE), Youden index, Kappa coefficient (К), and receiver operating ch aracteristic curve (ROC). Pythagorean Theorem (PT) is widely used in medical imaging to precisely locate lesions and guide interventional procedures. However, its usage in biostatistics is limited. Herein, we introduce the application of the PT (PT) theory in the integrative evaluation of diagnostic test performance, and propose the novel index of PT-derived diagnostic availability (DA).
Basic properties and other evaluation indices of diagnostic tests
Sensitivity and specificity
Each diagnostic test has two basic properties: Se and Sp, used to evaluate the ability of a laboratory test to correctly identify individuals as diseased or disease-free [1-5]. A gold standard method is used to definitively classify each individual into these 2 categories. An exemplary laboratory test result is illustrated in Table 1. Se is the percentage of diseased individuals correctly identified by the test as such. Sp is the percentage of disease-free individual corrected identified by the test as such. Se and Sp are expressed by the following equations:
| Parameters | Patients with disease | Patients without disease | Total |
|---|---|---|---|
| Test positive | a | b | a+b |
| Test negative | b | d | c+d |
| Total | a+c | b+d | a+b+c+d=N |
Table 1: Results of a diagnostic test in a 2 × 2 table.
Se=a/(a+c) (1)
Sp=d/(b+d) (2)
Other Evaluation indices of diagnostic tests: 1. Diagnostic efficiency (DE): also termed accuracy [6-8]. It is the percentage of individuals correctly classified by test results as being either positive or negative for the disease. DE is expressed by the following equation:
DE=(a+d)/N (3)
DE ranges from 0 to 1 and is the same as diagnostic accuracy.
2. Youden index (J) [9-11]: reflects the validity of a laboratory test through subtracting the false-positive rate and false-negative rate from 1 [10-12]. J is expressed as follows:
J=1-(1-Sp)-(1-Se) (4)
=Se+Sp-1
J ranges from –1 to 1 and the test validity is generally ranked as follows: perfect, 1; excellent, 0.9-1; good, 0.8-0.9; moderate, 0.6-0.8; fair, 0.4-0.6; slight, 0.2-0.4; and useless, 0-0.2. A negative value indicates an invalid test.
3. Kappa coefficient (К) is a concordance (agreement) measurement adjusted for what would be expected by chance [12-15]. It can be used to describe inter-observer agreement, replicate measurement agreement, and to determine concordance between a new test and the gold standard test. Po and Pe represent the proportion of agreement observed and proportion of agreement expected by chance, respectively. К can be calculated as follows:
К=(Po–Pe)/(1–Pe) (5)
From Table 1, Po and Pe can be calculated according to the following equations:
Po=(a+d)/N (6)
Pe=[(a+b) (a+c)+(b+d ) (c+d)]/N2 (7)
К ranges from –1 to 1 and concordance is rated as follows: agreement no better than by chance, 0; Slight agreement: 0.0-0.2; Fair agreement: 0.21-0.40; Moderate agreement: 0.41-0.60; Good agreement: 0.61-0.80; Excellent agreement: 0.81-0.99 and Perfect agreement: 1. A negative value indicates systemic inconsistency.
4. Receiver operating characteristic (ROC) curve: ROC curve is created by plotting the false negative rate (1-Sp) on x axis and true positive rate (Se) on y axis at various test result threshold settings (cutoff points) [15-17]. The key index for evaluating ROC curve is area under the curve (AUC). AUC usually ranges from 0.5 to 1.0. An AUC of 1 indicates a perfect test that correctly differentiates all the diseased and disease-free individuals. It happens when the test result distribution does not overlap between the two populations. An AUC of 0.5 mean chance differentiation of the two populations. In general, AUC is rated as Excellent: 0.9-1.0; Good: 0.8-0.9; Fair: 0.70-0.8; Poor: 0.6-0.7 and Fail: <0.6.
Relationship between Se and Sp in diagnostic tests
The distribution of laboratory test results usually show some degree of overlap between the diseased and non-diseased populations (Figure 1), attributable to individual differences, etiological multiplicity, pathogenesis variance and disease heterogeneity, although rare exceptions do exist (eg, certain heavy metal toxicities, monogenetic hereditary diseases). Depending on where the result cutoff line is drawn, an inverse relationship exists between the true-positives (a) and false-negatives (c) as well as true-negatives (d) and false-positives (b), resulting in a reciprocally inverse relationship between Se and Sp. As shown in Figure 1, when the cut-off line is shifted to line 2, more diseased patients will be tested positive resulting in an increased sensitivity. However at the same time, more disease-free patients will also be tested positive due to the lowered cut-off value, rendering an decreased specificity. Vice versa, when the cut-off is shifted to line 3, a sensitivity decrease and specificity increase ensues.

Figure 1: The result distributions of a diagnostic test between the individuals with and without the disease. 1,2,3 represent three different cut-off thresholds. When the cut-off point is at 1, a is true positive, b false positive, c false negative, d true negative. If the cutoff point is shifted from 1 to 2 or 3, the variances of the amount of a, b, c, d are changed, and they will lead to the reverse changes between Se and Sp, i.e. following the shift of the cut-off point, the change of Se is inversely related with that of Sp.
Pythagorean theorem (pt) and the novel index of diagnostic availability (da)
The basic concept of PT
PT states that in a right triangle, the sum of the squares of the two sides (a, b) equals the square of the hypotenuse (c). Thus, Pythagorean equation is expressed as follows:
a2+b2=c2 (8)
It can be expressed in another form:
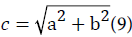
It is evident that there is a functional relationship between the three sides of a right triangle. Under the condition of an established hypotenuse c, the two sides a and b are inversely related. An increase of side would result in a decrease in side b, and vice versa.
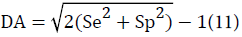
The PT-based novel index diagnostic availability (DA)
PT has been used in medical imaging to help precisely determine the location of lesions and guide interventional procedures [18-20]. However, to our knowledge there has been no report on its utility in the assessment of laboratory diagnostic test. As mentioned above, an inverse relationship is present between Se and Sp in most clinical diagnostic tests, and the two sides of a right triangle also share a similarly inverse relationship as illustrated in the ancient equation of PT. It is therefore reasonable to apply the theory of PT to incorporate the power of Se and Sp in the assessment of diagnostic tests. If Se and Sp are appointed to two sides (a,b) of a right triangle, their integrative efficiency (IE) should be the hypotenuse (c). The IE of a diagnostic test can be expressed as follows:
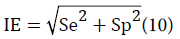
It is well known that if Se and Sp of a test are both 0.5, the test is essentially useless clinically as the disease prediction is no better than chance; if both Se and Sp are 1.0, the test is perfect and accurately identifies the diseased and disease-free populations, although this scenario is unlikely in clinical settings. Taking this information into account and for the convenience of clinical use, instead of using the calculated IE ranging from 0.7 to 1.4, IE was slightly modified so that the value of 1 correspond to a perfect test with a 100% Se and Sp, and the value of 0 correspond to a useless test with a Se and Sp of 50%. This modified IE is named diagnostic availability (DA), ranges from 0 to 1 and expressed as follows:
Comparison of DA with other diagnostic test evaluation indices
Comparison of DA and other indices with inverse Se and Sp changes As mentioned above, there is an inverse relation between Se and Sp in most clinical diagnostic tests. Table 2 lists the changes of Se, Sp, DA, DE, J and К with a gradual decrease of sensitivity with concurrent increase of specificity, starting from a 100% sensitivity and 20% specificity on the far left to a 20% sensitivity and 100% specificity on the far right. It is evident that DA was the only index responsive to the Se and Sp changes and reflected the overall efficiency of Se and Sp. The other indices DE, J and К stayed constant at 0.6, 0.2, and 0.2 despite the Se and Sp changes. The distinct differences seen between the responsive DA and the non-responsive DE, J and К are attributable to the nature that DA is based on a functional calculation that accounts for the reciprocity of Se and Sp, whereas DE, J, and К are determined by arithmetic calculations. Additionally, when the sum of Se and Sp was relatively fixed (especially at values ≤ 1.2), DA was low when Se and Sp were close. However, an increase in either Se or Sp led to a rising DA. This pattern fits the characteristics of a good clinical test performance index, as a test with low Se and Sp is of limited clinical utility whereas a test with either high Se or high Sp is of clinical value. More specifically, a high Se test is useful as a screening assay, and high Sp test is a good confirmatory test [18]. The findings suggest that the determination of an optimal result cut-off point should not only be determined by the maximization of Se and Sp, but also DA, a functional index reflecting the integrative efficiency of Se and Sp.
| a b c d |
10080 020 |
9070 1030 |
8060 2040 |
7050 3050 |
6040 4060 |
5030 5070 |
4020 6080 |
3010 7090 |
200 80100 |
| Se | 1 | 0.9 | 0.8 | 0.7 | 0.6 | 0.5 | 0.4 | 0.3 | 0.2 |
| Sp | 0.2 | 0.3 | 0.4 | 0.5 | 0.6 | 0.7 | 0.8 | 0.9 | 1 |
| DA | 0.442 | 0.342 | 0.265 | 0.217 | 0.200 | 0.217 | 0.265 | 0.342 | 0.442 |
| DE | 0.6 | 0.6 | 0.6 | 0.6 | 0.6 | 0.6 | 0.6 | 0.6 | 0.6 |
| J | 0.2 | 0.2 | 0.2 | 0.2 | 0.2 | 0.2 | 0.2 | 0.2 | 0.2 |
| K | 0.2 | 0.2 | 0.2 | 0.2 | 0.2 | 0.2 | 0.2 | 0.2 | 0.2 |
Table 2: Comparison of DA with DE, J and К with inverse Se and Sp changes.
Comparison of DA and other indexes with unidirectional Se and Sp changes
Although rarely seen in the clinical setting, the occurrence of unidirectional Se and Sp changes cannot be completely excluded, as Se and Sp may be concurrently increased or decreased with technology, platform or reagent changes. Therefore, the comparison of DA with other indices under this condition is also of practical value. Table 3 illustrates the alterations of DA, DE, J and К when Se and Sp gradually decreased from 100%/90% to 0%/0%. During the course of Se and Sp decrease, DA showed decreasing values to that of J and К, explained by the absence of reciprocity of Se and Sp in this scenario. DA, J and К also showed larger dynamic ranges (-1.0 to 1.0) than DE (0-1.0). When both Se and Sp are ≤ 0.5, the values of DA, J and К were zero to negative, appropriately demonstrating the invalid nature of the test. However, the corresponding DE values stayed positive from 0.5 to 0.0, making it less clear-cut than DA, J and К. Overall, DA, J and К outperformed DE in the integrative evaluation of diagnostic tests when Se and Sp changed unidirectionally.
| a b c d |
100 0 0 100 |
90 10 10 90 |
80 20 20 80 |
70 30 30 70 |
60 40 40 60 |
50 50 50 50 |
40 60 60 40 |
30 70 70 30 |
20 80 80 20 |
10 90 0 100 |
90 100 100 0 |
| Se | 1 | 0.9 | 0.8 | 0.7 | 0.6 | 0.5 | 0.4 | 0.3 | 0.2 | 0.1 | 0 |
| Sp | 1 | 0.9 | 0.8 | 0.7 | 0.6 | 0.5 | 0.4 | 0.3 | 0.2 | 0.1 | 0 |
| DA | 1 | 0.8 | 0.6 | 0.4 | 0.2 | 0 | -0.2 | -0.4 | -0.6 | -0.8 | -1 |
| DE | 1 | 0.9 | 0.8 | 0.7 | 0.6 | 0.5 | 0.4 | 0.3 | 0.2 | 0.1 | 0 |
| J | 1 | 0.8 | 0.6 | 0.4 | 0.2 | 0 | -0.2 | -0.4 | -0.6 | -0.8 | -1 |
| K | 1 | 0.8 | 0.6 | 0.4 | 0.2 | 0 | -0.2 | -0.4 | -0.6 | -0.8 | -1 |
Table 3: Comparison of DA with DE, J and К with unidirectional Se and Sp changesDA and the ROC Curve.
ROC curve is a linear analysis in which information is obtained at multiple cut-off points and the AUC is frequently used to compare the performance of different tests. However, the value of the ROC analysis may become limited when two tests show similar AUCs [17,21-23]. In these situations, DA may aids in the further evaluation of the two tests. For example, Safdar et al. reported that serum cystatin C is a useful marker for diagnosis of acute kidney injury in critically ill children [23].
In their study, the AUC of the 0 hour ROC curve and 6 hour ROC were both 0.825. However, DA analysis showed that the 0 hour and 6 hour DAs were 0.366 and 0.555, respectively, suggesting a better performance of the 6 hour measurement. Similarly, serum creatinine measured at 12 hours and 24 hours both showed a AUC of 0.658 in the ROC curve analysis [23], whereas the DA analysis demonstrated a 12 hour DA of 0.295 and 24 hour DA of 0.283. These findings show that DA can provide additional useful information when the AUC of the ROC curves are similar.
When similar or equal AUCs are encountered during ROC curve comparison of two or more tests, we suggest the following steps of DA analysis to help further investigate the performance of tests in evaluation: First, identify the optimal cut-off point at which the sum of Se and Sp is maximal in each test. Second, calculate the DA using the Se and Sp in each test. Third, compare the DA values by statistic method. Lastly, select the better-performing test based on statistic conclusion. In some instances, depending on the desired goal of a test, the DA information can be used in complement with other indices to identify the most suitable test that meet the specific clinical need.
DA values at different Se and Sp combinations and their confidence intervals
The DA values at different Se and Sp combinations are listed in Table 4. The standard error of DA (SeDA) can be estimated with the following equation:
| Se | 1.000 | 0.950 | 0.900 | 0.850 | 0.800 | 0.750 | 0.700 | 0.650 | 0.600 | 0.550 | 0.500 |
| Sp1.00 | 1.000 | 0.951 | 0.903 | 0.856 | 0.811 | 0.811 | 0.768 | 0.726 | 0.649 | 0.614 | 0.581 |
| 0.950 | 0.951 | 0.900 | 0.851 | 0.803 | 0.756 | 0.756 | 0.712 | 0.669 | 0.589 | 0.552 | 0.518 |
| 0.900 | 0.903 | 0.851 | 0.800 | 0.751 | 0.703 | 0.703 | 0.657 | 0.612 | 0.529 | 0.492 | 0.456 |
| 0.850 | 0.856 | 0.803 | 0.750 | 0.700 | 0.651 | 0.651 | 0.603 | 0.557 | 0.471 | 0.432 | 0.395 |
| 0.800 | 0.811 | 0.756 | 0.703 | 0.651 | 0.600 | 0.600 | 0.551 | 0.503 | 0.414 | 0.373 | 0.334 |
| 0.750 | 0.768 | 0.712 | 0.657 | 0.603 | 0.551 | 0.551 | 0.500 | 0.451 | 0.358 | 0.315 | 0.275 |
| 0.700 | 0.726 | 0.669 | 0.612 | 0.557 | 0.503 | 0.503 | 0.451 | 0.400 | 0.304 | 0.259 | 0.217 |
| 0.650 | 0.687 | 0.628 | 0.570 | 0.513 | 0.458 | 0.458 | 0.404 | 0.351 | 0.251 | 0.204 | 0.160 |
| 0.600 | 0.649 | 0.589 | 0.530 | 0.471 | 0.414 | 0.414 | 0.358 | 0.304 | 0.200 | 0.151 | 0.105 |
| 0.550 | 0.614 | 0.552 | 0.492 | 0.432 | 0.373 | 0.373 | 0.315 | 0.259 | 0.151 | 0.100 | 0.051 |
| 0.500 | 0.581 | 0.518 | 0.456 | 0.395 | 0.334 | 0.334 | 0.275 | 0.217 | 0.105 | 0.051 | 0.000 |
| 0.550 | 0.614 | 0.552 | 0.492 | 0.432 | 0.373 | 0.373 | 0.315 | 0.259 | 0.151 | 0.100 | 0.510 |
| 0.500 | 0.581 | 0.518 | 0.456 | 0.395 | 0.334 | 0.334 | 0.275 | 0.217 | 0.105 | 0.105 | 0.000 |
Table 4: DA values with different Se and Sp combinations.
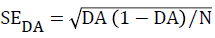
The 95% and 99% confidence intervals (CI95%, CI99%) of DA are calculated as follows:
CI95%,DA=DA ± 1.96 SeDA
CI99%,DA=DA ± 2.58 SeDA
For the test example in Table 5:
| Parameters | Patients with disease | Patients without disease | Total |
|---|---|---|---|
| Test positive | 90 | 24 | 114 |
| Test negative | 10 | 76 | 86 |
| Total | 100 | 100 | 200 |
Table 5: 2 × 2 table of results of an exemplary diagnostic test.
Se=90/(90+10)=90%
Sp=76/(24+76)=76%
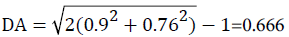

CI95%,DA of DA=0.666 ± 1.96 × 0.033 i.e. (0.601-0.731)
CI99%, DA of DA=0.666 ± 2.58 × 0.033 i.e. (0.581-0.751)
PT is a fundamental law of geometry describing the relationship of the three sides of a right triangle. It has been extensively used in multiple disciplines, particularly engineering. In the medical field, it is mainly applied in imaging to help locate lesions and guide interventional procedures [18-20]. However, its utilization in laboratory medicine is limited to none. Our study for the first time to our knowledge applied PT in the field of laboratory medicine, focusing on the integrative evaluation of laboratory diagnostic test performance, whose importance does not need further elaboration given the impact on the accurate diagnosis and subsequent treatment of diseases. We were able to successfully apply the theory of PT in the development of DA, given the shared inverse relationship between the two sides of a right triangle, and between Se and Sp.
The PT-derived novel index of DA is a functional result of Se and Sp and reflects the combined efficiency of the two, which at the same time also accounts for the reciprocal relationship of Se and Sp that is seen in the vast majority of laboratory diagnostic test. This combined functional relationship sets DA apart from the other test evaluation indices. DE is the accuracy calculated from the true positive and true negative among the total populations and reflects how many individuals are correctly classified by the test. However, disappointingly, it cannot reflect the dynamic inverse changes of Se and Sp with a shifting cut-off line. This feature makes DE a suboptimal index for the overall test performance evaluation, as it fails to differentiate a clinically useless test with a 50% Se and Sp which offers no benefit above chance versus a clinically valid screening test with high Se but low Sp or confirmatory test with high Sp but low Se. The same phenomenon was seen in J and К, which similar to DE, are also arithmetic rather than functional indices. The superiority of DA as an index of overall test performance was also seen in the rare scenario when Se and Sp were changing in the same direction. As a good index of overall test performance, DA aids in the evaluation and selection of diagnostic tests. For example, non-cardiovascular chest pain carries a high healthcare cost, but insufficient clinical guidelines exist for its diagnostic assessment.
In a study looking for improvement of non-cardiovascular chest pain diagnosis, Wertli et al. reported that the responses to high dose proton pump inhibitor (PPI) treatment provides important information for gastroesophageal reflux disorders (GERD) diagnosis, with a posterior mean sensitivity and specificity of 0.89 and 0.88, respectively [24]. The calculated DA of this test is 0.77. At the same time, for an alternative GERD test of provocation test, the posterior mean sensitivity and specificity was 0.53 and 0.93, respectively. Its calculated DA is 0.51.
The different DAs clearly demonstrate the overall better performance of the former in comparison to the provocation test in GERD diagnosis. DA would be particularly helpful when the AUC of ROC curves are similar or equal among tests, a situation when the ROC analysis is of limited value in identifying the better performing test. Although we have demonstrated that the PT-derived DA is a novel index that improves the evaluation of overall performance of diagnostic tests, we do recognize the values of other indices Se, Sp, DE, J and К as each provides unique information that addresses specific aspect of the test performance.
For example, if the goal is to identify the best screening test, then a high Se test is desired and Se would be the determining factor in the evaluation. If the concordance of a new test with a gold standard test is to be assessed, then the concordance index Kappa coefficient (К) should be used as it adjusts for chance. We therefore propose DA as an addition to the current indices to aid in the evaluation of overall performance of diagnostic tests. In conclusion, we have developed a PT-derived, novel index for the integrative evaluation of diagnostic test performance. It reflects the combined efficiency of Se and Sp and takes into account the inverse relationship of these two key properties of diagnostic tests. It aids in the evaluation of the overall performance and selection of diagnostic tests, particularly when similar AUCs are encountered. DA serves as a valuable addition to the existing indices of test performance.