Journal of Geology & Geophysics
Open Access
ISSN: 2381-8719
ISSN: 2381-8719
Research Article - (2021)Volume 10, Issue 7
Edge detection is one of the enhancement procedures in potential data interpretation. A number of edge detection methods can be applied in the interpretation of gravity data, the choice of the method depends on the estimated depth of the anomaly causative body. In this study, edge detection techniques of analytic signal and tilt angle derivative were employed on the delineated real gravity field anomaly of Migori greenstone belt. The choice of the two techniques was informed by the results from power spectral analysis of gravity data, which mapped the anomaly source structures at shallow depths of below 800 m. This was conducted in order to demarcate the boundaries of the productive parts of the greenstone belt.
Gravity field; Anomaly; Source structures; Edge detection; Migori greenstone belt
Gravity technique in mineral exploration
Geophysical methods of gravity and magnetic have evolved from their sole use for mapping basement structures to include a wide range of applications, such as locating intra-sedimentary faults, defining subtle lithological contacts, mapping salt domes in weakly magnetic sediments and better defining targets through 3D inversion [1]. These physical properties can be interpreted in terms of lithology and/or geological processes and their geometric distributions can help delineate geological structures and can be used as an aid to determine mineralization and subsequent drilling target [2].
Magnetic and gravity surveys differ from traditional seismic surveys in that they are passive, rather than aggressive. Instead of causing detonations or pressure waves, they measure variations in the magnetic and gravitational fields of the Earth. Although both can be used for minerals exploration, they have different strengths and weaknesses and often should be used together to give a more complete map of a potential mining location.Although it seems uniform everywhere, gravity actually varies slightly from place to place. When you drive a couple of kilometers, you are probably gaining or losing weight, albeit an extremely small amount. These variations are caused by particularly light or heavy rock formations in the Earth’s crust.
Like magnetic surveys, gravity surveys use precise instruments to measure the strength of gravity at various places. This allows geologists to create maps of the density of the crust below our feet. This method is particularly effective at accurately spotting oil deposits. However, they also have applications in mining.
Semi-regional gravity surveys can provide comprehensive structural, genetic and target evaluation and achieve site discrimination in terms of potential economic deposits [3]. Systematic exploration is usually based on some conception of general or generic setting. In this case an ability to define host structures or units as well as vein location and orientations, coupled with the facility to discriminate mineralized from unmineralized terrain was necessary.
Geology of the study area
Migori greenstone belt runs west-northwest to east-southeast between Lake Victoria and the Great Rift Valley (Figure 1). The belt is squeezed between the diapiric Migori granite batholith to the south and a felsic volcanic succession to the north. The structure of the Migori greenstone belt appears to reflect diapiric movements of the Migori granite batholiths. The geology of the area consists of Archean greenstone belt that surrounds Lake Victoria. The Archean rocks in this area are principally of the Nyanzian system, the Kavirondian system and the post-Kavirondian granites [4].

Figure 1: Complete Bouguer gravity contour map.
Mineralization within this belt occurs along a system of veins mostly of quartz which in some places small proportions of pyrite, arseno-pyrite, chalcopyrite and galena as well as gold. The auriferous quartz veins which may be blue-grey, nearly black or smoky are the commonest and most characteristic products of mineralization according to the report (Ngira exploration work Ltd, 2009). Study conducted by Shackleton, deduced that the Macalder mine area consisted of sulphide replacement veins [4]. Rocks in the vicinity are described to be having a regional foliation trending west-northwest and steeply dipping to the north or south. Also, evidence of graded bedding and cleavage-bedding relations east of the mine in a south dipping sequence is reported. According to this research the whole belt is sandwiched between Migori granite in the south and porphyritic andesites in the north. The area is also injected with dykes and sheets of granite and quartz-porphyries and sills of epi-diorite and delorite.
In a geological study by Ichangi it is concluded that the belt is a Zn-Cu-Au-Ag massive sulphide deposit, with numerous gold occurrences restricted to the greenstone belt. In mapping the area and defining the lithofacies, the rocks in the area has been divided into formations and modern stratigraphic nomenclature in naming the lithostratigraphic units has been adopted [5]. According to this research, a considerable economic potential for gold exist in Migori as the type of gold mineralization, volcanogenic massive sulphides, is the most common and widespread in other Archeancratons (Ngira exploration works Ltd, 2009)
Tilt angle derivative (TDR)
TDR is a technique that can be used to trace the edges of the anomaly causative body [6]. It is applicable in mapping shallow basement structures and mineral exploration targets [7]. It produces positive values directly above the sources; negative values away from the sources and a zero value over or close to the source edges. It is given by the equation;
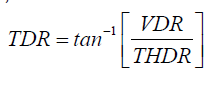
Where VDR is the vertical derivative and THDR is the total
horizontal derivative. It can further be expressed in terms of the
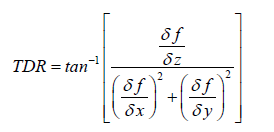
magnetic or gravity field (f) and the first derivative of the field f in
the x, y and z directions 
as;
The amplitude of TDR range between –π/2 to +π/2 radians regardless of the amplitude of the vertical or the absolute value of the total horizontal gradient [8].
Analytic Signal (AS)
Analytic Signal is also one of the techniques for delineating edges of shallow magnetic and gravity sources given that the amplitude of the analytical signal peaks over the magnetic or gravity sources [9]. However, it suffers from the assumption that near surface structures can be characterized adequately by step models [10]. It is defined as;
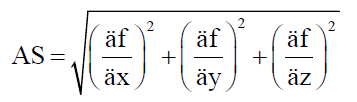
Where  are the first derivatives of the total magnetic
field in the x, y and z directions [11]
are the first derivatives of the total magnetic
field in the x, y and z directions [11]
Ground gravity survey of Migori greenstone belt was conducted at 425 gravity stations in an attempt to develop a better understanding of the geology of the mineral prospect. Data reduction for the effects which are not of immediate interest was conducted on the gravity data. Geosoft Oasis Montaj application software was used to conduct all the data corrections. The montaj gravity and terrain correction extension is designed to process gravity data from conventional ground surveys, with the final goal of producing a map of a gravity field showing the locations of the readings [7].
High gravity anomaly trending WNW-ESE along the belt was obtained from the contour signature. Qualitative interpretation of the anomaly was attempted by inspecting profiles and grids for gravitational field variations. The regional gravity field was filtered in order to isolate the residual anomaly which was then subjected to further interpretation. The qualitative interpretation of gravity data involved identifying the anomalies from the complete Bouguer anomaly map, which is interpreted based on the fact that, low values of complete Bouguer anomaly of the gravity data indicate low density material beneath the measurement point and high values of complete Bouguer anomaly of gravity data indicate higher density material beneath the measurement point.
Power spectral analysis of gravity data was first computed in an attempt to obtain the limiting depth of the causative body. Shallow structures at a depth of below 800 m were delineated (Figure 2); this informed the choice of tilt angle derivative (TDR) and analytical signal (AS) edge detection techniques. The two techniques give good resolution at shallow depths.

Figure 2: Computed power spectrum of the gravity anomaly.
The gravity data of Migori greenstone belt delineates high Bouguer gravity anomaly of amplitude of -168.224 mgal. The delineated high gravity anomalies trend WNW-ESE from Macalder on the WNW to Kehancha on ESE through to Kenya-Tanzania border (Figure 3). It passes through Masara, Mukuro, Migori, Nyanchabo and Masaba. From both TDR and AS results, the width of the productive parts of the belt ranges from approximately 6000 m on the ESE and slightly widens towards Masara and Macalder to approximately 15000 m (Figure 4).

Figure 3:Tilt angle derivative of gravity anomalies of Migori greenstone belt.

Figure 4: Analytical signal of gravity anomaly.
The discontinuity in the gravity highs indicate the existence of dense deposits along a system of veins which according to the geological report is mostly associated with granitic intrusive characterised by banded iron formations that also act as a host for other minerals.
The gravity data of Migori greenstone belt delineates high Bouguer gravity anomaly of amplitude of -168.224 mgal. The delineated high gravity anomalies trend WNW-ESE from Macalder on the WNW to Kehancha on ESE through to Kenya-Tanzania border as shown in above figures. It passes through Masara, Mukuro, Migori, Nyanchabo and Masaba. The width of the productive parts of the belt ranges from approximately 6000 m on the ESE and slightly widens towards Masara and Macalder to approximately 15000 m, as shown in above figures. The discontinuity in the gravity highs indicate the existence of dense deposits along a system of veins which according to the geological report is mostly associated with granitic intrusive characterised by banded iron formations that also act as a host for other minerals.
Citation: Antony O (2021) Demarcating Productive Parts of Migori Greenstone Belt using Edge Detection Techniques. J Geol Geophys. 10: 1002.
Received: 01-Nov-2021 Accepted: 15-Nov-2021 Published: 22-Nov-2021 , DOI: 10.35248/2381-8719.21.10.1002
Copyright: © 2021 Antony O. This is an open-access article distributed under the terms of the Creative Commons Attribution License, which permits unrestricted use, distribution, and reproduction in any medium, provided the original author and source are credited.