Journal of Geology & Geophysics
Open Access
ISSN: 2381-8719
ISSN: 2381-8719
Research Article - (2013) Volume 2, Issue 4
The interest in the particulate matter speciation is increased during these last years: in particular, the inorganic fraction is studied for its sanitary implications. In fact, whereas for some elements the toxic effects are well known, for other elements there is little information about it. For instance, in this contest an important role is played by the Rare Earth Elements, e.g. Ce, Eu and Yb. These elements, some of them ubiquitous worldwide, are largely used in different industrial applications (optical fibers and electronics) whereas there are few issues on their physiology properties. In any case, Ce and the other REEs should be considered moderately toxic: recent studies suggest that REEs may bind specifically to endothelial sites in the brain and be relevant to the physiological brain functions. This difficulty is mainly due to their determination: they are at very low levels, ultra-trace levels, and very few analytical techniques can reach such limit of detection. Further, similar analytical problems occur also for other important elements (i.e., Cd, Hg, Ni, V) when their levels are too low (such as in airborne particulate matter). So, in this study we use a methodology based on nuclear analytical technique, i.e. Instrumental Neutron Activation Analysis (INAA), for studying the element composition (almost 40 elements) in PM10 during intensive summer and winter sampling campaigns in downtown Rome. After irradiation in the nuclear reactor the filters are measured by different gamma measurements in order to have more element information as possible. The granulometric fine and coarse fractions are also analyzed and the results commented, especially the correlation among the elements inter- and intra-fractions. Finally, a retrospective study is performed across 40 years of PM10 determination and the Enrichment Factors of both PM10 and coarse fraction are shown and discussed. Differently from other investigations, this study can be considered the first almost complete picture of the inorganic composition of PM10 sampled in a big city, Rome, of the Mediterranean area, benchmark for other researches.
Keywords: Atmospheric aerosol, Neutron activation analysis, Inorganic fraction, Rare earth elements
In atmospheric chemistry a very important task regards the study of inorganic fraction in the airborne particulate matter, PM10 and, more recently, PM2.5. Even if the particulate matter composition is too much complex (organic and inorganic fractions) a great attention is focused to elements at elevated toxicity and wide diffusion in environment (e.g., Cd, Cr, Ni, Zn, etc). In this way, the geologic and biological cycles are fundamental natural sources of elements: they redistribute metals by physical process or bioconcentration occurring in the biosphere. Actually, environmental element contamination can derive also from industrial activities. Therefore, the element level knowledge and the behavior of elements toxicologically and geochemically important are important targets in atmospheric pollution evaluation.
The elements can be preliminarily divided in three different categories in relation to their potential biological and human health effects: essential elements (e.g., K, Na, Fe), critical elements (e.g., Co, Cr, Cu, Ni, If, V) and toxic elements (e.g., Cd, Hg, Pb, Tl) [1]. The problems of evaluating local and global contamination due to these species [1] make the study of airborne trace element composition to be one of the most important scientific issues in environmental chemistry.
An important target in atmospheric pollution evaluation is the behavior knowledge of elements toxicologically and geochemically important: further, in the last years a particular interest is assuming the determination of some elements of which few data exist in literature (for instance, some precious metals, Pd, Rh, Ir, used in catalytic pots or rare earths in optical fibers and electronics). Rare Earth Elements (REEs), i.e., Ce, Dy, Er, Eu, Gd, Ho, La, Lu, Nd, Pm, Pr, Sc, Sm, Th, Tm and Yb, play an important role in geochemical studies, since their distribution in earth’s crust and mantle contributes to elucidate evolutionary processes of geological cycles, providing information on derivation and dating of igneous rocks [2,3]. A very interesting task regards the REE mobilization in the environment because they can enter in the food chain. So, the study and the relative continuous monitoring are strongly recommended both in environmental and biological matrices. The data deficiency is due to the analytical difficulties (e.g., chemical separation by pre-concentration, possible formation of positive/negative artifacts during the procedure). For the inorganic speciation we used a nuclear analytical methodology, i.e. Instrumental Neutron Activation Analysis (INAA), for its important analytical properties; further, INAA represents the most reliable method for analyzing trace and/or ultratrace elements, especially in very few sample portions [4-15]. INAA is considered a primary analytical method because all the steps are totally traceable with absence of physical-chemical manipulation. Due to its very good analytical parameters, INAA is favored respect to instrumental methods for element analysis at trace/ultra-trace levels: comparative studies have pointed out that INAA is blank free [16] and especially suitable for the analysis of reference materials [17].
This paper investigates the element determination in PM10 airborne samples by means of INAA. The main purpose is addressed to know the element composition (toxic and no-toxic) along with REEs and some actinides.
Sampling site and filter collection
The PM10 was collected by means of a SM200 (Opsis, Sweden) monitor analyzer along with a dichotomous sampler (mod. SA 241, Graseby,-Andersen): both of the instruments works at 16.7 L min-1. This second sampler has a PM10 size selective inlet and is able to separate the aerosol into fine (aerodynamic diameter, Da, <2.5 μm) and coarse (2.5 μm
The sampling was performed in downtown Rome (41° 54’ 00” Nord; 12° 29’ 00” Est) in different intensive campaigns in 2010 during summer (June-September) and winter (January-March) periods. Each PM collection was 24-hr long for each couple of filters: 15 samples were collected every 15 days (8 in summer and 7 in winter). High buildings (domestic heating) and narrow streets (strong auto vehicular traffic) characterize the sampling area. For the orographic territory of Rome the prevalent wind from the East coast (“ponentino” wind) is not relevant for the pollution re-mixing. All the storage and handling sample treatment were carried out at the INAIL’s Primary Reference Laboratory according to the EU regulations [18].
INAA analysis
The particulate fraction analysis allows evaluating levels and distribution of almost 40 elements. In particular, a major attention is drawn for some elements not easily detectable with the common laboratory equipment (e.g., REEs).
Samples along with blank and standards were irradiated at a neutron flux of 2.6×10¹² n×cm-2×s-1 for 32.55 h in the rotary rack “Lazy Susan” and at 2.68×10¹³ n×cm-2×s-1 for 1 min in the central channel of the nuclear reactor Triga Mark II of the ENEA-Casaccia Laboratories [18].
For the analysis primary and secondary standards were used. Primary standards (Carlo Erba, Milan, Italy) were As, Cd, Co, Cr, Cs, Fe, Hg, La, Ni, Sb, Se, Sm and Zn whereas as secondary standards United States Geochemical Survey (USGS) nn. 4 and 6 and the Coal Fly Ash (NIST) n. 1633a were used.
Figure 1 shows the γ-ray spectrometry measurements: an HPGe detector (FWHM 1.68 keV at 1332 keV) connected to a multichannel analyzer equipped with specific software packages was used. Two measurements were performed according to the half-life of each element and considering the time from the end of the irradiation [19,20].
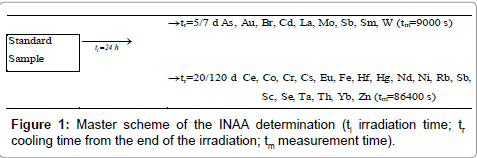
Figure 1: Master scheme of the INAA determination (ti irradiation time; tr cooling time from the end of the irradiation; tm measurement time).
Nuclear data such as product nuclide, half-life and energy peak, and LOD (expressed as ng m-3) of each element investigated in this study by INAA [13,21] are reported in Table 1.
| Element | Product nuclide | Half life | γ-Ray used (keV) | LOD27 (ng/m3) | |
| Ag | 110mAg | 249.9 | d | 657.7 | 0.06 |
| As | 76As | 1.096 | d | 559.2 | 1 |
| Au | 198Au | 2.697 | d | 411.8 | 0.001a |
| Ba | 131Ba | 11.8 | d | 496.3 | 5 |
| Br | 82Br | 1.47 | d | 776.5 | 0.5 |
| Ca | 47Sc | 3.42 | d | 159.8 | 300 |
| Cd | 115mIn | 53.38 | h | 527.8 | 0.3 |
| Ce | 141Ce | 32.38 | d | 145.4 | 0.05 |
| Co | 60Co | 5.272 | y | 1332.5 | 0.01 |
| Cr | 51Cr | 27.7 | d | 320.0 | 0.2 |
| Cs | 134Cs | 2.062 | y | 795.7 | 0.02 |
| Eu | 152Eu | 12.7 | y | 1408.0 | 0.01 |
| Fe | 59Fe | 45.1 | d | 1099.2 | 50 |
| Hf | 181Hf | 42.5 | d | 482.2 | 0.01 |
| Hg | 203Hg | 46.59 | d | 279.0 | 0.02 |
| K | 42K | 12.36 | h | 1524.7 | 50 |
| La | 140La | 40.27 | h | 1596.2 | 0.1 |
| Mg | 27Mg | 9.46 | m | 1014.1 | 50 |
| Mn | 56Mn | 2.576 | h | 1810.7 | 0.5 |
| Mo | 99Mo | 2.76 | d | 141.0 | 0.2 |
| Na | 24Na | 15.0 | h | 1368.4 | 100 |
| Nd | 147Nd | 11.06 | d | 531.0 | 1a |
| Ni | 58Co | 70.78 | d | 810.7 | 1 |
| Rb | 86Rb | 18.66 | d | 1076.7 | 1 |
| Sb | 122Sb | 2.70 | d | 564.0 | 0.2 |
| Sc | 46Sc | 83.85 | d | 889.2 | 0.003 |
| Se | 75Se | 120.4 | d | 264.6 | 0.1 |
| Sm | 153Sm | 1.948 | d | 103.1 | 0.41b |
| Th | 233Pa | 27.4 | d | 311.8 | 0.1 |
| V | 52V | 3.75 | m | 1434.4 | 1 |
| W | 187W | 23.9 | h | 685.7 | 0.01a |
| Yb | 175Yb | 4.19 | d | 396.1 | 0.01a |
| Zn | 65Zn | 243.8 | d | 1115.5 | 0.5 |
Table 1: Nuclear data and Limit of Detection (LOD) of the elements determined by INAA (m: minutes; h: hours; d: days; y: years). LOD calculated according to Currie [20] (a: expressed as μg/g; b: expressed as ng/g).
Quality Assurance and Quality Control (QA/QC) evaluation
Table 2 shows the analytical INAA Quality Control on some elements. In particular, for each element our values determined by INAA (“measured value”) and the “certified value” are compared: the agreement is quite good except for some elements, i.e. Ba, U and Zn. Ba and U show discrepancies due to the difficulty to analyze such elements whereas for Zn the “certified value” (152 μg g-1) falls into the INAA value range (132 ± 18 μg g-1).
| Element | Measured value | Certified value | Δ (%) |
| Mean ± s.d. | mean | ||
| As | 4.9 ± 0.5 | 5.6 | 87.5 |
| Au | 1.26 ± 0.10 | 1.15 | 109.6 |
| Ba | 43.4 ± 0.5 | 53.8 | 80.7 |
| Cd | 10.6 ± 1.0 | 9.96 | 106.4 |
| Co | 1.3 ± 0.1 | 1.12 | 116.1 |
| Cr | 4.7 ± 0.8 | 5.6 | 83.9 |
| Cu | 51.6 ± 0.5 | 48.8 | 105.7 |
| Fe | 193 ± 17 | 207.9 | 92.8 |
| Mn | 31.2 ± 1.0 | 31.9 | 97.8 |
| Mo | 1.26 ± 0.2 | 1.14 | 110.5 |
| Se | 1.01 ± 0.10 | 1.06 | 95.3 |
| U | 0.78 ± 0.10 | 1.02 | 76.5 |
| V | 8.04 ± 0.35 | 8.00 | 100.5 |
| Zn | 132 ± 18 | 152 | 86.8 |
Table 2: Results of INAA quality control on IAEA air filter samples (μg g-1). The “measured value” is the average of seven determinations on seven different replicates. s.d.: standard deviation; n.d.: not detected.
Particulate matter results
Table 3 shows both the summer and winter average element levels as well as the maximum and minimum values measured in PM10 samples. Firstly, an interesting consideration can be drawn according the different element origin: elements of artificial origin show winter concentration levels higher than the summer whereas elements of natural origin show summer concentration levels higher than the winter. The two occurrences can be related to the strong anthropogenic emission in winter period (and relative pronounced emission) and an increased re-suspension of soil matter in summer.
| Element | Summer | Winter |
| mean (min-max) | mean (min-max) | |
| Ag | 0.22 (0.1-0.5) | 0.25 (0.1-0.6) |
| Al | 2900 (500-5300) | 800 (200-1600) |
| As | 6 (1-15) | 4 (1-9) |
| Ba | 60 (30-120) | 30 (5-70) |
| Br | 40 (20-70) | 70 (10-140) |
| Ca | 2200 (800-4200) | 1200 (300-2000) |
| Cd | 0.4 (0.3-0.9) | 0.75 (0.3-2) |
| Ce | 5.6 (0.7-10) | 2 (0.2-5) |
| Cl | 1300 (300-3900) | 1400 (300-4700) |
| Co | 0.7 (0.4-1.2) | 0.5 (0.1-0.9) |
| Cr | 7 (4-13) | 16 (2-38) |
| Cs | 1.2 (0.6-2.2) | 0.6 (0.2-1.3) |
| Eu | 0.08 (0.04-0.14) | 0.03 (0.01-0.07) |
| Fe | 2200 (1000-3600) | 1100 (400-2700) |
| Hf | 0.36 (0.15-0.62) | 0.13 (0.01-0.30) |
| Hg | 0.14 (0.05-0.36) | 0.13 (0.03-0.20) |
| K | 1120 (50-1900) | 320 (50-1000) |
| La | 5 (2-9) | 2 (0.3-4) |
| Mg | 1090 (50-2700) | 560 (200-1200) |
| Mn | 40 (15-60) | 35 (10-90) |
| Mo | 0.5 (0.2-0.6) | 2 (0.3-7) |
| Na | 1500 (300-7000) | 730 (200-3500) |
| Ni | 1.7 (1-5) | 8.2 (3-13) |
| Rb | 17 (10-30) | 7 (2-15) |
| Sb | 2 (0.7-4) | 2 (0.7-7) |
| Sc | 0.3 (0.1-0.5) | 0.1 (0.03-0.2) |
| Se | 0.7 (0.2-1.1) | 0.5 (0.2-1.3) |
| Ta | 0.03 (0.01-0.05) | 0.01 (0.005-0.02) |
| Tb | 0.055 (0.01-0.10) | 0.024 (0.01-0.05) |
| Th | 3 (1-5) | 0.9 (0.3-2.5) |
| Ti | 540 (200-1050) | 265 (200-500) |
| Tl | 1 (0.5-2) | 1.4 (0.5-4) |
| U | 0.4 (0.1-0.7) | 0.2 (0.06-0.4) |
| V | 8 (1-15) | 14 (8-23) |
| Zn | 110 (50-260) | 190 (50-520) |
| Zr | 50 (10-90) | 20 (5-50) |
Table 3: Seasonal element concentrations (average, min and max levels expressed as ng m-3) determined by INAA in airborne filters sampled in summer and winter periods in downtown Rome.
This issue is obviously strictly related to the general characteristics of Italy (meteorological and aerographic) and shows some peculiarity. In fact, considering similar studies in other countries most elements of natural origin show sensible differences related to geomorphological and meteorological characteristics. For instance, the higher values found in this study for Al, Cs, Na, Rb, Th, Ti, U and rare earths are to be related to element content of the volcanic rocks, which are very widespread in Latium, the region of approximately 17,236 sq in which Rome situated [22,23].
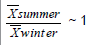
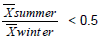
For studying the relationship between elements a very simple approach was followed: we determined the ratio (R) between average levels in summer and winter period, respectively. So, we grouped the data into three categories according to their R (Table 4). The first group includes elements whose R is greater than 2; the second group elements whose R is less than 2 but greater than 0.5; the last group includes elements whose R is less than 0.5.
 |
 |
 |
| Na, Mg, Al, K, Ca, Sc, Ti, Fe, Rb, Zr, Cs, Ba, La, Ce, Eu, Tb, Hf, Ta, Th, U | Cl, Mn, Co, As, Se, Br, Ag, Sb, Hg, Tl | V, Cr, Ni, Zn, Mo, Cd |
Table 4: Grouping of elements in PM10 according to the Summer/Winter ratio seasonal average.
Following the preliminary consideration above reported elements of natural origin are found in the first group only, whereas anthropogenic element are included in the third group (Cd, Cr, Mo, Ni, Pb, V, Zn). Finally, elements with double origin (natural and anthropogenic) are present in the second group.
Simultaneously some samplings were performed on two different airborne fractions: Table 5 shows average concentration values, minimum and maximum levels along with standard deviation and coefficient of variation (CV %) of the elements determined in fine (PM2.5) and coarse (PM2.5-10) fractions. Differently to the composition reported in Table 3, it is not possible to determine all the elements in these samples: analytical problems (some elements are very low levels, e.g., Nd is below LOD) and physical characteristics of the aerosol granulometric size sampled (aerodynamic diameter ranging between 2.5 and 10 μm) are responsible of this issue. In any case, the element concentration levels are low as well as the situation is good regarding the exposition to potential toxic elements. Table 6 reports the correlation coefficients of the analyzed elements in the coarse fractions: all the elements result quite correlated (0.7 < correlation coefficient < 1, marked in bold), especially As, Co, Fe, Sc, Sb, Se. Also in this case the behavior can be expected considering the chemical-physical properties of the elements and the granulometric size.
| Element | Fraction | Average | St. Dev | Min | Max | CV % |
| As | F | 1.058 | 0.683 | 0.121 | 2.76 | 65 |
| C | 0.284 | 0.316 | 0.017 | 1.24 | 111 | |
| Aua | F | 9.1 | 12.2 | 4.49 | 50.3 | 134 |
| C | 15.2 | 10.0 | 1.70 | 34.9 | 67 | |
| Ba | F | 3.8 | 2.4 | 1.9 | 6.4 | 63 |
| C | 12.9 | 14.7 | 2.9 | 56.5 | 114 | |
| Br | F | 17.1 | 13.9 | 3.2 | 50.4 | 81 |
| C | 4.70 | 4.08 | 0.40 | 13.8 | 87 | |
| Ce | F | 0.13 | 0.089 | 0.03 | 0.34 | 68 |
| C | 0.74 | 0.419 | 0.10 | 1.37 | 57 | |
| Co | F | 0.167 | 0.065 | 0.077 | 0.331 | 39 |
| C | 0.199 | 0.105 | 0.085 | 0.428 | 53 | |
| Cr | F | 3.03 | 1.03 | 1.29 | 6.40 | 34 |
| C | 4.16 | 1.40 | 1.66 | 6.49 | 34 | |
| Cs | F | 0.047 | 0.037 | 0.004 | 0.124 | 79 |
| C | 0.100 | 0.097 | 0.005 | 0.325 | 97 | |
| Eua | F | 1.14 | 0.029 | 1.12 | 1.16 | 2 |
| C | 14.0 | 6.02 | 3.62 | 20.1 | 43 | |
| Feb | F | 0.08 | 0.06 | 0.01 | 0.21 | 75 |
| C | 0.50 | 0.30 | 0.03 | 1.10 | 60 | |
| Hfa | F | 18.0 | 10.0 | 6.0 | 32.0 | 56 |
| C | 81.0 | 39.6 | 20.0 | 155.0 | 49 | |
| Hg | F | 0.49 | 0.51 | 0.20 | 2.12 | 104 |
| C | 0.66 | 0.67 | 0.05 | 2.54 | 102 | |
| Laa | F | 53.2 | 10.5 | 8.7 | 53.2 | 20 |
| C | 170.3 | 101.2 | 21.2 | 348.9 | 59 | |
| Mo | F | 0.75 | 0.70 | 0.02 | 3.04 | 93 |
| C | 1.33 | 0.877 | 0.33 | 3.29 | 66 | |
| Ni | F | 3.5 | 1.5 | 1.9 | 5.8 | 43 |
| C | 1.0 | 0.05 | 1.0 | 1.1 | 5 | |
| Rb | F | 1.82 | 1.07 | 0.417 | 3.74 | 59 |
| C | 1.2 | 0.621 | 0.2 | 1.7 | 52 | |
| Sb | F | 3.60 | 3.24 | 0.69 | 12.6 | 90 |
| C | 5.53 | 3.79 | 1.59 | 14.55 | 69 | |
| Sca | F | 3.1 | 2.41 | 0.2 | 7.5 | 78 |
| C | 42.0 | 22.6 | 5.4 | 94.6 | 54 | |
| Se | F | 0.567 | 0.415 | 0.116 | 1.551 | 82 |
| C | 0.120 | 0.080 | 0.012 | 0.320 | 67 | |
| Sma | F | 3.9 | 2.13 | 0.2 | 7.8 | 55 |
| C | 48.4 | 29.6 | 6.6 | 106.1 | 61 | |
| Tha | F | 23.0 | 10.0 | 7.0 | 40.1 | 37 |
| C | 182.0 | 99.6 | 15.0 | 345.0 | 55 | |
| W | F | 0.64 | 0.682 | 0.06 | 2.86 | 107 |
| C | 0.61 | 0.298 | 0.10 | 1.27 | 49 | |
| Zn | F | 55.0 | 61.0 | 0.6 | 251.7 | 111 |
| C | 23.8 | 17.6 | 0.6 | 53.6 | 74 |
Table 5: Synoptic table (mean value, min-max values, standard deviation and CV %) of elements concentration (ng m-3) determined in fine and coarse fraction determined in downtown Rome (* expressed as pg m-3; ** expressed as μg m-3).
| As | Ba | Br | Ce | Co | Cr | Cs | Eu | Fe | Hg | La | Mo | Rb | Sb | Sc | Se | Sm | Th | Yb | W | Zn | |
| 0.93 | 0.46 | 0.36 | 0.81 | 0.25 | 0.47 | 0.92 | 0.82 | 0.09 | 0.44 | 0.44 | 0.62 | 0.50 | 0.63 | 0.15 | 0.53 | 0.50 | -0.36 | 0.41 | 0.48 | As | |
| 0.13 | 0.11 | 0.74 | 0.04 | 0.20 | 0.98 | 0.72 | 0.07 | 0.15 | 0.12 | 0.42 | 0.16 | 0.39 | -0.05 | 0.22 | 0.17 | -0.28 | 0.32 | 0.34 | Ba | ||
| 0.53 | 0.70 | 0.50 | 0.76 | 0.87 | 0.72 | 0.22 | 0.76 | 0.79 | 0.62 | 0.87 | 0.73 | 0.41 | 0.80 | 0.73 | 0.25 | 0.54 | 0.58 | Br | |||
| 0.50 | 0.65 | 0.40 | 0.98 | 0.72 | 0.24 | 0.86 | 0.64 | 0.57 | 0.71 | 0.70 | 0.35 | 0.73 | 0.81 | 0.69 | 0.29 | 0.44 | Ce | ||||
| 0.39 | 0.70 | 0.95 | 0.88 | 0.10 | 0.72 | 0.69 | 0.73 | 0.75 | 0.76 | 0.18 | 0.78 | 0.78 | -0.35 | 0.58 | 0.62 | Co | |||||
| 0.25 | 0.76 | 0.63 | -0.08 | 0.60 | 0.69 | 0.30 | 0.62 | 0.57 | 0.38 | 0.62 | 0.70 | 0.70 | 0.47 | 0.71 | Cr | ||||||
| 0.85 | 0.67 | -0.06 | 0.74 | 0.71 | 0.64 | 0.78 | 0.83 | 0.43 | 0.82 | 0.68 | 0.61 | 0.25 | 0.49 | Cs | |||||||
| 0.95 | 0.14 | 0.98 | 0.89 | - | 0.91 | 0.92 | 0.41 | 0.98 | 0.98 | - | 0.57 | 0.89 | Eu | ||||||||
| 0.13 | 0.80 | 0.78 | 0.85 | 0.84 | 0.89 | 0.37 | 0.87 | 0.85 | 0.17 | 0.51 | 0.70 | Fe | |||||||||
| 0.06 | -0.09 | 0.84 | -0.01 | 0.11 | 0.00 | -0.01 | 0.11 | -0.06 | 0.08 | 0.06 | Hg | ||||||||||
| 0.85 | 0.63 | 0.91 | 0.85 | 0.47 | 0.91 | 0.88 | 0.70 | 0.36 | 0.57 | La | |||||||||||
| 0.58 | 0.95 | 0.81 | 0.31 | 0.88 | 0.81 | 0.49 | 0.49 | 0.78 | Mo | ||||||||||||
| 0.63 | 0.63 | 0.24 | 0.66 | 0.77 | -0.03 | 0.61 | 0.28 | Rb | |||||||||||||
| 0.85 | 0.37 | 0.94 | 0.87 | 0.67 | 0.51 | 0.70 | Sb | ||||||||||||||
| 0.42 | 0.92 | 0.86 | 0.57 | 0.31 | 0.71 | Sc | |||||||||||||||
| 0.50 | 0.35 | 0.65 | -0.14 | 0.26 | Se | ||||||||||||||||
| 0.93 | 0.63 | 0.39 | 0.72 | Sm | |||||||||||||||||
| 0.47 | 0.48 | 0.72 | Th | ||||||||||||||||||
| -0.47 | 0.48 | Yb | |||||||||||||||||||
| 0.35 | W | ||||||||||||||||||||
| Zn |
Table 6: Correlation coefficients for the trend of concentrations of analyzed elements present in the coarse fraction.
Finally, from an element composition point of view, more elevated concentrations are found in coarse fraction than in fine fraction whereas the distribution between the two fractions is different. In particular, Br, Fe and Sb show a very good distribution, whereas elements such as Ce (natural origin), Cs (no influence by marine air stream), Sc (natural origin and no industrial uses) and Th (consistent variability between summer and winter) show no good correlation.
Enrichment Factor (EF) determination
In order to study a retrospective element trend in PM10 and the relative evolution in relationship with the natural or anthropogenic origins, we investigated the levels of 14 elements (As, Br, Cd, Co, Cr, Hg, La, Ni, Pb, Sb, Se, Th, V, Zn) collected in 4 previous decades (Table 7). Although the sampling areas were located in three different points in downtown Rome, the characteristics of these sites are the same (the other two sites are Urbana road and Regina Margherita road). The data show a decreasing ranging between 24% (Co) and 91% (La), except for Hg (from 0.13 to 1.07), Sb (from 2.0 to 9.2) and Se (from 0.5 to 0.7). This may be attributed to both technological growths during the entire period (especially for mercury) and adoption of anti-pollution system in domestic heating and in industrial plants (especially fo As, Pb, V). For a better knowledge of the element origin, we have calculated the Enrichment Factors (EFs) in relationship to the element abundance in the upper continental crust. Elements having EF values ranging between 5 and 50 can also be considered of non-crustal origin and may be attributed to long-transport phenomena from other natural and/or anthropogenic sources whereas elements with EFs higher than 50 are considered strongly enriched than the crustal origin and therefore of anthropogenic origin. Finally, elements with EFs less than 1 are of natural origin. The EFs have been calculated in according to the following equation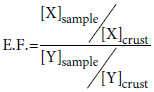 [24,25] where X is the element determined in the sample and present in the crust whereas Y is the normalizing agent determined in the sample and present in the crust. Three different normalizing agents, Fe, La and Sc, were used. Figure 2 shows the EF trend for selected elements in PM10 during the decades investigated. As can be noted, La, Th, Co, As and V may be attributed to long-range transport phenomena from other natural and/ or anthropogenic sources: this behavior is common to all the period studied even if a very light decreasing trend can be evidenced from 1970 to 2002. Looking at the Figure 2, three element groups can be identified according to their EFs: La and Th ranging between 1 and 5, are of natural origin; Co, As and V between 1 and 100, have double origin; Cr, Ni, Hg, Zn, Se, Pb, Sb, Cd and Br ranging between 100 and 2500. The EF values of Br (and Pb as well) by both the elaborations show the importance the use of leaded gasoline even if in the last measurements the EF is decreasing (leaded gasoline are still present at the end of nineties’). Sources of As, Pb, Sb and Zn would be looked for among the various anthropogenic activities in Rome area, particularly Sb and Zn could be due to traffic origin because they are essential components of anti-friction alloys and car tires.
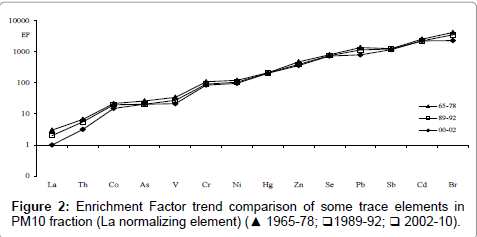
Figure 2: Enrichment Factor trend comparison of some trace elements in PM10 fraction (La normalizing element) (▲ 1965-78; 1989-92; 2002-10).
| PM10 | |||
| 1965-78 | 1989-92 | 2002-10 | |
| As | 4.00 | 1.35 | |
| Br | 70 | 50 | 22 |
| Cd | 0.751 | 0.520 | |
| Co | 0.498 | 0.523 | 0.379 |
| Cr | 16 | 2.3 | 7.28 |
| Hg | 0.131 | 0.092 | 1.07 |
| La | 2.04 | 0.803 | 0.188 |
| Ni | 8.01 | 1.72 | 4.54 |
| Pb | 270 | 172 | 92 |
| Sb | 1.99 | 2.13 | 9.22 |
| Se | 0.533 | 0.091 | 0.692 |
| Th | 0.911 | 0.723 | 0.229 |
| V | 14 | 4.82 | 4.02 |
| Zn | 190 | 28 | 80 |
Table 7: Levels (ng m-3) of selected elements investigated along four decades in downtown Rome.
Similar approach was applied to elements investigated in the coarse fraction, although we have no previous data. Figure 3 shows the results obtained on the coarse fraction using La, Sc and Fe as normalizing agents: As, Au, Ba, Br, Hf, Hg, Mo, Sb, Se and Zn show EF values ranging between 5 and 3500, respectively. Also in this case an interesting consideration can be drawn due to the different granulometric size and the consequent different ability to penetrate: the EFs in coarse fraction is more elevated that in PM10 fraction, especially for Br, Sb, Se and Hg. This occurrence becomes important when we consider the different bioavailability of an element present in coarse fraction compared to the PM10 fraction. Also in this case the high EF value of Br could be attributed to the use of leaded, more evident in this fraction.
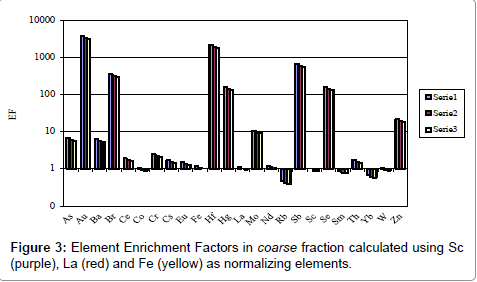
Figure 3: Element Enrichment Factors in coarse fraction calculated using Sc (purple), La (red) and Fe (yellow) as normalizing elements.
This study is a deepest investigation on different granulometric size fractions of airborne particulate matter sampled in downtown Rome (e.g., first determinations for Ce and Th). The experimentation is based on INAA allowing reaching elevated sensibility/precision/ accuracy levels. The results obtained for some elements, especially those of geochemical origin (e.g., La and Th), could be considered representative of the urban area of Rome. Only few elements show a very good distribution between the two fractions whereas a greater part shows a distribution more elevated in the coarse fraction than in the fine fraction; EFs show an opposite trend. Three elements, Co, Hg and Zn, show no predominant distribution between the two granulometric size fractions.
Finally, an issue of this paper was to have information about the effects of such elements on the human health: basically the concentrations do not show significant attention levels.
This work was supported under the Grant INAIL DIPIA P2/L2.