Journal of Horticulture
Open Access
ISSN: 2376-0354
ISSN: 2376-0354
Research Article - (2015) Volume 2, Issue 3
This article introduces the first database for developmental parameters of the herbaceous peony cultivated in a warm climate region. Data on the effect of temperature during dormancy and growth parameters are presented for 2,232 plants of two commercial cultivars exposed to 14 different temperature regimes: 15-18 dates of dormancy release for each regime and 10 weekly measurements of 6 growth parameters for each plant. Diversity of developmental response was examined with a Tukey test. The efficacy of the database for the regulation of the developmental processes and production ability is demonstrated with numerous examples of estimated growth rate of stems. The sigmoid nature of the growth curves is noted. The database could be used for research on plant physiology of peony and other geophytes, as well as for the prediction of effective commercial flower production. The database is available at http://www.mop-zafon.org.il/files/DB18_Sept_2014.xlsx.
<Keywords: Database; Peony; Dormancy; Phenology; Sigmoid growth; Flower production; Profitability
Peonies are popular and well-known ornamental plants commonly grown in temperate, cold-winter climatic regions [1]. As in many geophyte species, a perennial underground crown (metamorphosed shoot) serves for the accumulation of storage products and for plant renewal. Numerous buds form on the surface of the crown and near the bases of aboveground stems, and after sprouting, they develop into monocarpic shoots with several leaves and terminal and auxiliary flowers [2]. Similar to many other perennial plants originating from temperate climate regions, during their annual growth cycle, peonies undergo periods of considerable environmental changes. Progressive adaptation to the climatic cycle led to the development of special growth patterns to escape unfavorable periods and to resume plant growth in the appropriate season. In the fall, when temperatures decrease, peony plants enter a dormancy period defined as "a temporary suspension of visible growth" [3]. Once dormancy has been initiated, a prolonged period of chilling is needed to break it but cold requirements are cultivar-specific [4,5].
In temperate northern hemisphere regions, peonies flower in May-July. Following a tough winter and a cold spring, the peony season can be delayed up to three weeks. As a result ofa decrease in supplyanddespite the possible price increase, farmers profitsin these yearsare reduced [6]. Recently, the possibility of peony cultivation in regions having a warm climate was reported [7,8]. In addition, in colder regions peonies can be forced towards early production of cut flowers under greenhouse conditions [9-11]. Cultivation of peonies under warmer conditions accelerates the flowering process and may provide an excellent early-market niche. However, an insufficient chilling period and not low enough soil temperatures will cause a slow dormancy release, poor stem elongation, and often flower abortions. Climate change may exacerbate these effects as soil temperature integrates all processes occurring at and above the soil surface [12]. In order to enhance the early forcing and improve the profitability of peonies growing under warmer conditions, in-depth knowledge of temperature requirements during various stages of its annual growing cycle is required.
In a previous study, the key relationships between chilling regimes and dormancy release, peony stem elongation and flowering were studied. The chilling requirements for dormancy release were determined in field-grown peony plants by exposing them to ambient winter-cold weather in northern Israel (8-10°C night, 16-26°C day, average ca. 17°C from November to February). The greenhouses were covered with plastic sheets at different dates, following the accumulation of chill units calculated according to Fishman et al. [12] and Erez et al. [13]. Flowering occurred two months following dormancy release [14].
For container-grown and artificially cooled peonies, chilling regimes of 2°C for 60 days ('Sarah Bernhard', 14) or 1-7°C for 3-12 weeks (‘Coral Sunset’, ‘Monsieur Jules Elie’, ‘Sarah Bernhardt’;) were identified [4]. The time until sprouting upon the completion of chilling treatments decreased with an increase in the duration of chilling treatments [7]. In Chinese varieties, stem height, flower size and flowering rate were also positively affected by chilling [15].
However, none of these studies provided a comprehensive database on the environmental regulation of peony development that would: a) enable following up single plants in different physiological stages; b) be large enough for statistical analysis; and c) be available for the scientific community.
Many reported greenhouse experiments for testing the effects of climatic conditions on plant development accounted for only a relatively small number of plants. The effect of environmental factors on the growth of Oxalis pes-caprae, a geophyte from Mediterranean regions, was studied on 80 plants grown in pots in a greenhouse [16]. The effect of day and night temperatures on the flowering of Phalaenopsis orchids was studied on 240 plants, also grown in a greenhouse, for different day and night temperature regimes [17]. Similarly, for fruit trees, usually the data of only a few dozen plants were available for determining dormancy conditions, estimating chilling models and comparing dormancy adaptation strategies [18,19].
The purpose of this study is threefold: (1) to introduce the database design that meets the need of the plant level research of the peony growth processes related to dormancy and its release; (2) to represent a collection of data on dormancy release requirements and stem elongation for herbaceous peony during the production cycle in the Mediterranean region, and make it available for other researchers to use; (3) to examine the diversity of these data collected for different chilling treatments and growth techniques, and to illustrate their utility for research on plant growth.
We sought to address the following specific research issues:
• The design and implementation of the data collection: a) in the stage of winter dormancy (temperature data); and b) following dormancy release, and during the stages of sprouting and stem elongation (phenological data).
• Development of a plant-level database describing interactions between environmental conditions and plant development.
• Statistical analysis of treatment differentiation.
• Demonstration of the effectiveness of the database for studying and predicting physiological responses of peonies to various environmental conditions during dormancy and following its release.
Addressing the above-formulated issues of the study became possible by using herbaceous peony as a subject of research. The study used a large sample of 2,232 plants of two different cultivars under diverse conditions of cold storage chambers, open fields and greenhouses a total of 14 treatments and plant growth techniques. We collected a large amount of data during dormancy and following its release at the plant level using electronic devices and visual observation. Using these data, we created a database in Excel for Windows accessible to other researchers.
To the best of our knowledge, this is the first reported database at the plant level for peony in particular and for geophytes in general. The database is available at http:// www.mop-zafon.org.il/files/DB18_Sept_2014.xlsx.
Overview of the experimental design
Winter dormancy, bud sprouting and stem elongation present the consecutive phases of the annual cycle of peony (Figure 1). Data from phases A (dormancy) and B (sprouting, stem elongation and flowering) were collected. Peony cultivars ‘Sarah Bernhardt’ (SB) and 'Duchesse de Nemours' (DN) were used.
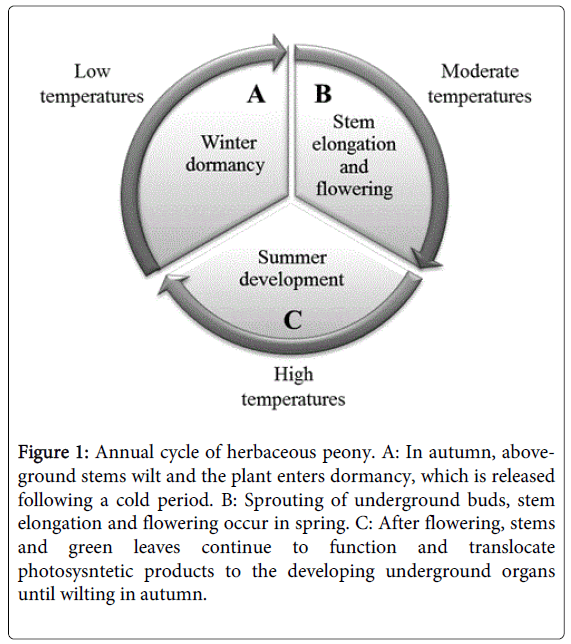
Figure 1: Annual cycle of herbaceous peony. A: In autumn, above-ground stems wilt and the plant enters dormancy, which is released following a cold period. B: Sprouting of underground buds, stem elongation and flowering occur in spring. C: After flowering, stems and green leaves continue to function and translocate photosysntetic products to the developing underground organs until wilting in autumn.
In March 2011, three-year old plants grown at the AvneiEitan experimental station (Northern R&D, Israel) were divided into propagation units. One thousand four hundred and forty units were planted in natural soil in tunnels in an open area. In October 2012, different chilling regimes for plants in tunnels were induced using thermal reflecting sheets and soil wetting. In addition, 792 plants were planted in 10 L containers and placed either in the tunnels or in cooling chambers at constant temperatures (for details, see Appendix A). Six containerized plants from each treatment were transferred to a greenhouse every week from the end of October 2012 to the end of February 2013. For peonies planted in natural soil, dormancy was broken at different dates by covering the tunnels with polyethylene sheets. Following dormancy release, six phenological parameters were measured once a week for each plant. Multiple chilling regimes and growth techniques, as well as calendar dates of the transition from phase A to phase B (Figure 1) enabled collecting diverse data on winter dormancy and spring phenology of peony.
Database design
The data collected were organized in an Excel database. During the dormancy period, air and soil temperatures were transferred from the temperature accumulation stations (Appendix A) into the database Excel file. In this article, soil temperatures at 5 cm depth were used for exemplary analyses and illustrations.
For each treatment, the collected temperature data enabled calculating coefficients of temperature variations and chill units.
A coefficient Tvar(k) of temperature variation from the beginning of the treatment to the end of week k was calculated as a sum of absolute values of temperature differences:
 (1)
(1)
where i is a running number of a 10-minute time interval, ti+1is the temperature at the end, and ti at the beginning of the i-th interval, and Nk is the number of such intervals for the first k weeks of treatment (Nk=1008.k). A chill unit Tr(k)for a week k and for a r-th temperature range with the lower bound Trl and the upper bound Tru was calculated as follows:
 (2)
(2)
Chill units are used in numerous chilling models of dormancy for fruit trees. A detailed survey of various modifications of these models explaining the effect of chilling and warm temperatures accumulated in different temperature ranges for specific trees and climate can be found in the study by Luedeling, et al. [19]. Contrary to chilling models for fruit trees based on air temperatures, soil temperatures in our study measured at a depth of 5 cm were used for calculating chill units. In addition, the chill units were calculated for every week k of the dormancy phase (maximal k equals 15 or 18 for different treatments in Supplementary Table A3), and not for the entire winter period, as in previously published reports. In our database, chilling units were calculated for 13 temperature ranges from lower than 3°C to higher than 27°C.
In fact, for every week of the dormancy phase, cumulative chill-heat units were calculated.
The database includes the following data tables, each of them stored in a separate spreadsheet:
• “Weeks” an auxiliary table for translating 10-minute intervals into numbers of weeks
• “Temperatures” records by 10-minute intervals
• “Phenology” by week intervals
• “Chill-Heat units” accumulated temperatures for 13 temperature ranges and temperature variation all these indices were accumulated by weeks of dormancy. This table relates to the Temperatures and Weeks tables (Figure 2).
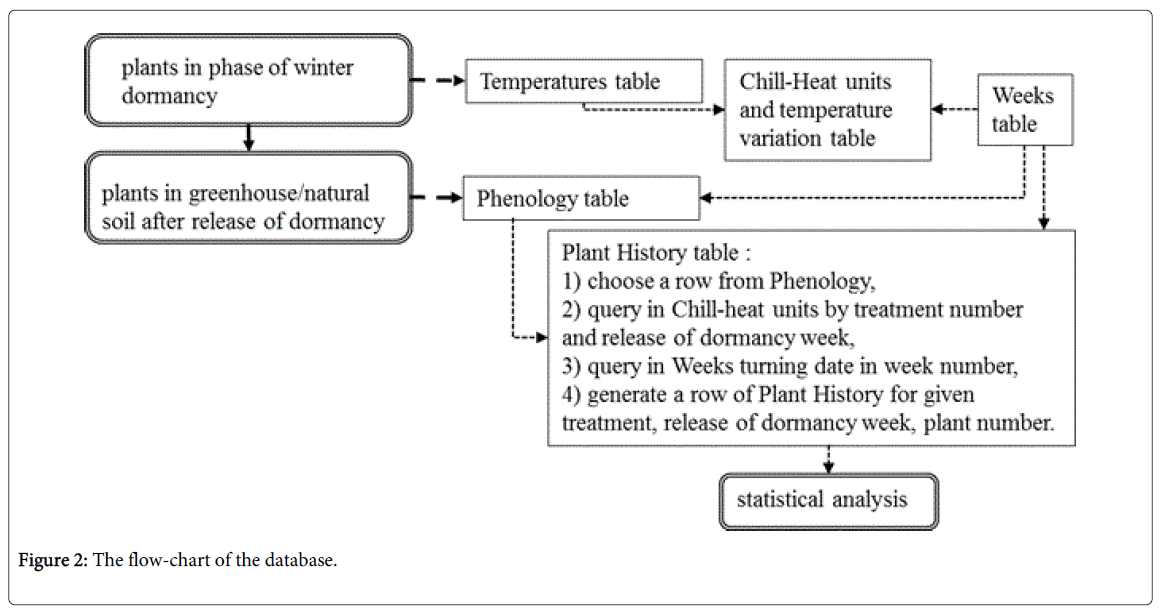
Figure 2: The flow-chart of the database.
• “Plant History” the main output of the database that enables describing phases of winter dormancy, sprouting (dormancy release) and stem elongation. For each plant, the corresponding row of this table relates to the temperatures in different weeks of its dormancy (from the Chill-Heat units table) and to its phenological data (from the Phenology table) (Figure 2). The Plant History table includes 28 fields relating to temperature ranges and phenological stages of plant development (Table 1).
The database is designed in MS Excel 2010 using spreadsheet functions VLOOKUP, COUNTIFS, SUMIF for combining data that relate to the same plant collected in different phases and weeks of measurement. Such organization of the output data can be convenient for mathematical modeling of geophytes development.
| Code | Definition | Table - data source |
|---|---|---|
| ID | Identification number of the measurement | |
| Date | Data of the measurement of phenological data | Phenology |
| Treatment | Treatment number from 1 to 10 | ditto |
| Release | Week number of the dormancy release | ditto |
| Week | Week number of the measurement of phenological data | Weeks |
| Plot | Plot number for plants grown in natural soil | Phenology |
| Variety | Name of the variety | ditto |
| Plant | Plant number in the same measurement: from 1 to 6 for plants in containers, from 1 to 12 for plants in natural soil | ditto |
| T51 | Temperature at 5 cm depth, in the range < 3°C | Chill-Heat units |
| T52 | In the range (3, 5) | ditto |
| T53 | In the range (5, 7) | ditto |
| T54 | In the range (7, 9) | ditto |
| T55 | In the range (9, 11) | ditto |
| T56 | In the range (11, 13) | ditto |
| T57 | In the range (13, 15) | ditto |
| T58 | In the range (15, 17) | ditto |
| T59 | In the range (17, 19) | ditto |
| T510 | In the range (19, 21) | ditto |
| T511 | In the range (21, 24) | ditto |
| T512 | In the range (24, 27) | ditto |
| T513 | In the range > 27 | ditto |
| Tvar | Coefficient of temperature variations | ditto |
| Sprout | Number of sprouts | Phenology |
| Height | Maximal height of sprouts, cm | ditto |
| Buds | Number of buds | ditto |
| Flowers | Number of flowers | ditto |
| Cutting | Cut flowers | ditto |
| Abortion | Buds abortion | ditto |
Table 1: Fields of the plant history table.
The database structure and relationships between the tables are shown in Figure 2. The Plant History table relates to the Chill-Heat units and Phenology tables. Each row in the Plant History table is generated for a given treatment, week of dormancy release and plant number, and comprises phenological data for all the weeks of the records.
Preliminary analysis of data collected
Analysis of treatment differentiation: For the data collected in both phases of plant development, the overall difference between treatments can be analyzed using the one-way analysis of variance (ANOVA). Then, in the case of positive results of this test (significant differences), the Tukey post-hoc test based on a multiple comparison procedure can be conducted for discriminating between treatments and dividing them into statistically homogeneous groups. Using records of the Chill-Heat units and Plant History tables, a comparison can be performed for each Chill-Heat unit and phenological index.
Analysis of stem elongation: We used sigmoid growth curves (the logistic curve and its generalizations) for the approximation of growth of peony stems. Richards [20] suggested that these functions could be useful for the empirical description of plant growth.
A specific growth rate SG of peony stems was defined as the rate of growth divided by stem height:
 (3)
(3)
Where H is the stem height and t is time (in weeks).
Under these assumptions and using the techniques first presented by Kaufmann [21], the following estimate of specific growth SG for the growth curves can be derived:
 (4)
(4)
Where H1 is a stem height at the beginning of the time interval (Δt= 1 week), and H2 is the height at the end of the time interval.
The growth rate (general) G of stems for each measurement was calculated as follows:
 (5)
(5)
Statistical analyses were conducted using SPSS (2011) and Microsoft Excel [22].
Once a week during the dormancy phase (20 weeks from the middle of October to the middle of March, under conditions in the tunnels), 1,008 records of 10-minute temperature data from each treatment were appended to the Temperatures table. The cumulative sums of temperature and coefficient of temperature variation were then calculated for the Chill-Heat units table, as shown in formulas (1) and (2). Following dormancy release, phenological parameters were recorded once a week during 15 weeks from the beginning of February to the middle of May 2013. Data on the number of sprouting buds and maximal length of stems and other phenological indices for plants of containers transferred to a greenhouse (treatments 1, 4-10) were appended to the Phenology table. In treatments 1-6, the same data were collected for the plants grown in natural soil. A section from the outcome of the Plant History table is shown in Figure 3.
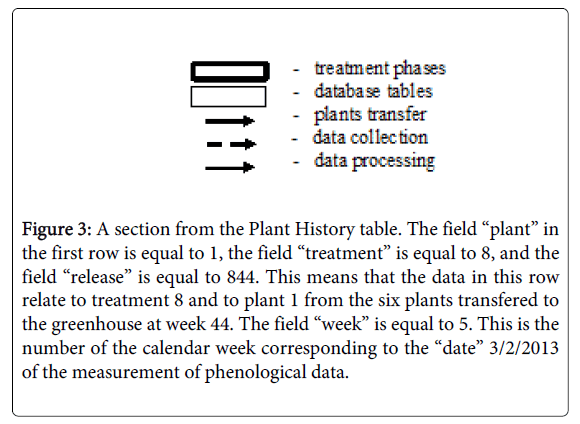
Figure 3: A section from the Plant History table. The field “plant” in the first row is equal to 1, the field “treatment” is equal to 8, and the field “release” is equal to 844. This means that the data in this row relate to treatment 8 and to plant 1 from the six plants transfered to the greenhouse at week 44. The field “week” is equal to 5. This is the number of the calendar week corresponding to the “date” 3/2/2013 of the measurement of phenological data.
A statistical summary of the data from both phases is presented in Appendix B, Table A4. The ANOVA test (not presented here) showed significant differences between the treatments for most indices of the calculated chill-heat units, temperature variation, number of sprouts and stem height. An example of distribution of one of these indices - mean height of stems - by treatments, and its standard errors is shown in Figure 4. This index ranged from 5.1 cm and 6.4 cm in treatments 9 and 5, respectively, to 35.8 cm in treatment 7 (and was close to zero in treatment 10 in a cooling chamber with a constant temperature of 20C).
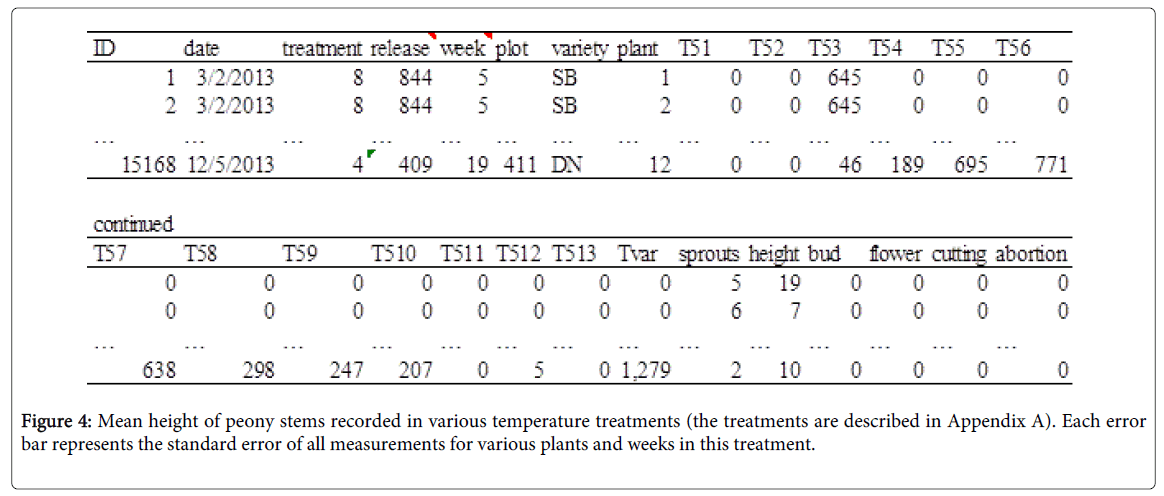
Figure 4: Mean height of peony stems recorded in various temperature treatments (the treatments are described in Appendix A). Each error bar represents the standard error of all measurements for various plants and weeks in this treatment.
Application of the Tukey test (significance level 5%) enabled examining treatment differentiation by identifying homogeneous groups of treatments for each of the aforementioned indices of temperature and phenology. For almost all of the indices, the number of homogeneous groups of treatments varied from 4 to 8 (from 10), most of them non-overlapping. Not one pair of treatments belonged to the same homogeneous groups for all temperature indices. A similar result was obtained for phenology indices of number of sprouts and stem height. These results show a significant treatment difference by temperature in the dormancy phase and by phenological indices in the stem elongation phase (Appendix C). This means that the temperature regimes and developmental parameters differed significantly for plants in each pair of treatments.
To demonstrate the effectiveness of the database for studying peony phenology in the stem elongation phase, a specific growth rate SG of peony stems was estimated using formula (4) and based on records from the Plant History table. For this purpose, we selected examples of plants for which the sigmoid behavior of their growth curves was expressed visually (Figure 5).
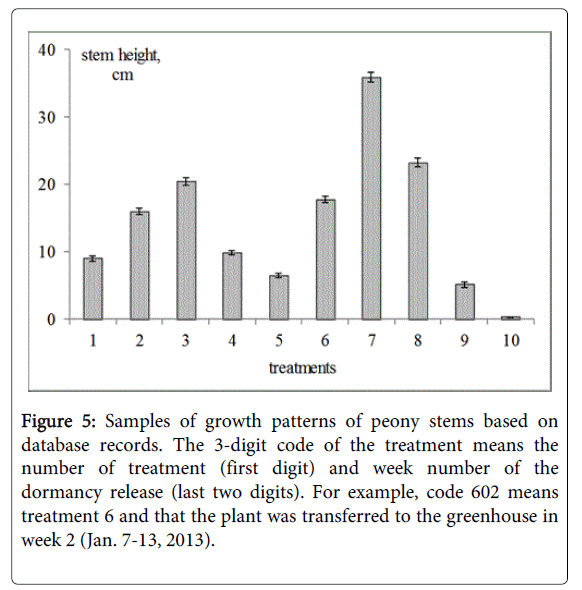
Figure 5: Samples of growth patterns of peony stems based on database records. The 3-digit code of the treatment means the number of treatment (first digit) and week number of the dormancy release (last two digits). For example, code 602 means treatment 6 and that the plant was transferred to the greenhouse in week 2 (Jan. 7-13, 2013).
This was correct for many plants from treatments 7, 8, 9 exposed to constant temperatures (2C, 6C, 10C, respectively) in cooling chambers. For treatment 7, for example, chilling for 2 weeks was enough for the sigmoid growth curve of plant 4 (treatment code 744). On the other hand, for the plants grown in natural soil, this elongation pattern was recorded for only some of the plants after 10 weeks of dormancy (treatment code 152) or even longer: treatment codes 101 and 501 11 weeks; treatment code 602 12 weeks; treatment code 404 14 weeks (Figure 5).
For each of the selected plants, specific growth rates SG for every week following dormancy release were calculated and averaged throughout the stem elongation period. Average specific growth rates SGav are shown for all plants in Figure 5. For certain plants, these average rates varied from 40% to 87%.
For each treatment, growth rate of stems G was calculated for each plant and averaged over all plants for the treatment and weeks of the stem elongation phase (Table 2). This index is in good agreement with the stem height distribution shown in Figure 5 and in the last column of Table 2 (the coefficient of correlation r=0.75 is statistically highly significant).
| Treatment | Average Growth Rate G, cm/week | 95% Confidence Interval for G | Mean Height, cm (the entire measurement period) |
|---|---|---|---|
| 1 | 1.36 | ± 0.145 | 9.0 |
| 2 | 4.7 | ± 0.242 | 15.9 |
| 3 | 3.98 | ± 0.169 | 20.4 |
| 4 | 1.32 | ± 0.175 | 9.9 |
| 5 | 1.06 | ± 0.136 | 6.5 |
| 6 | 0.73 | ± 0.061 | 17.8 |
| 7 | 4.2 | ± 0.150 | 35.8 |
| 8 | 3.08 | ± 0.160 | 23.2 |
| 9 | 1.01 | ± 0.122 | 5.1 |
| 10 | 0.14 | ± 0.089 | 0.3 |
Table 2: Growth rate of stems in various temperature treatments.
In this study, we present the database developed for studying the cultivation of herbaceous peony in a warm climate region with a deficiency of low temperatures for dormancy release. In total, 2,232 plants exposed to 14 temperature regimes were used as a source of the experimental data. The 10-minute measurements of soil temperature were collected in the database during the phase of winter dormancy prior to sprouting.
In the bud sprouting, stem elongation and flowering phase, phenological data for each plant studied were collected once a week (from 9 to 11 measurements for different treatments).
Overall, the database includes close to 600,000 values of temperature and more than 90,000 values of phenological data relating to specific plants for various treatments, dates of dormancy release and phenological records. This database and its design followed the design of the treatments and can be used for studying herbaceous peony and other geophytes in warm climate regions. Further development of this database will help to predict crop production processes on a commercial scale.
Similar to many fruit trees, perennial herbaceous plants, geophytes, as well as peony plants require a certain amount of cold, usually presented as “cold units,” for dormancy release. However, in studying peony, unlike trees, air temperature records from regional meteorological stations are not sufficient. The renewal buds of peony are located underground, and therefore apical meristems and roots are sensing soil temperature.
The approach used in the design of the database presented is in line with the results of many other studies on plant dormancy. Using soil temperatures measured in our database is similar to a certain extent to using air temperatures in chilling models for fruit trees dormancy: chill-heat units used in the Utah model and its modifications [23,24]. In our study, calculating chill-heat units for 13 ranges of temperatures (from lower than 3C to higher than 27C for a winter climate at the AvneiEitan station) enable modeling the negative effect of high temperatures similarly to dormancy of fruit trees in the studies of Erez [25] and Guerriero et al. [26]. The other opportunity could be using hourly data of minimum and maximum temperatures during the dormancy period (e.g., models from the studies of Aron [27], Orlandi et al. [28], Miranda et al. [29]. The temperature variability index calculated in our database can be useful for the future modeling of peony phenophases as it follows from the study by Eppich et al. [30] of climatic effects on the phenology of geophytes.
Using the database and the Tukey statistical test, we showed significantly different effects of temperature regimes on dormancy release for plants grown in containers (both in tunnels and in cooling chambers), as well as in natural soil (in tunnels). Phenological indices in the stem elongation phase were also significantly different among the various treatments. To enable future statistical estimation of the relationships between the two physiological phases of peony growth, the records relating to various treatments, plants and phases were organized in the combined Plant History table, which included more than 15,100 data records.
The practical value of the database presented for research purposes is the possible prediction of flower production in warm climate regions, as well as the use of greenhouse forcing. Further analysis of data accumulated in this research will enable the development of practical recommendations for artificial chilling treatments and growth techniques in commercial peony production. Therefore, the database that combines data from different physiological phases of a flower plant could be useful for developing decision-making tools aimed at ensuring the majority of a crop to be ready for harvest by a target date. It can help to increase the profitability of the crop, which depends on the date of sale and the length of the stems. Such a tool for an Easter lily crop (another geophyte flower with considerable economic potential) was developed by Fisher and Lieth [31].
The authors gratefully acknowledge Dr. Raffi Stern and Professor Moshe Reuveni for their professional advice.