International Journal of Advancements in Technology
Open Access
ISSN: 0976-4860
ISSN: 0976-4860
Case Report - (2019)Volume 10, Issue 3
The past decade has witnessed a substantial increase in the generation and storage of data through social media platforms. As a result, the analysis and comprehension of this vast pool of data have become crucial for gaining valuable insights across various domains, aiding researchers and businesses in making well-informed decisions. However, the sheer volume of data, its diverse origins with distinct formats and the rapid rate of generation pose significant challenges. These characteristics collectively contribute to the complexity and resource-intensive nature of extracting knowledge from this data. This paper's primary scientific contribution is the development of a social media data integration model, which is built on the framework of a data warehouse. The objective of this model is to mitigate the computational costs associated with data analysis while simultaneously facilitating the application of techniques aimed at uncovering meaningful insights.
In recent years, social media have undergone a transformative impact on online interaction and information exchange, with millions of users engaging regularly to share diverse digital content. The pervasive influence of social media has become an integral part of our daily lives, reshaping how we conduct business, connect with friends and family and explore job opportunities. The widespread adoption of social media is attributed to its user-friendly nature, providing global access regardless of age, profession or social status [1].
Individuals utilize social media platforms for various purposes, from personal communication and sharing life moments to businesses leveraging them for product promotion, real-time advertising and customer engagement. Recognizing the potential benefits, businesses have come to understand the value of assessing available data, including customer feedback, competitor product prices and service reviews, to make informed decisions [2]. Establishing a meaningful social media presence has become crucial for businesses aiming to foster lasting relationships with clients and partners.
However, the storage, pre-processing and analysis of social media data present significant challenges [3]. A data warehouse serves as a central repository, enabling organizations to store data from diverse sources. Businesses must comprehend the process of loading social media data into the data warehouse to enhance their online reputation and evaluate their impact effectively.
Social media analysis is a recent axis encompassing research topics in business intelligence, data analysis and information research. Social media data is extensively used for various analytical activities, including sales analysis, trend analysis, sentiment analysis and opinions or feeling analysis. Implementing and modeling a social media data warehouse can prove highly beneficial for businesses seeking to improve decision-making. Yet, few studies have focused on multidimensional modeling of data from social media. This paper aims to address this gap by modeling data extracted from Twitter and Facebook and developing a universal analytical platform for multidimensional storage, enabling ad-hoc analysis without predefined constraints.
The structure of this paper is organized as follows. The next section discusses related work, followed by an overview of the proposed model in section 3. Sections 4, 5 and 6 detail our contributions. Section 7 presents results and analyses from testing the multidimensional model on data extracted from tweets. Finally, section 8 concludes the paper, outlining main perspectives for future work.
Related work
As a relatively new source of data, social media has introduced a range of challenges in terms of data modeling and manipulation. The analysis of data derived from social media has become a burgeoning research area, giving rise to novel fields like social media analysis. Research in this domain can be broadly categorized into two groups: Those focusing on designing Data Warehouse (DW) models from a single social media platform (e.g. Twitter, Facebook) and those addressing the challenge of modeling data warehouse schema from two different social media platforms [4,5].
A notable body of work has concentrated on designing DW models specifically from Twitter [6,7]. Bringay, et al. pioneered the development of a multidimensional star model for analyzing tweets, focusing on a specific trend related to the evolution of diseases. Rehman, et al. proposed a comprehensive system for warehousing Twitter streams, encompassing layers for data extraction, transformation, loading, analysis and presentation [8]. Subsequent extensions integrated natural language processing for multidimensional social media analysis. Similarly, Cuzzocrea, et al. emphasized implicit information in tweets, presenting a multidimensional data model incorporating semantic and metadata dimensions [9].
Another set of studies expanded beyond Twitter, exploring distributed storage and parallel processing for large-scale event extraction from streaming social media data [10]. Storm and Hadoop were employed to process Twitter data and a snowflake schema modeled event data, linking Social Media Data Warehouse (SMDW) and Enterprise Data Warehouse (EDW) through a bridge table. Girsang, et al. introduced a Business Intelligence (BI) application dashboard utilizing a data warehouse to analyze news information gathered from Twitter.
Despite the growing interest in designing data warehouses from social media, few studies have focused on modeling schemas from two different social media platforms [11,12]. Moalla, et al. proposed a method for opinion analysis based on machine learning from various social media, integrating it into the ETL process. An extension in 2022 focused on building a DW for opinion analysis, presenting phases of data extraction, cleansing, transformation and analysis. Valencio, et al. introduced a constellation schema to model data from Facebook and Twitter, minimizing duplicate data and optimizing data mining algorithms.
Our work contributes to this landscape by leveraging data from two relevant social media platforms and developing a schema integration method for a unified data warehouse schema. The existing studies in this field have primarily emphasized data extraction and analysis, with limited attention to enabling decision-makers to manipulate the combined meta-data associated with posts. Therefore, our objective is to provide a generic multidimensional model dedicated to the content, metadata and social aspects of posts, accommodating structural and possibly semantic data while remaining independent of predefined special needs."
Overview of the proposed approach
To establish a data warehouse design approach for social media, we propose a systematic five-step process (Figure 1):
• Data extraction and cleaning
• Data mapping
• Multidimensional schema design
• Transforming and loading
• Reporting and querying
Following that, we will elaborate on each of these steps.
Data extraction and cleaning: Our objective is to scrutinize data obtained from diverse origins, including photos, links, videos and status updates, sourced from both a Facebook page and tweets posted on a Twitter account. To accomplish this, we initiate the process by gathering data from Facebook through the graph API and from Twitter utilizing the accessible APIs. Subsequently, we conduct a cleaning phase to sift through the collected data, excluding irrelevant entries, addressing inconsistencies and eliminating any duplicated information.
Data mapping: As the data is obtained from multiple sources, it is essential to perform a mapping step. This involves identifying the relationships between the data extracted from Facebook and the data retrieved from Twitter, to identify any equivalence or synonymies between the data. This task is usually carried out either manually or semi-automatically, which can make it a costly process.

Figure 1: Functional view of the overall warehousing process.
Multidimensional schema design: During this stage, we delineate the multidimensional schema of the data warehouse, drawing insights from the extracted data. The process encompasses two pivotal steps: Subject analysis and the identification of multidimensional concepts.
Transforming and loading: This step takes care of capturing the original data stream, bringing it into a format compliant with the target database and feeding automatically the various components of the multidimensional model (fact, dimensions and parameters) issued from the Twitter and Facebook.
Reporting and querying: Once the multidimensional model is generated and loaded with data, the decision maker can perform OLAP analyses on tweets using the OLAP tool offered by the implementation platform (e.g. oracle discoverer).
In the upcoming sections, we will provide an in-depth explanation of the multidimensional concepts used to design the data warehouse schema. We will also discuss the initial data extraction and cleaning process. Finally, we will present the data mapping procedure and the multidimensional schema design.
Data extraction and cleaning
Data extraction and cleaning are crucial steps in obtaining useful insights from social media platforms such as Facebook and Twitter. With billions of active users on these platforms, extracting relevant data can be a daunting task, but it is essential for businesses and researchers to make informed decisions. Therefore, it is important to prioritize data extraction and cleaning to ensure reliable and accurate data for analysis.
During the initial stage, we gathered general information about the Facebook page, including its ID, name, website, description, category and other relevant details. Similarly, we collected general information about the Twitter account, such as its ID, name, screen name, location, followers count and friends count. After that, we extracted information about the posts and tweets, including their respective ID’s, messages, creation dates, comments, likes, number of shares, re-tweet count, favorite count and language. The dataset generated was semi-structured and formatted using the JavaScript Object Notation (JSON). The extraction process involves creating an application to access the available APIs and select the appropriate data access permissions. In the data warehouse, data cleansing was performed in the second stage to ensure accurate and consistent data, eliminate duplicate information and consolidate various data representations. The decision-maker participated in this step to select relevant data.
Hence, we examined all the extracted data in order to judge those that could be potentially useful for OLAP analysis. Following this review, we excluded some data which we considered a bit useful or even useless such as data describing the user profile (e.g. User profile's photo, background image chosen by the user for his own twitter page, colors for characters and bars).
Data mapping from social media
As the data is drawn from diverse social media channels, the mapping phase is critical. This step involves the alignment of the data with a standardized format, enabling it to be integrated into a coherent data warehouse. Proper mapping helps to ensure that the data can be effectively analyzed, which is essential for making informed decisions. Without proper mapping, the data may be incomplete, inconsistent or incompatible, rendering it unusable for analytical purposes. As a result, the mapping process is a vital step in the data integration pipeline, facilitating the creation of a unified and high-quality data warehouse. Thus, it is possible to obtain similar information from both Facebook and Twitter. However, it is also likely to find information in one platform that is not present in the other. To address this issue of inconsistency and redundancy in the data, we propose using a mapping step. This step involves integrating data from both sources to ensure that there is no duplication or missing information. To achieve this, we utilized data extracted from Facebook pages and Twitter accounts. We observed two types of heterogeneity: Structural and semantic. To address structural heterogeneity, we mapped the schemas from both platforms using custom scripts with programming languages java. The retrieved data needs to be transformed and mapped to ensure consistency and relevance. This step involves handling differences in data formats, converting timestamps and aligning user profiles, posts, tweets, likes, comments and other interactions between the two platforms. While there is some overlap between the attributes that Facebook and Twitter use to describe user profiles and content, there are also some differences. Here is a general mapping of some of the key attributes for Facebook and Twitter:
Profile picture: Both Facebook and Twitter allow users to upload a profile picture, which is a small image that appears next to the user's name or handle.
Cover photo/Banner image: Facebook and Twitter both allow users to upload a larger banner image or cover photo that appears at the top of their profile or page.
Bio/About: Both platforms provide a section where users can write a short description of themselves or their business.
Location: Facebook and Twitter both allow users to specify their location or hometown.
Interests: Facebook provides a section where users can list their interests, while Twitter does not have a dedicated field for this. However, users can indicate their interests by following relevant accounts and using hashtags related to their interests.
Followers/Friends: Twitter refers to people who follow an account as "followers," while Facebook refers to them as "friends." Both platforms allow users to connect with other users and see their updates.
Likes/Favorites: Facebook allows users to "like" content posted by others, while Twitter allows users to "favorite" tweets.
Comments/Replies: Both platforms allow users to comment on or reply to content posted by others.
Hashtags: While both platforms support the use of hashtags, they are more commonly used on Twitter as a way to categorize content and make it more discoverable.
According to the state-of-art, the three possible semantics are: Identical, equivalent and complementary. Such relationships represent a way to integrate the data in the DW. Each of these relationships plays a crucial role in understanding and categorizing the connections between various elements in our dataset. By discerning and leveraging these semantic relations, we aim to enhance the efficiency and accuracy of our data analysis, enabling us to draw meaningful insights and make informed decisions based on the underlying relationships among the elements. Attributes that have the same name and meaning are considered identical, while attributes with different names but the same meaning are considered equivalent. Complementary attributes have no relationship and provide additional information specific to one platform.
Using the proposed semantic relations, we created a mapping table that links the data extracted from Facebook and Twitter for both general information and information related to individual posts and tweets. Table 1 displays a sample of the mapping table that we developed specifically for the general information.
The first column of the table displays the attributes related to general information extracted from the Facebook page, whereas the second column shows the corresponding attributes obtained from the Twitter account. The third column provides a description of the semantic relations between these attributes.
| Attributes Facebook | Attributes Twitter | Semantic relation |
|---|---|---|
| ID | ID | Identical |
| Description | Description | Identical |
| Likes | Favorite-count | Equivalent |
| Username | Screen-name | Equivalent |
| Creation date | Created-at | Equivalent |
| Website | URL | Equivalent |
| Location | Location | Equivalent |
| Hashtags | Hashtags | Equivalent |
| Friends-count | Followers-count | Equivalent |
| Comments | Replies | Equivalent |
| - | Location | Complementary |
| - | Friends-count | Complementary |
| Birthday | - | Complementary |
Table 1: Mapping table.
Understanding these differences and similarities is crucial for businesses and researchers looking to make informed decisions based on social media analytics. For example, if a business is looking to expand its reach and grow its customer base, it may want to focus on increasing its number of followers on Twitter. Alternatively, if a researcher is looking to study social media sentiment on a specific topic, they may want to track the use of specific hashtags across both Facebook and Twitter.
Overall, mapping between Facebook attributes and Twitter attributes can help users tailor their social media strategies to each platform and make more informed decisions based on social media analytics. By understanding the similarities and differences between the attributes of each platform, users can extract and clean data more efficiently, optimize their social media presence and drive better results for their business or research.
Multidimensional schema concepts
Referring to our multidimensional model dedicated to the On- Line Analytical Processing (OLAP) of data exchanged through social media, our motivation example is built upon the tweet constellation‘ proposed in Ben Kraiem, et al. [13].
To perform a complete analysis on data extracted from Twitter and Facebook, we propose a constellation composed of two facts: User-activity and a reflexive fact called post activity.
User-activity-fact: Corresponds to observations on user accounts and allows the analysis of the user activity over time. It contains data about the connections between users, such as friend/ follower relationships. This fact could be used to track the growth of user networks over time. For this fact we define the two numerical measures as follows:
• Post_C: Number of posts of a user.
• Fre_C: Number of followings.
Post-opinion-fact: It is a reflexive fact. It models links between a post and the person concerned by the answer (answered person) and then allows participants and other readers to easily follow the exchange of posts (Figure 2). Being reflexive, it links instances of the same entity. It is composed of:
• The content posted by users, such as text, images and videos.
• A measure of type list of elements (Hashtags).
• Three numeric measures: Nb-Sha-Retw characterizing the number of times a post was re-tweeted or the number of times the post was shared and to indicate the degree of importance of exchanged posts,Nb-Lik-Fav characterizing the number of times the fans have clicked on the button like of post or tweet,Nb-Com-Tw characterizing the number of times the users have written comments on post or status.
This fact directly involves opinion analysis, where Data Mining (DM) algorithms play a vital role in extracting valuable insights and predicting trends. Through the application of these algorithms, we can uncover useful information and categorize posts based on their sentiment, identifying whether they are positive, negative or neutral. This enables a deeper study of user sentiments, allowing us to pinpoint the most positive, negative and neutral posts. The analysis of such sentiments provides valuable knowledge for businesses and organizations to make informed decisions, improve customer experiences and stay attuned to the ever-changing social media landscape.
While loading dimension records that we have set for the modeling of social media data, we can identify four dimensions:
Users: Contains the primary key for each user along with their name, email address and any other personal information.
Place: Contains geographic location data such as country, state, city and zip code. This dimension could be used to link users to their respective locations.
Time: Contains time-related data such as year, month, day and hour. This dimension could be used to track trends in user activity over time.
Source: Contains information about the source of data, such as whether it was collected from Facebook or Twitter.
Figure 2 depicts the proposed multidimensional model extended with some specifics and enriched with these extensions. The cardinality 0 of a reflexive fact means that a post is not necessarily an answer to another tweet or the post was not shared. The second specificity is relative to the possibility of having posts without any associated locality (absence of the place dimension). This aspect is taken into account by our model. Indeed, we defined a relationship of type 1:0 between the fact post-activity and the place dimension. This occurs when the user did not allow, during the configuration of his account, the identification of the place which he associated with posts.

Figure 2: Multidimensional constellation schema dedicated for the OLAP of Twitter and Facebook.
To assess the effectiveness of our methodology we have created a software prototype called OLAP4SocMed. This prototype was developed using JAVA and utilizes an ORACLE 10 g database, known for providing a stable and reliable environment for handling data.
For our experiments, we consider the dataset obtained for the final show of The Voice France (a French music talent show for aspiring singer's broadcasts by TF1 TV) which was held on June 3, 2023 at 18:00 GMT. We were able to crawl about half a million posts encompassing (501.500 posts) 3 hours starting from the beginning of the final show and collected from Twitter and Facebook. These posts are written in different languages (Figure 3).

Figure 3: Example of post published on Facebook and Twitter.
Once the data warehouse has been populated with values, OLAP queries could be executed. We now demonstrate the power of applying OLAP when solving specific social mediarelated analysis tasks. We start by studying the distribution of the loaded posts per language. For language recognition, we have used language detection APIs, the one offered by JSON. When detected, the language information can be used for analysis and aggregation (Figure 4).

Figure 4: Distribution of tweets per language.
The decision maker is now interested in the variation of the number of users by their location. The results of this query are illustrated in Figure 5.
Based on this figure, we find that there is a significant number of users tend to post comments on social media from the France and US regions.

Figure 5: Best locations per number of users.
The content of each post field is fundamental for the semantic analysis as they deliver valuable information about users and their opinions. We have used AlchemyAPI to semantically analyze the tweet-content. Table 2 shows the distribution of results for the sentiment analysis performed on the dataset of our experiment. Figure 6 depicts sentiments across the top contestants with a variety of talents during the final show.
| Sentiment | Post count |
|---|---|
| Negative | 39,532 |
| Neutral | 71,247 |
| No sentiment | 65,996 |
| Positive | 324,725 |
Table 2: Sentiment analysis statistics.

Figure 6: Sentiment distribution for top contestants during the final show.
To verify the developed environment, we implemented the DW model described in as a point of reference. A thorough comparison between our approach and the DW approach proposed by Valêncio, et al. was carried out to assess the efficacy of each method in enabling valuable knowledge discovery through the utilization of data mining techniques.
The data mining algorithms were employed within each data warehouse using the software WEKA. These algorithms represent established techniques for extracting pertinent and valuable insights from data, as per the current state-of-the-art [14,15].
For experiment 1, the focus was on the utilization of the Naive Bayes (NB) algorithm. This algorithm was applied to categorize opinions from both Data Warehouses (DWs), utilizing the source of the post as a label. The classifier operates as a supervised method that, once trained, has the capability to deduce the social media platform from which a given piece of data originates. In order to assess the validity of the results, various metrics were taken into account: Execution time measured in seconds, accuracy (as described by Equation 1), precision (defined by Equation 2) and recall (expressed in Equation 3). These evaluation metrics were chosen in alignment with similar methodologies employed in related research within the scientific literature [16]. In the aforementioned equations, TP, FP, TN and FN correspond to the counts of true positive results, false positive results, true negative results and false negative results, respectively.
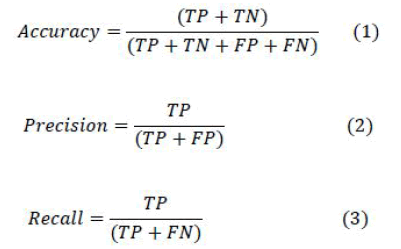
Table 3 presents the obtained results. DW M represents the proposed data warehouse and DW V represents the data warehouse proposed by Valencio, et al.
| Metric | DW M | DW V |
|---|---|---|
| Execution time (s) | 35.8 | 102.49 |
| Accuracy (%) | 98.4 | 96.3 |
| Precision (%) | 97.1 | 98.4 |
| Recall (%) | 98.4 | 97.2 |
Table 3: Naive bayes results.
All experiments conducted over our approach have finished the execution in less than 30 seconds. On the other hand, the DW designed by Valencio, et al. reached times greater than 100 sec. In terms of quality, the four experiments confirmed that the designed DW brought improvement. An important property is the problem of absence of pattern in modeling the DW. Those DW are highly variable depending on the context. The approach to build them depends on a specific problem. In addition, most of the literature works deals on building a model only for one social media. The model proposed by Valencio, et al. had some issues related to the data redundancy. Still, it was taking into account only the business rules. With this approach, DM algorithms had their performance and quality prejudice, as shown in this paper. According to the algorithm used in experiment 1, the data organized in the developed model was better. In this experiment, the results showed a higher accuracy and higher recall. The precision, yet, is better in the DW presented by presented by Valencio, et al. it means it was better in classifying the true positives, but it doesn‘t take into account the true negatives [17].
Experiment 2 was executed utilizing the K-means algorithm, which was applied for clustering the data based on the source of the posts as labels. In this context, the value of K was defined as two, given the existence of only two potential social media platforms. The Euclidean distance metric was employed for this purpose. The evaluation encompassed an analysis of execution time measured in seconds, classification error rate and the count of interactions, as per the approach outlined by [18]. In fact, experiment 2 aimed to compare the data clustering proficiency of both Data Warehouses (DWs) based on the origin of opinions. The outcomes of this technique are presented in Table 4. To compute the error, the origin of the opinion was provided as input [19].
| Metric | DW M | DW V |
|---|---|---|
| Execution time (s) | 0. 3000 | 2.28 |
| Error (%) | 32.3571 | 57.2147 |
| Number of interactions | 24 | 64 |
Table 4: K-means results.
In experiment 2, the clustering technique yielded superior outcomes. Both performance and quality exhibited improvements. The results underscore that the algorithm excelled in partitioning the organized data derived from the developed model. Furthermore, the reduced error value was accompanied by a notably diminished computational cost in terms of iteration count, which was three times lower [20,21].
In this paper, we applied the data warehousing technology to enable comprehensive analysis of massive data volumes generated by the Twitter and Facebook.
Our approach involved three key steps, the first of which was focused on data extraction and cleaning from social media platforms. Once we had extracted the data, we encountered the challenge of structural heterogeneity between source schemas. To address this issue, we developed a mapping process that allowed us to map the data from different sources onto a common schema. This involved identifying common data attributes across sources and mapping them to a standardized format. The next step involved designing a multidimensional schema for the data warehouse, which allowed us to structure the data in a way that facilitated analysis and reporting. This involved identifying key dimensions, such as time, location and user and organizing the data according to these dimensions. Finally, we created a multidimensional conceptual schema specific to social media data. This schema incorporated the mapping process we had developed earlier, as well as the dimensions and measures we had identified during the multidimensional schema design process. This allowed us to create a comprehensive and flexible data warehouse that could support a wide range of analysis and reporting tasks. Our conducted experiments demonstrated that our model is proficient in aiding analysts during the decision-making process, offering the advantage of swifter execution compared to related works.
Several perspectives for this work are possible. We suggest considering the implementation of a NoSQL database to handle issues concerning both the scarcity and the excess of attributes. Additionally, it would be valuable to explore the adaptation of the Data Warehouse (DW) to encompass content from various other social networks. This step holds significance despite the prevailing trend in related research, which predominantly focuses on individual platforms.
Citation: Kraiem MB, Feki J, Ravat F (2025) Data Warehouse Design to Support Social Media Analysis: The Case of Twitter and Facebook. Int J Adv Technol. 16:324.
Received: 26-Dec-2023, Manuscript No. IJOAT-23-28653; Editor assigned: 28-Dec-2023, Pre QC No. IJOAT-23-28653 (PQ); Reviewed: 11-Jan-2024, QC No. IJOAT-23-28653; Revised: 16-Jan-2025, Manuscript No. IJOAT-23-28653 (R); Published: 23-Dec-2025 , DOI: 10.35841/0976-4860.25.16.324
Copyright: © 2025 Kraiem MB, et al. This is an open-access article distributed under the terms of the Creative Commons Attribution License, which permits unrestricted use, distribution, and reproduction in any medium, provided the original author and source are credited.