Journal of Geology & Geophysics
Open Access
ISSN: 2381-8719
ISSN: 2381-8719
Research Article - (2015) Volume 4, Issue 5
In the present study, were explored enhancement of chlorophyll-a (Chl-a) concentration after the passage of cyclone in the Bay of Bengal. Multi-satellite observations and vertical profiles from Argo floats were used. Low Chl-a concentration, high sea surface temperature (SST) and sea surface height (SSH) was identified before the passage of the cyclone at coastal Andhra Pradesh. After the passage of cyclone there is drastic change in chl-a (7 mg/m3) was observed along with low SST and SSH. This uptake of nutrient flux by cyclone induced upwelling along the Andhra coast has the potential to support new production.
Keywords: Cyclone; Sea surface temperature; Chlorophyll-a; Sea surface height
Tropical cyclone is an enormously strong wind event, which can have dramatic effects on the upper ocean. Cyclone induced winds can cause entrainment, strong vertical mixing, and upwelling, as well as the cooling of near surface water on the right-hand side of the storm track. The most apparent effect of a tropical cyclone on the upper ocean is the marked cooling of sea surface temperature (SST). The SST effects can be categorized into (positive) direct and (negative) feedback effects. Clearly, the underlying warm ocean surface is an energy source for tropical cyclogenesis in the form of surface heat fluxes [1-3]. As cyclone intensifies, the increasing wind speed may increase evaporation and supply the cyclone with the necessary source of heat for further intensification. However, the significant SST reduction induced by the increasing wind speed leads to reduced air-sea fluxes thus decreasing the cyclone intensity [4-10]. As tropical cyclones proliferate under the sway of large-scale flows, the ocean surface wind stress on the right side of the track increases, leading to the entrainment of cold water from the underlying thermocline into the ocean mixed layer and then a decrease in SST [11,12]. It is well know phenomena since 1960s [13]. Observational studies have showed that some cyclones (Category 4 or 5 on Saffir-Simpson Scale) can spawn an SST decrease up to 6°C [14]. Sakaida et al.[15] even reported a maximum of 9°C SST cooling after the passage of a typhoon. Several studies have designated that the magnitude of the SST cooling is strongly dependent on the tropical cyclone intensity, translation speed and the oceanic mixed-layer depth [16-19]. The goal of the present study is the scales of upper ocean thermal and momentum response due to the passage of tropical cyclones by using merged microwave satellite observations and Argo profiles.
The cyclone track data used in this study were available from the India Meteorological Department (www.imd.gov.in) and Unisys Weather Web site (http://www.weather.unisys.com), which was based on the best hurricane track data issued from the Joint Typhoon Warning Center (JTWC). The data include the maximum sustained surface wind speed and the location of the cyclone center every 6 hours during 11- 16 December 2003. The main region to choose the cyclone 03B was because of its intensity (55 knots) when it cross the coast.
The following satellite products are used in the present study. The merged microwave product of daily sea surface temperature with a spatial resolution of 25 km was acquired based on Tropical Rain Measuring Mission (TRMM) Microwave Imager (TMI) and the Advanced Microwave Scanning Radiometer-EOS (AMSRE). These two satellites have together can overcome influence of cloudy conditions during cyclones [19]. Therefore, this product can provide continuous SST observations with a better resolution before, during and after a cyclone. This data product is produced and distributed by Remote Sensing Systems (www.remss.com). Daily wind speed data was obtained from QuickSCAT satellite with a spatial resolution 25 km during the cyclone period (www.remss.com). Weekly chlorophyll-a concentration data with 4 km spatial resolution was obtained from IRS-P4 OCM sensor was produced and distributed by Indian National Centre for Ocean information Services (www.incos.gov.in) with the collaboration of the Indian Space Research Organization (ISRO).
Nearly more than 650 profiling floats has launched since 2000 in the Indian Ocean under International Argo program. They record temperature and salinity between the surface and 1000~2000 m every 10 days. In this study I utilize the profile data during 10-20 December 2003 from the Indian National Centre for Ocean Information Services (INCOIS). In order to examine the change of the mixed layer temperature (hereafter MLT) and MLD. T/S profiles before, during and after a cyclone passage are paired off, if they met the criteria: both profiles of the pair had to be within 200 km of the center of a hurricane, profiles (5-10 days apart in time) were collected within a time window defined as 5 days from when the cyclone passed. The mixed layer was defined as the layer whose temperature differs from the SST by less than 0.3°C [20].
After the passage of cyclone 03B along the coastal Andhra Pradesh decrease in the sea surface temperature, sea surface height and enhancement in chlorophyll-a (Chl-a) was observed. The SST cooling and SSH are shown in Figure 1. The SST is warming (>26.5°C) in the south Bay of Bengal ahead of (11Dec03) cyclone 03B (Figure 1). But it is lower than the climatological (1985-2002) SST value at this region. After the passage of the Cyclone 03B, the SST is plunge quickly by much more than 1°C; roughly coincide with the areas of strong winds. Thus, strong wind forcing by the cyclone appeared to bring colder waters from below the mixed layer depth to surface by vertical mixing and upwelling [8]. An ample coastal upwelling at coastal Andhra Pradesh, which is shown in Figure 1. And also the SSH is decreased upto 2.5 cm at this location. The changes in SSH was matchin with the corresponding sea surface cooling patch in terms of location and time. Nevertheless, the decreased in SSH (~ 50 cm) was much deeper than that after the passage of cyclone (~ 47 cm). During the cyclone period the SSH is high at the centre with a spatial extent of 75 km.
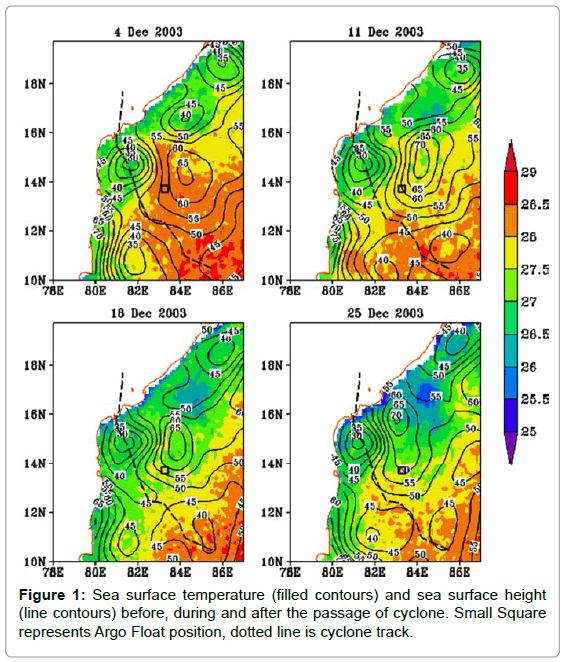
Figure 1: Sea surface temperature (filled contours) and sea surface height (line contours) before, during and after the passage of cyclone. Small Square represents Argo Float position, dotted line is cyclone track.
Chl-a concentration were <0.45 mg/m3 prior to cyclone passage (Figure 2). It is increase to a propos 1.78 mg/m3 during the cyclone period. At the right side of the cyclone track near coastal Andhra Pradesh Chl-a concentration was increased upto 7 mg/m3 after the passage of cyclone. This enhancement is coupled with sea surface cooling at the right side of the cyclone track. Cyclone 03B is crossed the land at sever cyclonic storm intensity because of that the enhancement is also more at central east coast of India.
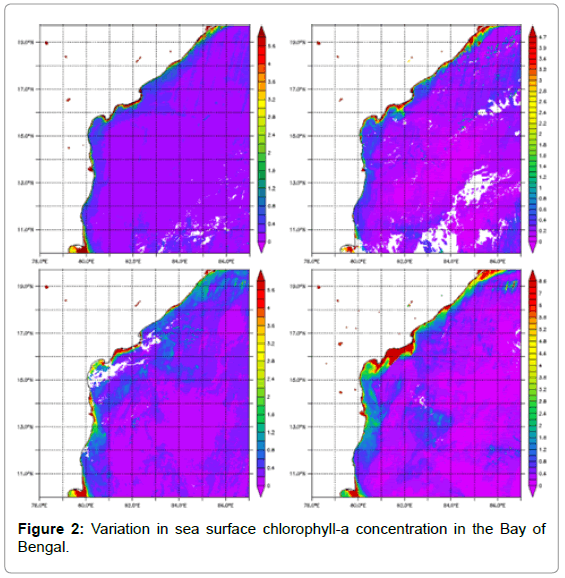
Figure 2: Variation in sea surface chlorophyll-a concentration in the Bay of Bengal.
Vertical profile of temperature and salinity showed clear changes before and after cyclone 03B (Figure 3). The mixed layer depth (MLD) was about 61.81 m on 11 December with high SST of 28.5°C; during cyclone is 66.23 m on 15 December with decrease in SST (27.8°C); after cyclone it deepened to 73.28 m on 20 December with low SST of 27.5°C. Barrier layers, which are common in the tropical ocean surface, were found drastic changes before, during and after the cyclone.
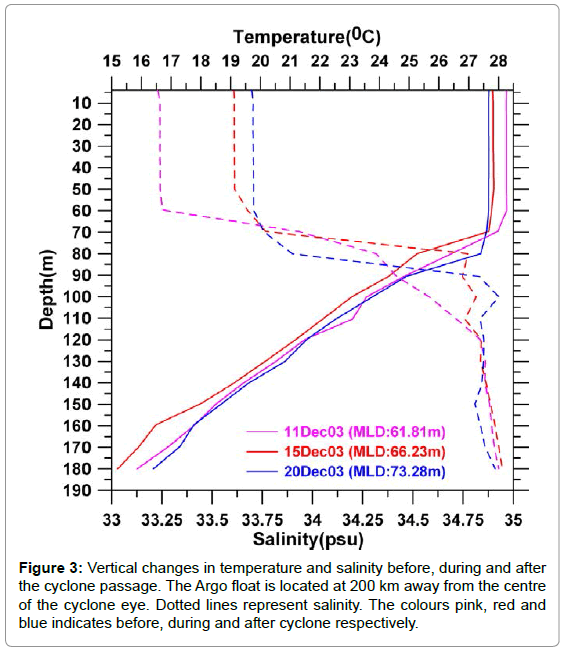
Figure 3: Vertical changes in temperature and salinity before, during and after the cyclone passage. The Argo float is located at 200 km away from the centre of the cyclone eye. Dotted lines represent salinity. The colours pink, red and blue indicates before, during and after cyclone respectively.
In abridgment, the upper ocean changes to cyclone 03B are explored by multi satellite observations of physical and biological parameters and Argo floats. A farthest cooling area is observed near coastal Andhra Pradesh after the passage of cyclone 03B. The discrepancy in Chl-a along the coastal Andhra Pradesh before and after a cyclone was related to strong cyclone-induced upwelling. Effect of Cyclone 03B protracted time of phytoplankton give the impression as important as that of their intensities, due to longer action time of upwelling and mixing timbres produced by the cyclones. By combining the satellite observations coastal upwelling is dominated near the coast. The vertical profiles at 200 km away from the eye of the cyclone 03B also shows changes in the upper layers of the ocean, but it is far away from the coastal upwelling area.
This study entails that to imminent the ocean surface responses to cyclone, the changes in subsurface layer dynamics need to be analysed via both the in situ, satellite observations and the physical (like ROMS, POM etc.,) and biological (Nemo, Ecosystem etc.,) models.
The present research work is supported through funding received from the Department of Science and Technology, Govt. of India under the Fast Track Young Scientist Project (SR/FTP/ES-09/2008) which is gratefully acknowledged. I am very much thankful to the Director, Indian National Centre for Ocean information Services for providing the OCM and Argo data. I am also thankful to the India Meteorological Department, New Delhi and Joint Typhoon Warning Center for the cyclone track data and also Remote Sensing Systems for the Sea surface temperature and Sea Winds (Quik SCAT) data. My sincere thanks to the anonymous reviewers for their constructive comments.