Endocrinology & Metabolic Syndrome
Open Access
ISSN: 2161-1017
ISSN: 2161-1017
Research Article - (2018) Volume 7, Issue 1
Background: Cardiovascular diseases have been the leading cause for mortality in the last decades. Controlling the modifiable cardiovascular risk factors may reduce mortality due to them. In this context, we tried to identify some of these cardiovascular risk factors in representative population of Casablanca.
Methods: Our study concerned 609 subjects (363 women and 246 men) that were aged from 18 to 65 years old. The analyses were based on data from a lifestyle questionnaire with sociodemographic characteristics, medical history and lifestyle factors such as physical activity and smoking. We also assessed Anthropometric measurements and biochemical. Then, our population was subdivided into 3 groups according to their Body Mass Index: Obese, overweight and a normal group.
Results: The analysis showed that the mean-age was 54.47 ± 10.89 years old and 59.86% were female. The prevalence of diabetes and hypertension were respectively 38.1% and 35.8% with a dominance of women. The highest atherogenic index of plasma (AIP) was observed in overweight and obese groups with 31.1%, 28.2% respectively. The prevalence of hypercholesterolemia was 7.1 %. We notice that 35.20%, 13.98% and 1.81% have respectively 3 ,4 and 5 Cardiovascular disease risk factors whereas 5.26% have none, we observed too that women have more (59.7% vs. 40.3%).
Conclusion: There is a high prevalence of cardiovascular risk factors in the general population of Casablanca, which is due to unhealthy habits like sedentary life style, Diabetes and/or Hypertension.
Keywords: Cardiovascular risk factors; Prevalence; Diabetes; Hypertension; Smoking; Physical activity
During the last decades and till now, cardiovascular diseases (CVD) have been the leading cause of mortality all over the world. In 2012, About 36 million deaths were recorded to be due to non-communicable diseases where 17.5 million are linked to CVD a number that is expected to grow to more than 23.6 million by 2030 [1]. In Morocco, as in most developing countries, CVD were responsible for 30.4% mortality (first cause of mortality) [2].
Numerous epidemiological and clinical studies have clearly established that the high prevalence of CVD is owing to many factors that can be divided into two major categories physiological and behavioral risk factors, that are multifactorial, unchangeable ones (Age, sex, familial history…) and alterable ones (Diabetes, dyslipidemia, smoking, sedentary lifestyle) [3].
Worldwide, Cardiovascular risk factors (CVRF) prevalence is increasing in a rapid rate [4]. Foremost, the World Health Organization (WHO) has estimated that more than 1.9 billion adults, 18 years and older, were overweight. Of these over 650 million were obese, in 2016 [5]. Furthermore, the prevalence of diabetes have been steadily increasing over the past few decades it has nearly doubled since 1980, rising from 4.7% to 8.5% in the adult population [6].
WHO noted that CVD has no geographic, socioeconomic, or sex boundaries. It is estimated that, far from being confined to the most developed countries CVD is the leading cause of death in developing countries as well [7], where the percentage (80%) of the deaths due to CVD occurs, not only they are grappling with increasing rates, they still face the scourges of poor nutrition and infectious diseases. In spite of that, with the exception of sub-Saharan Africa, cardiovascular disease is the major cause of deaths in the developing world. People with risk factors may not develop cardiovascular disease, but the more risk factors you have the more chance you will develop a CVD [8].
The European Guidelines on CVD prevention in clinical practice 2012 (ESC 2012) [9] provides recommendations to reduce CVD risk: Quit smoking, regular physical activity, eat a healthy diet, limit alcohol consumption, reduce body weight, reduce blood pressure (BP) and control blood lipids. Men and women with established CVD are at very high risk for future events and prompt interventions on risk factors are recommended. However, CVD risk factors often remain uncontrolled [10,11].
Morocco is a Mediterranean country that has known much development in the last decades, and which is not an exception of the CVD. In this context, our study aimed to describe the prevalence and incidence of ischemic cardiovascular risk factors in a representative sample of the population of Casablanca.
Our study was carried out in Morocco’s Medical Biology Center of Pasteur Institute and concerned 609 subjects, 363 women and 246 men, who were belonged to different prefectures of Casablanca and selected using cluster sampling; they were aged from 18 to 65 years old and presented a mean-age of 54.47 ± 10.89 years old. When enrolling, they fill in a health and lifestyle questionnaire with sociodemographic characteristics (age, sex, educational level and marital status, profession ), medication intake, medical history and lifestyle factors such as physical activity and smoking. Physical activity was assessed by means of a detailed frequency questionnaire, including weekdays and weekends. Usual physical occupational activity, method of going to and from work, leisure time and sports were considered in the questionnaire, it was defined according to WHO guidelines, which recommended that at least 30 min of regular, moderate or intense physical activity on most days reduces the risk of CVD and diabetes, colon cancer and breast cancer [12]. A person was therefore considered as active if he/she performed at least 30 min of physical activity per day. The clinical examination was a personal interview and a physical examination.
This study had the approval of the regional ethical committee and consents were given by all participants, who were all Moroccan adults volunteering living in Casablanca and its neighboring areas. All women were non-pregnant and non-lacting.
The anthropometric measurements (body weight, body mass, waist circumference (WC), hip circumference (WHR), and systolic and diastolic blood pressure (respectively, sBP and dBP), were measured using standard protocols. Obesity was determined using standard anthropometry the weight (kg) and height(m) to calculate body mass index (BMI) : weight (kg) divided by the square of height (m2), with subjects with (BMI) 25 kg/m2<(BMI)30 kg/m2 as obese according to the (WHO) recommendations [12]. And according to the BMI, we had subdivided our population into three groups: Normal BMI (Group 1: n=102), overweight (Group 2: n=270) and Obese (Group 3: n=236).
Fasting blood samples were collected after at least 12 hours overnight fasting, then centrifuged and stored in -20°C until laboratory analysis. Serum total cholesterol (TC), Triglycerides (TG) and High- Density Lipoprotein Cholesterol (HDL) levels were determined using the VITROS 5,1 FS Chemistry System; Low-Density Lipoprotein Cholesterol (LDL) level was calculated according to the Friedewald’s formula. The atherogenic index of plasma (AIP) was calculated according to the formula, log (TG/HDL-C) [13], It has been suggested that an AIP value of under 0.11 is associated with low risk of CVD; the values between 0.11 to 0.21 and upper than 0.21 are associated with intermediate and increased risks, respectively [14,15].
All data is expressed as Mean ± Standard Deviation. When the other parameters were analyzed by ANOVA test in the SPSS V20 software and the values of p<0.05 were considered significant in the Post-Hoc tests.
The baseline characteristic and biochemical variables of our population are mentioned in Table 1. The three groups presented increasing anthropometric values while compared (in all groups: P<0.0001 for WHC and WC). Elevation of systolic and diastolic blood pressure was significant between the group 1 and 2, moreover between the 1st and 3rd groups (P<0.05), but no significant elevation in the comparison between the 2nd and the 3rdgroup. While comparing the fasting glucose (FG), HDL-C, LDL-C and the TG/HDL we did not notice any significant variations in the three groups. The TC, TC/HDL and AIP showed significant elevation when comparing the 1st and the 2nd group (P<0.05, P<0.01 and P<0.01 respectively). For the 2nd and the 3rd group the TC, TG and AIP did not show any significant variations but we noticed a significant elevation for TC/HDL (P<0.05). For the 1stand 3rd group TC, TG and AIP showed a signification elevation (P<0.01, P<0.05 and P<0.001 respectively) (Table 1).
| Groups | N | Age | Sex ratio | WC (cm) | sBP (mm Hg) | dBP (mm Hg) | FG (g/L) | TC (g/L) | HDLc (g/L) | LDLc (g/L) | TG (g/L) | TC/HDL | TG/HDL | AIP |
|---|---|---|---|---|---|---|---|---|---|---|---|---|---|---|
| (1) normal |
102 | 53.63 ± 11.72 | 68/34 | 88.64 ± 7.89 | 119.6 ± 17.6 | 71.1 ± 10.4 | 1.19 ± 0.47 | 1.81 ± 0.38 | 0.52 ± 0.11 | 1.08 ± 0.34 | 1.12 ± 0.91 | 3.64 ± 1.12 | 2.57 ± 2.02 | 0.27 ± 0.21 |
| (2) Overweight | 270 | 55.22 ± 10.82 | 123/147 | 98.52 ± 7.04 | 125.2 ± 19.9 | 74.5 ± 11.0 | 1.19 ± 0.50 | 1.93 ± 0.39 | 0.50 ± 0.13 | 1.16 ± 0.33 | 1.31 ± 0.68 | 4.07 ± 1.16 | 2.97 ± 2.24 | 0.38 ± 0.27 |
| (3) obese |
236 | 53.97 ± 10.52 | 54/182 | 109.92 ± 8.77 | 127.8 ± 19.1 | 76.4 ± 11.3 | 1.20 ± 0.49 | 1.97 ± 0.38 | 0.51 ± 0.11 | 1.17 ± 0.33 | 1.41 ± 0.75 | 4.03 ± 1.14 | 3.08 ± 2.28 | 0.40 ± 0.26 |
| P1 | 0.001 | 0.035 | 0.023 | 1 | 0.017 | .63 | 0.105 | 0.083 | 0.004 | 0.061 | 0.002 | |||
| P2 | <0.001 | 0.38 | 0.18 | 1 | 0.87 | 1 | 1 | .39 | .014 | 1 | 1.0000 | |||
| P3 | <0.001 | 0.01 | <0.001 | 1 | 0.001 | 1 | 0.53 | 0.03 | 1 | 0.22 | <0.001 | |||
P1=comparison groups 1/2 ; P2=comparison groups 1/3 ; P3=comparison groups 2/3.
AIP=atherogenic index of plasma; dBP=diastolic blood pressure; HDL-C=high-densitylipoprotein cholesterol; LDL-C=low-densitylipoprotein cholesterol; sBP=systolic blood pressure; TC=total cholesterol; TG=triglycerides; WC=waist circumference.
P<0.05
Table 1: Baseline characteristics and biochemical variables of the study participants.
Table 2 represents the physical activity and the biochemical profile in our population. The three groups were divided again into different subgroups (a: active normal BMI / b: sedentary normal BMI / c: active overweight / d: sedentary overweight / e: active obese / f: sedentary obese). The prevalence of physical activity approximately was threefold higher in the overweight (24.7%) and higher in the obese groups (16.0 %) compared with normal BMI people (9.5%). The comparison did not show any significant variations within each group.
| Groups | N | FG (g/L) | TC (g/L) | HDL-c (g/L) | LDL-c (g/L) | TG (g/L) | TC/HDL-c | TG/HDL-c | AIP |
|---|---|---|---|---|---|---|---|---|---|
| Normal/active | 58 | 1.15 ± 0.44 | 1.81 ± 0.35 | 0.52 ± 0.11 | 1.07 ± 0.31 | 1.18 ± 1.09 | 3.67 ± 1.19 | 2.86 ± 5.28 | 0.29 ± 0.23 |
|
44 | 1.26 ± 0.52 | 1.80 ± 0.43 | 0.52 ± 0.11 | 1.09 ± 0.38 | 1.04 ± 0.59 | 3.59 ± 1.02 | 2.18 ± 1.38 | 0.25 ± 0.22 |
| (c) Overweight active | 150 | 1.20 ± 0.48 | 1.90 ± 0.40 | 0.49 ± 0.14 | 1.14 ± 0.34 | 1.32 ± 0.69 | 4.09 ± 1.17 | 3.05 ± 2.31 | 0.39 ± 0.27 |
| (d) Overweight/passive | 120 | 1.18 ± 0.52 | 1.97 ± 0.36 | 0.51 ± 0.12 | 1.19 ± 0.32 | 1.31 ± 0.68 | 4.04 ± 1.14 | 2.86 ± 2.16 | 0.37 ± 0.26 |
| (e) Obese/active | 97 | 1.24 ± 0.56 | 2.01 ± 0.40 | 0.52 ± 0.12 | 1.20 ± 0.34 | 1.39 ± 0.70 | 4.01 ± 1.16 | 2.98 ± 2.19 | 0.39 ± 0.26 |
| (f) Obese/passive | 139 | 1.18 ± 0.44 | 1.95 ± 0.36 | 0.50 ± 0.11 | 1.16 ± 0.33 | 1.43 ± 0.78 | 4.03 ± 1.13 | 3.15 ± 2.34 | 0.41 ± 0.27 |
| P1 | 1 | 1 | 1 | 1 | 1 | 1 | 1 | 1 | |
| P2 | 1 | 1 | 1 | 1 | 1 | 1 | 1 | 1 | |
| P3 | 1 | 1 | 1 | 1 | 1 | 1 | 1 | 1 |
P1=comparison groups a/b; P2=comparison groups c/d; P3=comparison groups e/f
P<0.05
Table 2: Physical activity and biochemical profile.
Table 3 represents smoking and the biochemical profile within our studied population. Each group was divided to two (a': normal BMI smokers/ b': normal BMI nonsmokers / c': overweight smokers/ d': overweight nonsmokers / e': obese smokers / f ': obese nonsmokers). The prevalence of smoking was 6.2 % in our population. The statistical analyses did not show any significant variations of the lipid profile while comparing within each group expect for the ratio TG/HDL that showed a significant elevation (P<0.05) for the overweight smokers in comparison with those nonsmokers.
| Groups | N | FG (g/L) | TC (g/L) | HDL-c (g/L) | LDL-c (g/L) | TG (g/L) | TC/HDL-c | TG/HDL-c | AIP |
|---|---|---|---|---|---|---|---|---|---|
| a')Normal/smokers | 16 | 1.11 ± 0.36 | 1.89 ± 0.37 | 0.56 ± 0.12 | 1.17 ± 0.32 | 1.08 ± 0.62 | 3.84 ± 1.08 | 2.34 ± 1.57 | 0.27 ± 0.21 |
| b')Normal/non-smokers | 86 | 1.21 ± 0.49 | 1.79 ± 0.39 | 0.52 ± 0.11 | 1.06 ± 0.34 | 1.13 ± 0.95 | 3.60 ± 1.13 | 2.61 ± 4.43 | 0.27 ± 0.22 |
| c') Overweight/smokers | 15 | 1.19 ± 0.48 | 1.78 ± 0.39 | 0.42 ± 0.13 | 1.00 ± 0.29 | 1.80 ± 1.27 | 4.55 ± 1.72 | 5.14 ± 4.58 | 0.55 ± 0.39 |
| d') Overweight/non smokers | 255 | 1.19 ± 0.50 | 1.94 ± 0.38 | 0.50 ± 0.13 | 1.17 ± 0.33 | 1.28 ± 0.63 | 4.04 ± 1.11 | 2.84 ± 1.97 | 0.37 ± 0.25 |
| e') Obese/smokers | 7 | 1.44 ± 0.59 | 2.22 ± 0.32 | 0.5 ± 0.81 | 1.34 ± 0.31 | 1.87 ± 0.64 | 4.57 ± 1.17 | 3.95 ± 1.85 | 0.55 ± 0.21 |
| f') Obese non-smokers | 229 | 1.19 ± 0.49 | 1.96 ± 0.38 | 0.51 ± 0.11 | 1.17 ± 0.33 | 1.40 ± 0.75 | 4.01 ± 1.14 | 3.05 ± 2.29 | 0.39 ± 0.21 |
| P1 | 1 | 1 | 1 | 1 | 1 | 1 | 1 | 1 | |
| P2 | 1 | 1 | 0.285 | 0.831 | 0.1 | 1 | 0.017 | 0.2 | |
| P3 | 1 | 1 | 1 | 1 | 1 | 1 | 1 | 1 |
P1 comparison groups a'/b'; P2=comparison groups c'/d'; P3=comparison groups e'/f'
P<0.05
Table 3: Smoking and the biochemical profile.
Table 4 represents the status of the hypertension arterial (HTA) and Diabetes association with the biochemical profile. We subdivided our studied population into three groups again but each group contains four subgroups as follows: Normal, Overweight and obese BMI (Without risk factor (RF) none risk factor (NRF°)/Diabetes/Diabetes associated to HTA). The prevalence of diabetes was 24.8% in the population and was two times higher in overweight and obese than in normal BMI people. For HTA it was 22.5% and five times higher in overweight and obese than normal BMI people. The association of diabetes and HTA showed 13.3% prevalence in the population and it was three times higher in the overweight and obese when compared with the normal BMI people again. While comparing statistically within the normal BMI group, we noticed a significant elevation of the FG, TG and the ratio TG/HDL (P<0.01), then the comparison showed a significant decreasing (P<0.05) for people with an association of diabetes with HTA. For the second and the third group we noticed an elevation of the level of the FG and sPB when we have the association with diabetes and HTA (P<0.01).
| Groups | N | FG (g/L) | TC (g/L) | HDL-c (g/L) | LDL-c (g/L) | TG (g/L) | TC/HDL | TG/HDL | AIP |
|---|---|---|---|---|---|---|---|---|---|
| a)Normal/without RF | 53 | 0.90 ± 0.09 | 1.82 ± 0.34 | 0.53 ± 0.10 | 1.09 ± 0.33 | 0.98 ± 0.44 | 3.56 ± 1.01 | 1.97 ± 1.10 | 0.23 ± 0.22 |
| b) Normal/Diabetes | 29 | 1.52 ± 0.51 | 1.73 ± 0.35 | 0.51 ± 0.12 | 1.03 ± 0.29 | 1.01 ± 0.53 | 3.50 ± 0.78 | 2.18 ± 1.27 | 0.26 ± 0.23 |
| c)Normal/HTA | 8 | 1.03 ± 0.28 | 2.17 ± 0.37 | 0.52 ± 0.07 | 1.45 ± 0.29 | 1.07 ± 0.29 | 4.12 ± 0.45 | 2.03 ± 0.46 | 0.29 ± 0.10 |
| d)Normal/Diabetes and HTA | 12 | 1.75 ± 0.52 | 1.69 ± 0.53 | 0.48 ± 0.16 | 0.88 ± 0.38 | 2.02 ± 1.34 | 3.98 ± 2.14 | 6.50 ± 1.15 | 0.46 ± 0.39 |
| e) Overweigh/without RF | 107 | 0.91 ± 0.09 | 1.96 ± 0.36 | 0.51 ± 0.14 | 1.19 ± 0.31 | 1.23 ± 0.55 | 4.06 ± 1.14 | 2.64 ± 1.57 | 0.35 ± 0.25 |
| f)Overweigh/Diabetes | 65 | 1.47 ± 0.53 | 1.89 ± 0.44 | 0.49 ± 0.12 | 1.14 ± 0.36 | 1.33 ± 0.66 | 4.02 ± 1.01 | 3.00 ± 1.93 | 0.40 ± 0.26 |
| g) Overweigh/HTA | 65 | 1.02 ± 0.33 | 1.92 ± 0.39 | 0.51 ± 0.15 | 1.14 ± 0.35 | 1.27 ± 0.71 | 3.97 ± 1.18 | 2.89 ± 2.41 | 0.36 ± 0.29 |
| h) Overweigh/Diabetes and HTA | 33 | 1.78 ± 0.63 | 1.90 ± 0.40 | 0.46 ± 0.13 | 1.14 ± 0.37 | 1.60 ± 1.00 | 4.38 ± 1.43 | 4.11 ± 3.66 | 0.50 ± 0.31 |
| i)Obese/without RF | 79 | 0.92 ± 0.07 | 1.90 ± 0.37 | 0.5 ± 0.12 | 1.13 ± 0.33 | 1.33 ± 0.85 | 3.99 ± 1.11 | 3.06 ± 2.66 | 0.37 ± 0.30 |
| j) Obese/Diabetes | 57 | 1.52 ± 0.65 | 2.01 ± 0.39 | 0.49 ± 0.10 | 1.23 ± 0.34 | 1.51 ± 0.73 | 4.24 ± 1.21 | 3.35 ± 2.37 | 0.45 ± 0.24 |
| k) Obese/HTA | 64 | 1.05 ± 0.23 | 2.00 ± 0.32 | 0.52 ± 0.12 | 1.19 ± 0.30 | 1.38 ± 0.62 | 3.95 ± 1.03 | 2.88 ± 1.78 | 0.38 ± 0.25 |
| i) Obese/Diabetes and HTA | 36 | 1.56 ± 0.57 | 2.00 ± 0.47 | 0.54 ± 0.13 | 1.16 ± 0.40 | 1.51 ± 0.79 | 3.90 ± 1.31 | 3.07 ± 2.09 | 0.40 ± 0.27 |
| P1 (b vs d) | 1 | 1 | 1 | 1 | 0.006 | 1 | <0.001 | 1 | |
| P2 (c vs d) | 0.008 | 0.387 | 1 | 0.016 | 0.341 | 1 | 0.011 | 1 | |
| P3 (f vs h) | 0.055 | 1 | 1 | 1 | 1 | 1 | 1 | 1 | |
| P4 (g vs h) | <0.001 | 1 | 1 | 1 | 1 | 1 | 1 | 1 | |
| P5 (j vs i) | 1 | 1 | 1 | 1 | 1 | 1 | 1 | 1 | |
| P6 (k vs i) | <0.001 | 1 | 1 | 1 | 1 | 1 | 1 | 1 |
P1 (b vs d); P2 (c vs d); P3 (f vs h); P4 (g vs h); P5 (j vs i); P6 (k vs i) RF= Risk factors P<0.05
Table 4: Hypertension and Diabetes association with the biochemical profile.
The diagram below (Figure 1) is another representation of our studied population, according to the number of CVRF and sex gender. We observed that 35.20%, 13.98% and 1.81% have respectively 3, 4 and 5 CVRF whereas 5.26% have none. We noticed too that woman have more CVRF (59.7%) than men (40.3%).
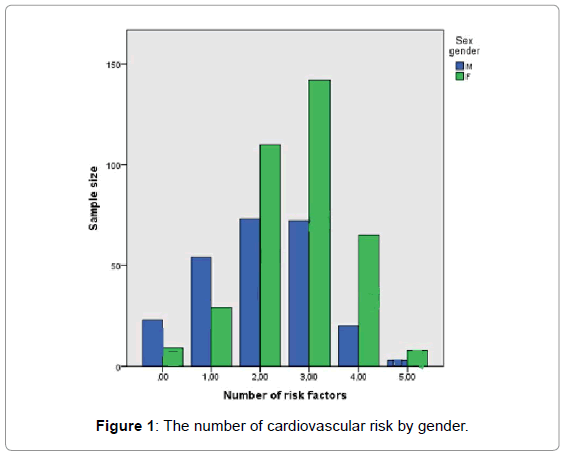
Figure 1: The number of cardiovascular risk by gender.
Our results on CVRF in Moroccan adults suggested that there is a high prevalence for a vast majority of people in the modifiable risk factors investigated in this study: Obesity, Overweight, Insufficient physical activity, Diabetes, HTA and lipid parameters.
There is no doubt that obesity and overweight have been confirmed, worldwide, a burden. According to WHO, they have more than doubled since 1980 with an increasing prevalence in many areas of the world, especially in young people in many countries [16] which is an alarming situation meaning that in near future will be a huge spectrum of cardiovascular disease happening at an early age. Our study has shown a prevalence of 44.4% and 38.4% of overweight and obesity respectively, these numbers are higher than the national data published in 2013 where the prevalence was 34.7% and 34.9% for overweight and obesity [17]. In Morocco, existing studies have perceived a variance of prevalence of obesity by residence area and region [18-20], we can notice a great difference in some areas of Morocco where we find high prevalence of obesity as like as in Casablanca (urban area) with 43.8% [21] or lower figures such as in the High Atlas (rural area)13.3% [22]. Thus, the high prevalence in urban area may be caused by lifestyle, urbanization, demographic trends and nutritional transition that change and affect lifestyles, consumption, and dietary behaviors.
Moreover, we find that the prevalence of obesity was higher in women. 29.9% of all women were obese; this had been already confirmed [23,24]. Our results showed an increasing prevalence of obesity in comparison with the previous studies in Morocco, which had shown since 1998, 2000, 2011, respectively, a prevalence of obesity was 16%, 22 %, 26.8% [17,18,24]. This result can be explained by psychological, hormonal and physiological status that change in menopause leading to weight gain, not only this but also, the majority of women are housewives thus a reduced physical activity.
Our results showed that the WHR, WC and dBP higher numbers in obese and overweight people as compared to normal BMI ones that may explain the alteration of the lipids profiles we found. More than that, these risk factors in association with diabetes and hypertension lead generally to metabolic syndrome [25]. Many studies reported a correlation between the reduction of HDL, the elevation of TG, abdominal obesity [26], arterial hypertension [27] and diabetes [28]. In this context, our results showed a prevalence of 72.8% of abdominal obesity in our population that led us to initiate the alarm for more investigations all over the country.
Diabetes and hypertension prevalence were, respectively, 38.1% and 35.8% (with predominance in women). Comparing our findings with previous studies, we can clearly observe that the prevalence of Diabetes is three times higher and HTA is higher even than ten years ago, respectively (6.6% and 33.6%) [23]. While comparing again to the last national data we can observe that the HTA is slightly above the 33.6% confirming again that it is rising day after day.
Lipid parameters showed some variations in CT, TGs and AIP. The prevalence of higher AIP was present especially in overweight and obese people; it was respectively 31.1%, 28.2% and 9% in normal BMI people. In previous studies on Moroccan population, high risk AIP was associated to BMI >25 [29], and then an elevation in the ratio of TG to HDL-c was a powerful predictor of extensive coronary heart disease [30].
The prevalence of hypercholesterolemia was 7.1% which is lower compared to the study conducted in Oujda (22,9%) [31]. Strong correlation between body weight and the rate of total cholesterol was confirmed in the Framingham study that demonstrated an increase of weight is associated with an increase of blood cholesterol [32]. The ratio TC/HDL-c showed a significant elevation in obese group that may be associated with more substantial alterations in metabolic indices predictive of heart disease risk and related to the insulin resistance. The other parameters did not show any significant variation, but we noted a decreasing level of CT and dBP, which may be caused by the medications that the patients were taking, lifestyle and smoking [33,34].
The prevalence of smoking was 6.2% with a male predominance (14.2% vs. 0.8%). The lowest prevalence was noticed in the obese group (2.91%) oppositely to normal BMI people where the prevalence was 13.3% where 5.58% women smoke usually. For men, 18.57% of the normal BMI group smokers are diabetics and hypertensive. We noticed a prevalence of 9.29% in obese people. These men dominance was shown in other study where 31.5% for males and 3.1% for females [35]. Yassamine Bentata et al. explained that their studied population had cardiovascular events: 56 (12.3%) vs. 19 (28.4%) (p <0.001) and 66 (14.5%) vs. 19 (28.4%) (p=0.004) respectively, when associated to smoking [36].
Comparing the prevalence of physical activity in the normal group with obese and overweight, our results showed that the prevalence was higher in the overweight and obese (24.7% and 16.0 % respectively) related to normal BMI people (9.5%) with dominance for women 26.4% compared to men 23.8%. The study of Guthold and al. was held on 212021 subjects from 51 developed and developing countries where they showed a 15% men and 20% women sedentary lifestyle, especially in developed countries [37].
We observed that 35.20%, 13.98% and 1.81% have respectively 3, 4 and 5 cardiovascular risk factors whereas 5.26% have none. We noticed too that woman have more CVRF (59.7%) than men (40.3%). As confirmed by the World federation of heart the leading CVD risk factor is raised blood pressure (to which 13 per cent of global deaths is attributed), followed by tobacco use (9 per cent), raised blood glucose (6 per cent), physical inactivity (6%) and overweight and obesity (5%) [8].
Briefly, our study revealed that the Moroccan population is still at a high risk of cardiovascular disease and coronary heart disease, which is due to unhealthy habits like sedentary life style, diabetes and/or hypertension.
These results lead us to initiate the alarm signal to be more perspicacious, and to manage national programs in order to investigate for planning, execution, and assessment of cardiovascular disease.