Journal of Geology & Geophysics
Open Access
ISSN: 2381-8719
ISSN: 2381-8719
Research - (2023)Volume 12, Issue 11
Assessment of Heavy Metal (HM) pollution of soil could be index based or model driven. Each suffers from
methodological limitations. Classification of regions with respect to different indices gave different results. The
paper suggests an assumption-free method to get comprehensive index as geometric mean of chosen indices to reflect
overall pollution status of HMs  in soil as a Composite Index (CI), avoiding selection of weights and scaling.
The proposed aggregation is applicable for all types of indices including those having skewed distributions and can
be applied even for data with small sample size. With reduced level of substitutability among component indices,
the method facilitates formation of chain indices, satisfies time reversal test, and identifies the critical areas and
contribution of the indices to . It produces no bias for polluted or non-polluted regions since effect of outliers is
not much. It allows ranking and classification of regions in terms of values and assesses paths of improvement for
each region over time. Possible to undertake statistical testing of  for the i-th and j-th region at a particular
time or
for the i-th and j-th region at a particular
time or 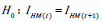 for a particular region at two time periods. Since evaluation criteria/base period values vary
across countries, meaningful comparison of countries can be made in terms of progress made on Year-to-Year basis.
Based on theoretical advantages, the proposed aggregation by Geometric Mean (GM) is an improvement over the
existing methods of finding overall pollution status of HMs in soils and is recommended.
for a particular region at two time periods. Since evaluation criteria/base period values vary
across countries, meaningful comparison of countries can be made in terms of progress made on Year-to-Year basis.
Based on theoretical advantages, the proposed aggregation by Geometric Mean (GM) is an improvement over the
existing methods of finding overall pollution status of HMs in soils and is recommended.
Heavy metals; Comprehensive assessment; Overall pollution status; Geometric mean; Chain indices; Time reversal test; Path of improvement
Pollution of soil by Heavy Metals (HMs) from natural and anthropogenic sources like domestic/industrial waste water effluents, urban and agricultural runoff, fossil fuel combustion, atmospheric deposition, etc. have emerged as a major threat to human society. Major HMs affecting soils are Cadmium (Cd), Chromium (Cr), Copper (Cu), Lead (Pb), Mercury (Hg), etc. Toxicity of metals increase with concentration. Illustrative list of toxic effects of HMs are: Dysfunction of liver and renal problems by Pb, Cd, and Hg; cognitive functions may be affected by Pb, Hg which may introduce neurological changes; exposure to Cd can cause cancer, hypertension, even affect our reproductive system; Hg may result in fetal abnormalities, etc. [1-3]. Agricultural fields have shown significant contamination of HM. For example, predominant HM pollution of agricultural fields in India due to use of sewage water and industrial effluents were found [4,5]. Widespread HM pollution primarily due to rapid industrialization and urbanization has already affected public health, food safety and even the ecological environment.
Assessments of soil pollution due to HMs are either index based or model driven. While the former approaches involve use of a single pollution, extent of pollution, etc. the later approaches include enrichment factors, ecological hazard index, etc. [6], investigated pollution level due to concentrations of HMs using contaminant index (single factor), Nemerow index, spatial distributions of HMs, and assessed environmental health risk utilizing a United States Environmental Protection Agency recommended model [7]. Studies focusing on one specific HM cannot satisfy interests of landowners. Regulatory authorities and researchers who could be interested in approach of aggregation of several measures from individual sampling units to obtain sample information, based on which estimation of population parameters for further analysis and inferences including effectiveness of remedial action [8]. However, no agreed standard exists for evaluation of soil environmental quality [9].
While enrichment factors indicate (extent of increase of an element in sampling unit relative to average natural abundance; requiring selection of a background composition and also a reference element), Ecological risk index reflects the Potential Ecological Risk Index (PERI, or RI), and combine the single index of Ecological Risk Factor ( ERI) and the Toxic Response factor of Individual metal (TRI).
Nemerow Pollution Index (PINemerow) indicates soil quality in terms of the single Pollution Index (PI) and is computed as
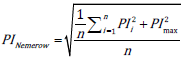
Where, PImax: Maximum value of the single pollution index of all heavy metals
n: number of heavy metals.
Several indices are there for measuring effect of single factor, geo- accumulation, ecological risk and resulting human health risk, etc. Comprehensive assessment requires combining such indices on a methodologically sound approach to get a comprehensive index for analysis of overall pollution status of HMs. Clearly, comprehensive index is a Composite Index (CI) which is a real valued function f whose domain consists of set of individual indices, which could be unit-free or with different units, following different distributions and having different degrees of correlations.
Distributions of concentration of HMs vary for different locations, different sections of soil and are not normal for different sections of soil [10]. Large value of Coefficient of Variation (CV) of a HM shows uneven distribution of the HM concentration.
The paper describes limitations of existing indices and methods of obtaining comprehensive index as combination/aggregation of individual indices and suggests an assumption-free method to get comprehensive index reflecting overall pollution status of HMs in soil as a composite index, satisfying desired properties.
Measures of pollution level of HMs
Single Factor assessment (SF): Concentration of HMs (mg/Kg) in soil are calculated and compared with respective standards. However, such standards vary across countries. Single-factor contaminant index Pi was considered [6] as
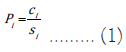
Where, Ci (mg/Kg) is the detected concentration of i-th HM and Si (mg⁄Kg) is the evaluation criterion of i-th HM.
Nemerow pollution index PN is given by
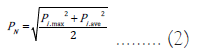
Where, Pi.max and Pi.ave denote respectively the maximum and arithmetic mean of Pis. The index PN reflects average pollution level of soil in terms of average of various pollutants and also helps to find more serious pollutants [11]. PN has a one-to-one correspondence with Synthetic Pollution Index (SPI) computed as
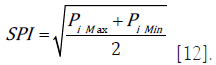
Here, each of Pi and PN is unit free
Limitations
• Addition of Pi and Pj for I ≠ j is not admissible since evaluation criterion of i-th HM and j-th HM are different, like average speed of two cars. For example, consider A=4/8=0.5 and B=3/12=0.25. Here, (A+B)/2=0.375 which is different from the pooled average of A and B=7/20=0.35.
• PN is influenced by the maximum score. SPI considers two extreme values of data which could be unrealistic outliers and ignores other observations from the data. Thus, value of PN or SPI depends heavily on heterogeneity of data. Better could be to find pooled average and pooled Standard Deviation (SD) based on all sample observations.
• Classification of soils based on increasing values of Pi under safe, slightly polluted, low polluted, moderately polluted and highly polluted needs to show efficiency of classification in terms of low value of within-group variance and high value of between-group variance. Same is true for classification on the basis of PN values [13].
Geological Accumulation Assessment (GEO)
Muller [14], gave the formula for calculating Geo-accumulation index (Igeo) to assess pollution level for a single element by
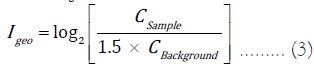
Where CSample and CBackground denote respectively concentration of a HM in soil and the same in the background, taken from secondary data, which can change due to natural diagenesis. Background level concentration distinguishes concentration of the HM occurring by natural process and due to anthropogenic influence [15]. For each HM, separate geochemical baseline is determined for geologically different regions [16].
Considering IgeoMax (maximum Igeo value) and IgeoAv (average of Igeo value) of all HMs in a sample, [17] calculated arithmetic mean,
SD, Geometric mean and median for Igeo and Nemerow index 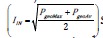 separately for eight different HMs without specifying
most suitable averaging procedure.
separately for eight different HMs without specifying
most suitable averaging procedure.
Observations
Igeo is relative to the CBackground and depends heavily on its value.
For a given value of 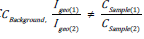 . For example, let CBackground for Pb be 36.0 mg·kg−1, CSample(1)=37 units and CSample(2)=38
units. Then,
. For example, let CBackground for Pb be 36.0 mg·kg−1, CSample(1)=37 units and CSample(2)=38
units. Then, 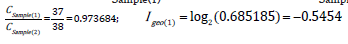 and
and
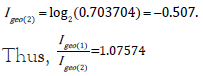
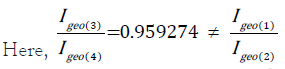
Increase of Igeo per unit increase in CSample is different at different range of values. Let values of concentration of Pb in CSample(3)= 74 and CSample(4)= 75 respectively where CBackground for Pb is 36.0 like the above example.
Igeo could be expressed as 
 when geochemical
background value and evaluation criterion of i-th HM are same.
Thus, Igeo and Pi are likely to be highly correlated.
when geochemical
background value and evaluation criterion of i-th HM are same.
Thus, Igeo and Pi are likely to be highly correlated.
CSample could be better calculated as pooled mean.
CBackground may not be available for areas considered as free from any HM pollutants where the geochemical baseline map is under progress. Non-availability of CBackground at Brahmaputra valley, North East India was found [18].
Classification based in Igeo may not be beyond questions.
Ecological Risk (ER)
ER reflects pollution level due to accumulation of HMs in soil by the interaction effects of several HMs and environmental associations with HMs. Potential ecological Risk Index (RI) integrates ER value of each HM as follows:
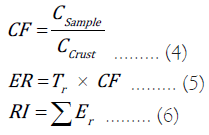
Where, Tr denotes the toxicity coefficient and CF denotes the pollution factor.
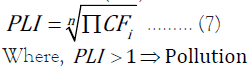
Multiplicative aggregation was favored by [19], to obtain Pollution Load Index (PLI) for a station by
For the i-th HM in soil, [20] suggested computation of potential ecological Risk Index (RI) by
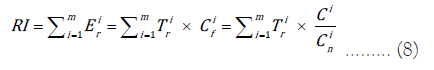
Where,
Ci: Total amount of i-th HM,
Cin: Corresponding background value of the i-th HM
Ti r : Coefficient of toxicity of i-th HM, taken as 5,1,5,30, and 5, respectively for Cu, Zn, Pb, Cd, and Ni [21].
Ei r: Single factor ecological risk index of i-th HM and
Higher value of Ei r indicates higher risk degree of RI.
Classification of regions with respect to different indices gave different results. Unpolluted regions (with PLI<1) had heavy contaminations in terms of Igeo values [22].
Human Health Risk assessment (HHR)
HHR is a tool to assess and manage adverse health effects on humans beings exposed to HMs in polluted environmental media through ingestion, dermal absorption, and breathing inhalation. It also determines the measures required to comply with the relevant health and safety legislation and, thus, reduce level of occupational injuries and ill-health Potential Non-Carcinogenic health Risk (PNCR) and Potential Carcinogenic health Risk (PCR) for more than one HM can be estimated by sum of HQ for each metal and expressed as unit-free Hazard Index (HI) [23].
HI>1 ⟹ existence of PNCR. Total PNCR>1 × 10⁻⁴, implies high carcinogenic risk to human beings. If total PNCR<1 × 10⁻⁶, PCR due to exposure to HM could be negligible.
Comprehensive assessment
Analytic Hierarchy Process (AHP) was used by [10], to combine four indices (SF, GEO, PER and HHR) involving subjective assessment of relative importance of the indices using Saaty’s scale consisting of 9-point items (1-9) followed by selection of weights and comprehensive assessment scores (T) by weighted sum. Here, higher value of T implies lower pollution level. Major disadvantages of AHP are: Determination of importance through subjective approach using pairwise comparisons; Saaty scale depends on the trial perceptions and is not meaningful [24]; AHP is not a legitimate technique [25]; use of AHP along with others Multi Criteria Decision Making (MCDM) methods was suggested [26]. But, results of Data Envelopment Analysis (DEA) depend significantly on selection of inputs and outputs and number of inputs and output variables [27].
Principal Component Analysis (PCA) was used [12], to determine the sources of soil HMs, without verification of normal distribution of variables under investigations, which is an important assumption of PCA. Non satisfaction of assumptions of techniques used may distort the results. PCA considers the low variance components in the data as noise and thus, those components are thrown away, even if those components play major roles in decision making.
PCA is sensitive to scaling, presence of outliers and may not be suitable for small samples. PCA weights are not constant over time and space and thus, comparisons are difficult. Sava [28], observed PCA weights for data accumulated for 11-years and averaging over each factor for year-wise data were different. Use of PCA was not favoured by Environmental Sustainability Index [29].
Cluster analysis for identification of 10 HM accumulation patterns in 47 soil samples was undertaken [30], and three clusters were found, each with a characteristic composition groups. While Cluster-1 showed high concentrations of Zn and Pb, Cluster-2 had high Cu concentration and major concentrations at Cluster-3 were Cr and Cu implying overlapping of Cluster-2 and Cluster-3. Hierarchical Cluster Analysis (HCA) on normalized datasets was used [31], to avoid problems due to scaling of variables and interconnections among the contaminants. However, non-inferential Cluster analysis assumes that the variables are independent. If variables are not independent, the assumption gets violated requiring further necessary action to deal with the situation.
Comprehensive assessment by weighted sum approach falls on
the class of linear model (without testing linearity) with full
compensability where poor effect of some pollutants can be
well compensated by high effects of other pollutants. Different
methods of selection of weights satisfying Wi>0 and ΣWi=1 give
different results and no weighting system is above criticism [32].
The multiplicative aggregation with non-linearity properties by  has been proposed [33], which prevents rank reversal
phenomenon and practically no substitution problems [34].
has been proposed [33], which prevents rank reversal
phenomenon and practically no substitution problems [34].
Proposed method
Ignoring the stage of selection of indicators, following method by [35] is proposed for Comprehensive Assessment of HMs in Soils as a Composite Index (CI) which avoids selection of weights and scaling of raw data. The method requires ensuring that each indicator/index is positively related to CI.
Set up and methodology
Take pooled average of the sample observations. For a region,
consider the vector 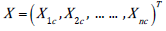 showing performance of
n-indices in the current period and vector
showing performance of
n-indices in the current period and vector 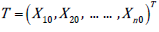 showing evaluation criteria/base period values. Instead of
arithmetic mean of ratios, overall pollution status of HMs (IHM)
as CI for the t-th time period may be defined as the Geometric
mean i.e.
showing evaluation criteria/base period values. Instead of
arithmetic mean of ratios, overall pollution status of HMs (IHM)
as CI for the t-th time period may be defined as the Geometric
mean i.e.
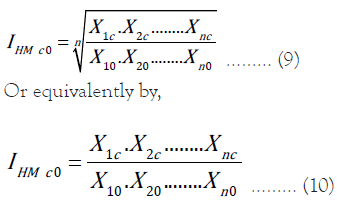
Multiplicative aggregation given in (9) and (10) can be applied
for all types of indices including those in percentages or having
skewed distribution and can be applied even for data with small
sample size. In line with general convention of index value=100
in the base year, one can take  to reflect changes in
percentage.
to reflect changes in
percentage.
Properties
For a given region, each of (9) and (10) depicts overall improvement/decline of soil pollution by HMs in the current year with respect to the target values or base year or previous year by a unit free continuous function satisfying the following desired properties.
• Independent of order of the chosen indices and independent of change of scale
• Reduces level of substitutability among the component indices.
• Facilitates formation of chain indices like 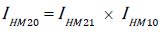
• Satisfies time reversal test 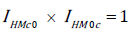
• Facilitates drawing of  graph over time showing
path of improvement/decline for a region across time for
comparison of regions with respect to such paths. Replacing
the base period vector by the vector for the previous year
gives improvement in
graph over time showing
path of improvement/decline for a region across time for
comparison of regions with respect to such paths. Replacing
the base period vector by the vector for the previous year
gives improvement in  on year-to-year basis.
• Produces no bias for polluted or non-polluted regions since  is least affected by outliers.
• Distribution of GM approaches the lognormal form and thus, computation of mean and SD are admissible [36].
Taking log on both sides of equation (9),
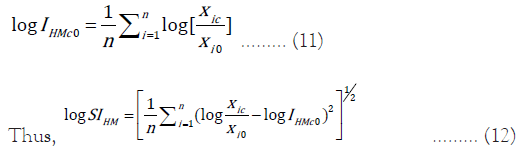
Where,  denotes Geometric Standard Deviation (GSD)
Since, log (GSD of X1, X2, … …, Xn)=usual SD of logX1, logX2, ………, logXn.
The ratio  is analogous to Coefficient of Variation (CV)
and indicates consistency of the data.
is analogous to Coefficient of Variation (CV)
and indicates consistency of the data.
Help to estimate population parameters. For large data, sample
GM is taken as population GM and standard error of GM is
estimated by 
Thus, statistical tests of hypotheses regarding equality of GM’s can be performed across time and space using t-tests on the logarithms of the observations.
Possible to construct separate index for each subset of indices.
Relative importance and contribution of each index can be easily found.
Critical indices are those for which 
Improvement in an index and the corresponding gain in  are
linearly related since 1% increase in
are
linearly related since 1% increase in  increase in
  if all others are unchanged
Applications
The proposed method can be applied even for skewed data and irrespective of correlations between a pair of indices and help in meaningful comparison of a set of regions of a country.
For comparison of properly defined sub-areas say agricultural lands, river basins, lands in vicinity of industrial activities like mining, production, highways, solid waste dump sites, etc., the proposed IHM index can also be applied with pre-selected pollutants and indices.
Can be used for classification of regions with respect to overall pollution status of HMs.
The graph of progress/decline of  , using the Chain indices
for a region will help to assess impact of various mitigation
measures across time
, using the Chain indices
for a region will help to assess impact of various mitigation
measures across time
Limitations
• Introduction of a new index requires value of that index in the base period and at different time periods.
• The method fails if an indicator takes negative or zero value.
• Assumes no missing data
Limitations of existing methods of overall pollution status of
HMs were reviewed. The proposed in terms of GM, avoiding
scaling and finding weights considers all chosen indices to depict
comprehensive improvement or decline of soil pollution by
HMs in a region in the current year with respect to base year or
previous year and helps in meaningful comparison of a group of
regions/countries. The proposed considers GM of the ratios  without normalization of individual indices like geometric
aggregation adopted in Human Development Index, 2010 [37].
without normalization of individual indices like geometric
aggregation adopted in Human Development Index, 2010 [37].
Important features of the proposed measure include:
• Reduction of substitutability among the component indices.
• Produces no bias for polluted or non-polluted regions since effect of outliers is not much.
• Unit-free monotonic continuous function.
• Facilitates formation of chain indices and satisfies time reversal test.
• Possible to find distribution of and compute mean and
variance for a sample of stations.
• Allows ranking and classification of regions in terms of values and assesses paths of improvement registered by a
region over time.
• Meaningful comparison of countries can be made in terms of progress made on Year-to-Year basis, despite different base period figures across countries,
GM approach is preferred for its additional properties like
formation of chain indices, satisfaction of time reversal test,
easy computation of contribution of the indices to , linearity
between improvement in a ratio of an index and the corresponding
gain in . Distance of a country from the SDG goals at a
particular time period can be found by replacing the base period data with the SDG goals adopted by the country. Besides, the
measure can be used for statistical testing of 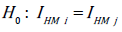 for
the i-th and j-th region at a particular time or
for
the i-th and j-th region at a particular time or 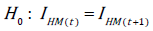 for a particular region.
may be computed separately for biogenic and physicogenic
aggregates to see which one is more likely to lead to soil
improvement.
The proposed aggregation by GM is an improvement over the existing methods of finding overall pollution status of HMs ( HM I ) in soils and is recommended. Researchers and stakeholders may derive benefits of the proposed HM I to find overall results of soil use and management along with identification of critical areas requiring managerial attentions. Future studies to assess impact of HM I in soils on vegetables, fruits, fish, shellfish, crustaceans, etc. may be undertaken.
DECLARATIONS
Competing interests
No funds, grants, or other support was received.
Funding
No funding was obtained for this study.
Financial interests
The author has no relevant financial or non-financial interests to disclose.
Data availability
Not applicable. No dataset used in the study.
Ethics approval
Not required for this methodological paper.
Ethical responsibilities of authors
All authors have read, understood, and have complied as applicable with the statement on ethical responsibilities of authors.
Informed consent
No data collected from individuals.
Author’s contribution statement
Conceptualization, methodology, writing-original draft preparation, writing-reviewing and editing, by the single author.
[Crossref] [Google Scholar] [PubMed]
[Crossref] [Google Scholar] [PubMed]
[Crossref] [Google Scholar] [PubMed]
[Crossref] [Google Scholar] [PubMed]
[Crossref] [Google Scholar] [PubMed]
[Crossref] [Google Scholar] [PubMed]
[Crossref] [Google Scholar] [PubMed]
[Crossref] [Google Scholar] [PubMed]
[Crossref] [Google Scholar] [PubMed]
[Crossref] [Google Scholar] [PubMed]
[Crossref] [Google Scholar] [PubMed]
[Crossref] [Google Scholar] [PubMed]
[Crossref] [Google Scholar] [PubMed]
[Crossref] [Google Scholar] [PubMed]
[Crossref] [Google Scholar] [PubMed]
Citation: Chakrabartty SN (2023) Comprehensive Assessment of Heavy Metals in Soils. J Geol Geophys. 12:1155.
Received: 28-Oct-2023, Manuscript No. JGG-23-27829; Editor assigned: 30-Oct-2023, Pre QC No. JGG-23-27829 (PQ); Reviewed: 13-Nov-2023, QC No. JGG-23-27829; Revised: 20-Nov-2023, Manuscript No. JGG-23-27829 (R); Published: 27-Nov-2023 , DOI: 10.35248/2381-8719.23.12.1155
Copyright: © 2023 Chakrabartty SN. This is an open-access article distributed under the terms of the Creative Commons Attribution License, which permits unrestricted use, distribution, and reproduction in any medium, provided the original author and source are credited.