Journal of Geology & Geophysics
Open Access
ISSN: 2381-8719
ISSN: 2381-8719
Research Article - (2014) Volume 3, Issue 3
Developing countries and emerging economies could not only considerably reduce their GHG emissions at comparably low costs but also significantly contribute to improve public health conditions and environmental protection if they were to put in place sustainable waste management systems. Solid waste management (SWM) strategies offer huge potentials to contribute to climate change mitigation. In this work, SWM-GHG calculator was used to compare different potential strategies for waste management. In total 3 scenarios are assumed and evaluated. The result showed Scenario 2 is estimated to be 100.000 t CO2-eq/yr for recycling, while GHG emission reduction in Scenario 3, is up to 600.000 t CO2-eq/yr for total SWM (recycling and improved waste disposal).
Keywords: GHG emissions, Herzegovina, Bosnia
Bosnia and Herzegovina is facing changes in consumer habits and increase of waste generation. The rate of waste production in Federation of Bosnia and Herzegovina FBIH (entity of BiH), is around 800.000 t/ yr, with an average generation rate of 0.93 kg/cap/day. Waste collection coverage is of about 70%. At the moment, there are only 4 sanitary waste landfills in function, and most of the waste is disposed at unsanitary municipal landfills or uncontrolled dumps. Due to the unmanaged landfills and lower recycling levels, GHG emissions become significant. FBiH has developed Waste management strategy and Plan, but within them potentials of GHG emission mitigations are not quantitatively considered.
Solid waste management (SWM) strategies offer huge potentials to contribute to climate change mitigation [1]. Developing countries and emerging economies could not only considerably reduce their GHG emissions at comparably low costs but also significantly contribute to improve public health conditions and environmental protection if they were to put in place sustainable waste management systems. GHG produced by the waste management sector in developing countries and emerging economies are highly relevant, in particular because of the high percentage of biodegradable components contained in the waste.
With the gradual improvement of peoples’ living condition, the trend of output of waste (especially municipal waste) is obviously rising in recent years. On the other hand, land filling is the simplest and normally cheapest method for disposing of waste [2] and its main handling method in developing countries. Although, countries try to develop different Plans, despite waste reduction and recycling policies and waste pretreatment programs to lower the proportion of waste going to landfill, landfills will still be required to accommodate residual wastes [3].
Waste landfills have been recognized as the large source of anthropogenic GHG (especially methane) emission and an important contributor to global warming [4]. Methane emission from landfill is estimated to account for 3–19% of the anthropogenic sources in the world [4].
In general there are two basic methods used to calculate GHG emissions from the waste management. The IPCC approach (Kyoto protocol: Common Reporting Format (CRF) in accordance with UNFCCC guideline and IPCC Good practice guidance) and LCA approach (Life Cycle Assessment, ISO 14040/14044). Within the greenhouse gas (GHG) inventories based on IPCC methodology, positive impacts of reducing, re-using or recycling of waste as well as waste-to-energy strategies on climate protection are either attributed to other source categories – in particular to the energy sector and to industrial processes - or they are not accounted for at all.
This phenomenon is more obvious in developing countries such is Bosnia and Herzegovina. So far, the major methods that deal with municipal solid waste are open dumps, landfills and combustion as well as recycling. Adequate planning could resolve some part of pollution induced by municipal solid waste, but other problems, such as GHG emission from MSWDs, is one of major tasks that have to be dealt with. In fact, in order to maintain sustainable development and reduce emissions from municipal solid waste, each country today is trying to study and exploit new methods to reuse the municipal solid waste and change it to be a kind of recycling resource.
Decision makers, technicians and advisors working in waste management are not always aware of the contributions that sustainable waste management options can make to GHG emissions reduction. Hence the purpose of this paper is to show potential of GHG emission reduction and savings depending on various waste management scenarios in FB&H based on the waste content.
Despite there are intensive efforts directed to the recycling and recovery of solid wastes, In FB&H landfills remain and will remain an integral part of FBIH SWM strategies. The major fraction of waste ending up on landfills is organic (35-45% - source Federal WMP, Figure 1), which implies a high moisture content value, as expected in a developing country where food residuals are the major component of the solid waste stream. High level of biodegradable waste offers great opportunities for the GHG emissions reduction. Most organic materials are biodegradable and can be broken down into simpler compounds by aerobic and anaerobic microorganisms, leading to the formation of gas and leachate [5]. Having problems with the regional landfills development and lack of disposal area, FBiH needs to develop efficient strategies in order to decrease amounts of disposed waste, but also decrease GHG emissions. Improvement of waste handling (recycling and sanitary land filling) is one of the cost effective methods to reach goals given in the strategies [6].
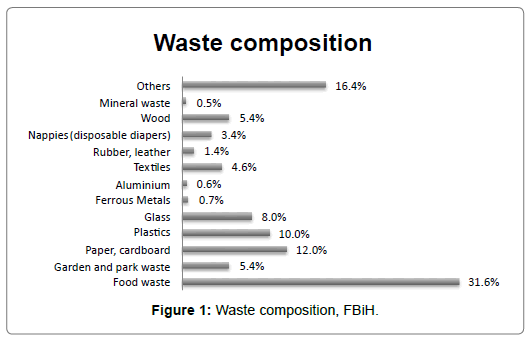
Figure 1: Waste composition, FBiH.
GHG Calculator
The global GHG emissions assumed for the waste sector by IPCC do not fully reflect the actual potential for reducing GHG emissions by the waste management sector. The positive impacts of reducing, reusing or recycling of waste, as well as waste to energy solutions is either attributed to other source categories or is not accounted for at all in the GHG inventories. Hence, in order to quantify GHG emissions in different waste management scenarios a simple Excel tool is used (SWM- GHG Calculator). The methodological basis for this tool is the life cycle approach. Different waste management strategies can be compared by calculating the GHG emissions of the different recycled and disposed of waste fractions over their whole life cycle.
In order to support decision-making, KfW in collaboration with GTZ commissioned IFEU to elaborate a simple Excel tool for quantifying GHG emissions in different waste management scenarios. This tool is used for different waste management scenarios in B&H.
Basically, the calculation method used in the SWM-GHG Calculator follows the Life Cycle Assessment (LCA) method. Different waste management strategies can be compared by calculating the GHG emissions of the different recycled and disposed waste fractions over their life cycle. The emissions calculated also include all future emissions caused by a given quantity of treated waste. This method corresponds to the “Tier 1” approach described in IPCC [4].
Input data
This paper study is focused on the region of Federation of Bosnia and Herzegovina. Population of FBiH is 2.373.000, which generate around 814.000 tons of domestic waste annually i.e. 0.94 kg/cap/day. Most of the waste has been disposed at the landfills, which are not fully sanitary. Just small fractions of the waste have been recycled or reused. Country specific GHG emission factor for electricity generation, based on the level of electricity production from fossil fuel and renewable energy production is taken to be 800 g CO2-eq/kWh.
Around 25% of the waste was not collected in 2013, these were scattered in an uncontrolled manner1.
In total, 3 scenarios are predicted. Basic state scenario expresses the current waste management figures. Those figures are also very easy reachable and implementable. Scenario 1 expresses the current situation (collection levels), a bit improved (suggest raise in average for 2%), where most of the waste is dumped, either in open dumpsite or in controlled landfills (Figure 2).
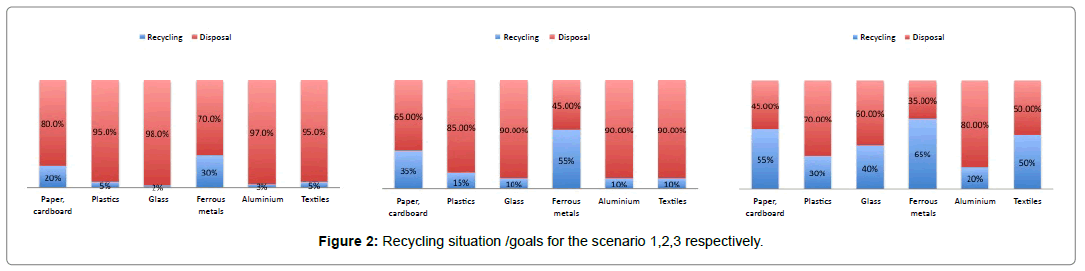
Figure 2: Recycling situation /goals for the scenario 1,2,3 respectively.
Scenario 2 is defined as a more advanced solid waste management system taking into account optimization of recycling activities and goals taken from the medium term Federal strategy goals (2018).
Water content of the waste can significantly differ, hence creating different calorific values. In case of FBiH waste is classified as one of high water content (taking into level of the organic waste content).
The suggested cost used for controlled dump and landfill without gas collection, sanitary landfill with gas collection and MBT with further treatment and land filling were 5, 15 and 50 Euros/ton, respectively.
The first scenario, representing the current situation in i.e. considered that most of the waste is land filled as shown in Error! Reference source not found. In total around 8% of waste is being recycled (out of which mostly paper and food waste (taking into account also largest amounts). Rest of the waste is disposed i.e. 10% scattered, 10% burned openly, 30% is at controlled landfills, only 20% at sanitary landfills, etc. (Figures 3 and 4).
Figure 2: Recycling situation /goals for the scenario 1,2,3 respectively.
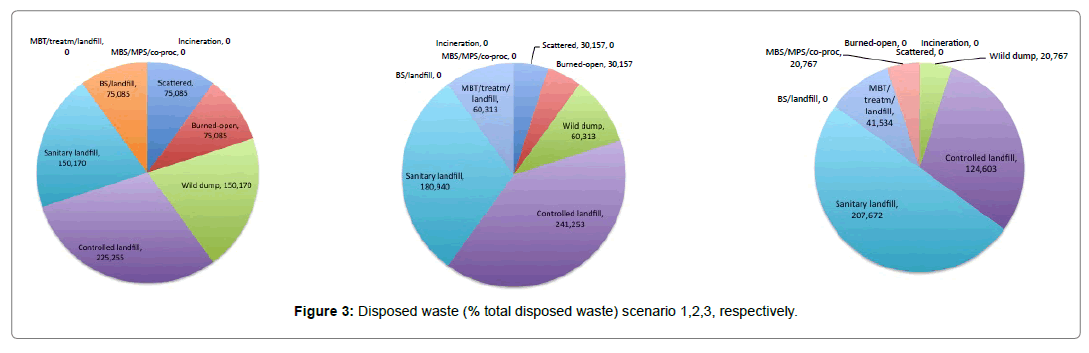
Figure 3: Disposed waste (% total disposed waste) scenario 1,2,3, respectively.
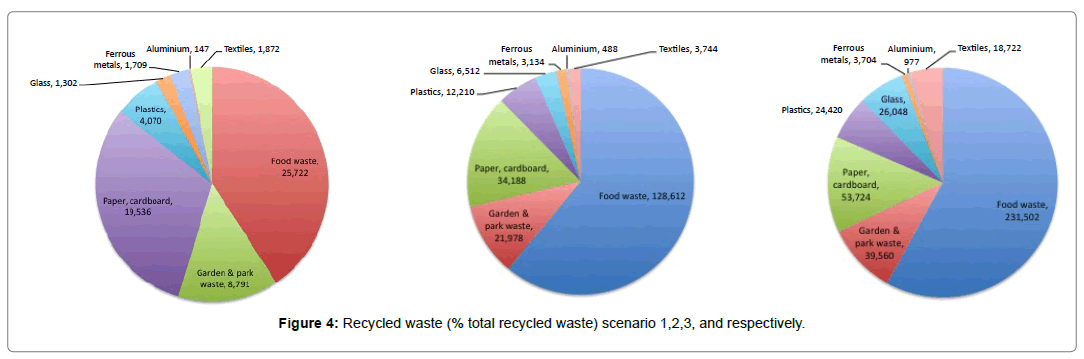
Figure 4: Recycled waste (% total recycled waste) scenario 1,2,3, and respectively.
The first scenario, representing the current situation in i.e. considered that most of the waste is land filled as shown in Error! Reference source not found. In total around 8% of waste is being recycled (out of which mostly paper and food waste (taking into account also largest amounts). Rest of the waste is disposed i.e. 10% scattered, 10% burned openly, 30% is at controlled landfills, only 20% at sanitary landfills, etc. (Figures 3 and 4).
Scenario 3 supposes 50% of waste to be recycled and 50% disposed. Most of the waste amounts recycled are from the food waste (58% of recycled waste), paper (13%) and garden & park waste (10%), followed by plastics (6%), glass (7%) and textiles (5%). Within this scenario 50% of the disposed waste ends up at sanitary landfills, 30% at controlled landfills and the rest is going to MBT to MBS (Figure 5).
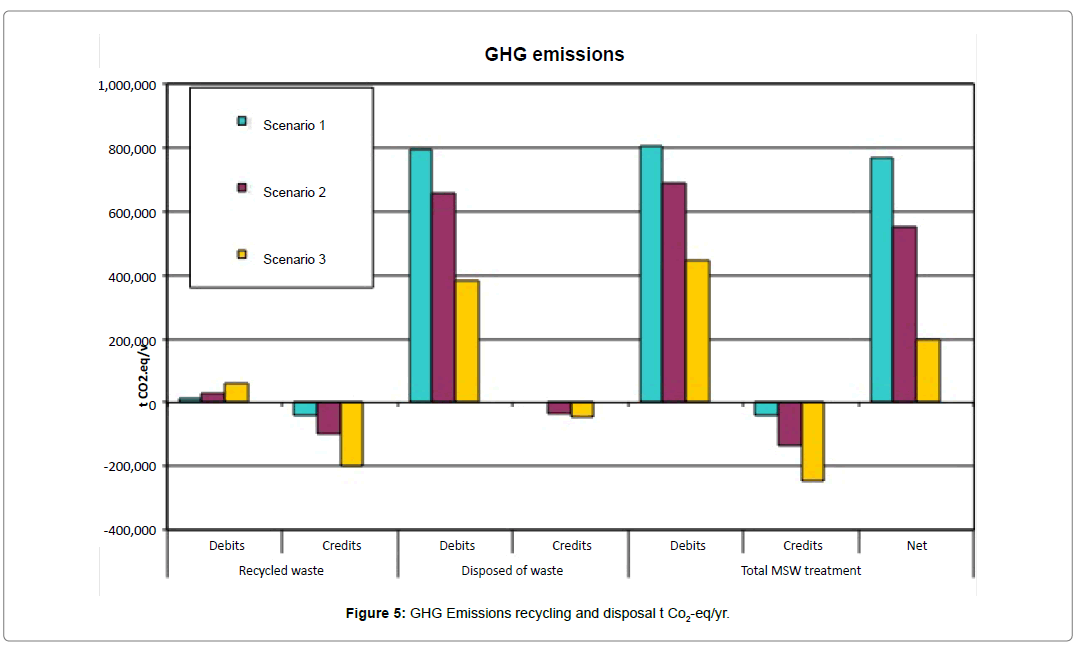
Figure 5: GHG Emissions recycling and disposal t Co2-eq/yr.
The impacts of the different waste management options on GHG emissions are shown in several results sheets, individually for each of the scenarios and comparing the scenarios. Calculated GHG emission savings for scenario 2 is estimated to be 100.000 t CO2-eq/yr (Figure 5) for waste disposal. From the same figure are visible savings for other scenarios obtain in accordance with the hypothesis given above (level of recycling and disposal types). GHG emission reduction is obvious in Scenario 3, where the emission reduction for total SWM is up to 600.000 t CO2-eq/yr (recycling and improved waste disposal).
In Tables 1 and 2, a summary of the three scenarios absolute and mitigation costs of GHG reductions are presented. If the difference in costs is <0 and/or the difference in GHG emissions is >0 no mitigation costs can be calculated, the result is “0”.
| S1/Basic state | Scenario 2 | Scenario 3 | |
|---|---|---|---|
| Euro/yr | Euro/yr | Euro/yr | |
| Recycled dry waste | 143,183 | 301,384 | 637,973 |
| Composted organic waste | 258,852 | 2,258,850 | 8,131,860 |
| Digested organic waste | 1,811,964 | 5,270,650 | 0 |
| Residual waste to controlled dump/landfill | |||
| without gas collection | 1,126,275 | 1,206,267 | 623,015 |
| Residual waste to sanitary landfill with gas | |||
| collection | 2,252,550 | 2,714,100 | 3,115,076 |
| Residual waste to BS/landfill | 1,501,700 | 0 | 0 |
| Residual waste to MBT/treatment/landfill | 0 | 3,015,667 | 2,076,718 |
| Residual waste MBS/MPS/co-proc | 0 | 0 | 1,453,702 |
| Residual waste to MSWI | 0 | 0 | 0 |
| Total | 7,094,523 | 14,766,916 | 16,038,344 |
Table 1: Results of absolute costs for calculated scenarios.
| S1/Basic state | Scenario 2 | Scenario 3 | |
|---|---|---|---|
| Total GHG emissions in t CO2-eq/yr | 765,139 | 553,449 | 196,253 |
| Total costs in euro/yr | 7,094,523 | 14,766,916 | 16,038,344 |
| Difference GHG compared to BS in t CO2-eq/yr | 0 | -211,690 | -568,886 |
| Difference costs compared to BS in euro/yr | 0 | 7,672,394 | 8,943,821 |
| Mitigation costs in euro/t CO2-eq | - | 37 | 16 |
Table 2: Mitigation costs per tonne of GHG emissions for the calculated scenario compared to Basic state.
The value of GHG emission mitigation in the Scenario 3 is 16 Euro/t. Scenario 2 is immediately profitable, since the total cost will be reduced for this management solution, yet this scenario has a minor effect on GHG reductions to the atmosphere compared to scenarios 3.
The calculations with the GHG calculator demonstrate that pursuing an approach facilitating consequent recycling and composting could achieve enormous reductions of GHG gas emissions. Waste management strategies only focusing on land filling will lead to higher GHG emissions. An integrated approach maximizing recycling and composting of waste can even lead to negative emissions.
SWM-GHG calculator is used to assess impact of different waste management strategies for country region. Given findings provide overview of the GHG emission mitigation opportunities through the different waste management strategies. Hence, the SWM- GHG Calculator offers an approximation of the GHG impacts of different strategies and is thus an important support for future strategies developments and decision makers.
Based on the calculations GHG emission reduction is obvious in Scenario 3, where the emission reduction for total SWM is up to 600.000 t CO2-eq/yr. This enormous reduction occurred due to the raise of recycling of 50% and sanitary land filling.
Although the total annual cost was relatively higher in scenarios 2 and 3, the mitigation costs per ton of GHG emissions were distinct. Therefore, the third scenario will be most cost effective among the four taking into account its benefits.
Improving SWM FBiH will benefit both in reduction of waste amounts to be disposed and GHG emissions. Hence, great attention should be given to the recycling process (public awareness and infrastructure) as one of the main future steps.