International Journal of Biomedical Data Mining
Open Access
ISSN: 2090-4924
ISSN: 2090-4924
Review Article - (2022)Volume 11, Issue 1
This paper is elaborating the sequences of whole genomes and proteins as real signals and deals with their spectrums in the frequency domain by applying discrete fourier transformation. Our main objective is to cluster the protein sequences by considering numerical type of representation for protein sequences, which is a binary one; the represented sequence is taken as a real signal; DFT is applied on each binary sequence of each nucleotide to get the corresponding spectrum. Then Power Spectrum (PS) methodology is applied and based on the ‘moment vectors’ distance matrix is obtained to draw the phylogenetic trees for comparison of the protein sequences. This phylogenetic tree is used to represent evolutionary relationship among organisms
Genomes protein; Spectrums frequency; Discrete fourier transformation; Binary sequences; Vectors; Phylogenetic matrix; Nucleotide
Sequencing in protein is the process of determining the amino acid sequence of all or part of a protein. By this process one can identify the protein or characterize its post-translational modifications. Typically, partial sequencing of a protein provides enough information (one or more sequence tags) to identify it with reference to databases of protein sequences derived from the conceptual translation of genes.
In the last few decades, several methods to classify genes and proteins have been proposed. For example, the k-means method is among the most popular alignment free methods. It gives comparable results to alignment-based methods while being computationally faster.
Another method, Discrete Fourier Transform (DFT) is a powerful tool in signaling and image processing. A DFT power spectrum of a protein sequence reflects the nucleotide distribution and periodic pattern of that sequence.
A new alignment free methodology to classify protein sequences based on the DFT power spectrum has been implemented in this paper. The values of these sequences are either 0 or 1 indicating the absence or presence of a specific nucleotide.
Representation of genome sequences are, in general, arbitrarily chosen, in the sense that the numeric used for representation does not depend on the nature of the nucleotides. It refers to numerical representation, where the nucleotides A, C, G, T are represented by the 4 components vectors (1,0,0,0), (0,1,0,0), (0,0,1,0) and (0,0,0,1). It is a 4 dimensional representation of binary digits. Protein sequence comparison was made with each of the above type of representations. So, we look for representation/representations, which might be generalized in the context of protein sequence comparison.
The method of inter coefficient distance [1] and moment vector [2] describes the analysis and representation of genome sequences. The question is whether such numerical type of representation is possible for amino acid sequences and if so, whether DFT based analysis could also be made for comparison of protein sequences expressed in terms of amino acids. Such generalization of numerical representation has been made recently [3]. Its usefulness has also been shown. So, it remains open to see whether it is possible to find protein sequence comparison based on such numerical type of representation of amino acids by using the method of ‘inter coefficient distance’ and the method of ‘moment vector’ respectively. Also, it remains open to compare the results obtained by the above two methods and decide which one is better.
Pairwise classification of amino acids is known for cardinality 3, 4, and 6. It may be mentioned that 2D representations of amino acids based on pair of 3 group classifications were obtained [4] and protein sequence comparison was made by applying the method of sequence segmentation. It remains open to see whether a unified formula could be obtained for the 2D representations of amino acids in 3, 4 and 6 categories. Also, it remains open to see whether 2D DFT could be applied directly to get the spectrum in all the cases and apply ICD method to compare protein sequences in a unified way.
We applied nontrivial real representation of amino acids other than the binary one noted the physico-chemical based representations of amino acids. This protein sequence comparison based on such a general representation is an open problem. Such a problem can only be attempted by ICD method, such as ‘Moment Vector’. We consider complex representations of protein sequences and the corresponding protein sequence comparisons. This is also an open problem and that it can be solved by analyzing the spectrum obtained by applying complex DFT, which is fundamentally different from the real DFT [5,6]. Finally, we consider all possible pair wise classifications of amino acids in different groups of same cardinalities.
Steps implemented
Step I
• Representation of protein sequences by binary values
• Take the represented sequence as real signal
• Apply FFT on the signal to get the corresponding spectrum
• Apply binary sequence method to get the descriptor vector
• Obtain distance matrix on the basis of the descriptor vectors to draw the phylogenetic trees for comparison of the protein sequences.
Step II
• Consider numerical representations of protein sequences based on physico-chemical properties of amino acids, molecular weight, volume and polarity.
• Apply FFT on each signal to get the corresponding spectrum; to obtain descriptors by applying ICD method and finally to obtain the phylogenetic trees for comparison of the protein sequences.
• Test which physiochemical property-based representation gives the best result in sequence comparison.
Step III
• Apply complex FFT on complex representation of protein sequences.
• Apply ICD method on the complex spectrum to obtain necessary descriptors for comparing protein sequences.
• Obtain a new type of representation of protein sequences based on classification of amino acids in pair wise groups of the same cardinality.
• Apply matrix form of 2D FFT on the represented sequence to obtain necessary
• Descriptors for comparing PROTIEN sequences.
Mathematics behind the research
In signal processing, sequences in time domain are commonly transformed into frequency domain to make some important features visible. The DFT often used to find frequency components of signal buried in a noisy time domain. For Example, let y be a signal containing a 60 Hz sinusoid of amplitude 0.8 and a 140 Hz sinusoid of amplitude 1. This signal can be corrupted by a zero mean random noise [7-12].
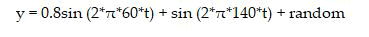
The frequencies can hardly be identified by looking at the original signal as in (Figure 1(a)) but can be seen quite clearly when the signal in transformed to frequency domain by taking the DFT (Figure 1(b)).

Figure 1: Signal in time domain and frequency domain. (a) Signal corrupted with zero-mean random noise and (b) Single- Sided power spectrum.
Moment vector
Protein sequence composed of nucleotides Alanine (A), Arginine (R), Asparagine (N), Aspartic acid (D), Cysteine (C), Glutamic acid (E), Glutamine (Q), Glycine (G), Histidine (H), Isoleucine(I), Leucine (L), Lysine (K), Methionine (M), Phenylalanine (F), Proline (P), Serine (S), Threonine (T), Tryptophan (W), Tyrosine (Y),Valine (V). One typical way to get numerical representation is to use binary indicator sequences. The values of these sequences are either 0 or 1 indicating the absence or presence of specific nucleotide. Specifically, for a given DNA sequence of length N, we define uA of same length N as follows:
If A is present at location n of the sequence
uC, uG, uT……. are defined as similarly.
The DFT of uA is UA where
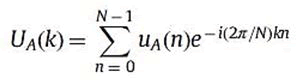
For k=0,……N-1.
The DFT power spectrum of uA is PSA where PSA=(UA(k))2 where k=0,……N-1.
We want moments coverage to zero gradually so that information loss is minimal, thus α1A =1/(NAN)j-1 is the best choice.
Therefore
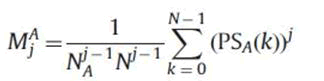
As we only have to consider the first half of power spectrum. The moments are improved as follows:
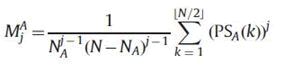
The moments for other nucleotides A,R,N,D,C, E,Q,G,H,I,L,K,M,F,P,S,T,W,M,Y,V are given similarly. Then the first few moments are used to construct vectors in Euclidean space. Our experimental results show that three moments are sufficient for an accurate clustering. Pair wise Euclidean distances between each Moment Vector are calculated to cluster the gene or genome sequences [13-20].
Came up with the idea of using normalized and centralized moments to compare sequences of different lengths. Motivated by the idea, we discovered a way to scale moments naturally, and only normalized moments are used to construct the Euclidean Vectors. Discarding the first coefficient is another novelty of our PS-M method.
The PS-M method is tested on different datasets that range from small to medium size, as well as short to long genomes. In order to compare and analyze various genomic data, moment vectors are calculated and matrix of Euclidean pair wise distances between those vectors is constructed (Figures 2-4). To cluster data into biological groups, a phylogenetic tree is drawn for ND4, ND5 and ND6 based on the distance matrix using the alignment free method (Binary indicator sequence) and after comparing each phylogenetic tree for each database (ND4, ND5, ND6) it is seen that all are similar with biological references [21-32].

Figure 2: For ND4.

Figure 3: For ND5.

Figure 4: Similarity distance.
Phylogenetic tree
The above study shows how the protein sequence is close in animals with similar characteristics. We have adopted a new method to cluster DNA by implementing this numerical representation using Fourier power spectrum so that the complexity will be less will be able cluster DNA very easily. All the three data sets i.e., ND4, ND5 and ND6 show similar characteristics.
[Crossref]
Citation: Pal B (2022) Comparison of Protein Sequence by use of Moment Vector under Binary Representation. Int J Biomed Data Min. 11:170.
Received: 02-Jun-2022, Manuscript No. JBDM-22-17702; Editor assigned: 06-Jun-2022, Pre QC No. JBDM-22-17702(PQ); Reviewed: 20-Jun-2022, QC No. JBDM-22-17702; Revised: 02-Aug-2022, Manuscript No. JBDM-22-17702(R); Published: 09-Aug-2022 , DOI: DOI: 10.35248/2090-4924.22.11.170
Copyright: © 2022 Pal B. This is an open-access article distributed under the terms of the Creative Commons Attribution License, which permits unrestricted use, distribution, and reproduction in any medium, provided the original author and source are credited.