Journal of Medical Diagnostic Methods
Open Access
ISSN: 2168-9784
ISSN: 2168-9784
Research Article - (2016) Volume 5, Issue 2
Background: Application of next generation sequencing (NGS) is revolutionizing the clinical molecular diagnostics industry. As this occurs, guidelines for validating NGS processes are limited, non-specific, and rapidly evolving. NGS validation projects are complex and expensive, so the validation experiments must be carefully considered, while being certain all current and evolving regulatory requirements are met.
Methods: We validated an end-to-end genetic testing process for a 16-gene hereditary colorectal cancer NGS panel. Global work flow was designed to provide high quality sequencing data for 100% of our targeted regions. Assay parameters tested were accuracy, precision, reportable range, reference range, analytical sensitivity, and analytical specificity.
Results: Five instrument runs were conducted, encompassing 115 samples, through an end-to-end process validation. Overall accuracy of the NGS portion of the assay was 99.98%. Single nucleotide variant detection accuracy was 100%. Insertion/deletion variant (INDEL) detection accuracy was 100% for INDELs of one to eight nucleotides and 97% overall (range one to 14 nucleotides) by NGS. There were no false negatives within our data set for a sensitivity of 100%.
Conclusion: Given the relative novelty of NGS in the clinical setting and rapidly evolving external guidance, clinical laboratories must develop their own strategies to design, develop, validate, and implement NGS assays. Our experiences highlight a chosen strategy as well as some of the benefits and limitations of NGS.
The uptake of next generation sequencing (NGS) technology in clinical practice is happening at a rapid pace. The immense power of NGS has enabled a high throughput method for the efficient identification of sequence variants associated with heritable diseases. However, NGS, like any other laboratory methodology, has its limitations, especially within GC-rich regions and for large insertion/ deletion (INDEL) variants. In order to overcome these limitations, multiple independent methods may be required to achieve a test with appropriate sensitivity and diagnostic utility.
As our understanding of the human genome evolves, so does the number of genes associated with hereditary conditions. In the case of colorectal cancer (CRC), approximately 20-30% is due to familial inheritance, with 5% of CRCs due to highly penetrant single-gene mutations [1,2]. The three major types of inherited CRC are Lynch syndrome (formerly known as hereditary non-polyposis CRC), familial adenomatous polyposis (FAP), and MUTYH-associated polyposis (MAP). While there are six primary genes (MLH1, MSH2, MSH6, PMS2, APC, and MUTYH) that contribute to these three major types of inherited CRC, there are multiple additional genes which are also known to cause hereditary CRC or contribute to an increased risk for colorectal cancer. Attempting to simultaneously sequence each of these genes using the standard Sanger sequencing approach would yield a test far too expensive for routine clinical application.
In order to provide an inexpensive and comprehensive genetic testing for hereditary CRC, we developed and validated a clinical Hereditary Colorectal Cancer Panel (HCCP), enabling the screening of numerous hereditary colon cancer genes in a timely and cost effective manner. The complete HCCP assay is a complex integration of complementary technologies, including NGS. While most of the technologies utilized for this test are well established in molecular testing, NGS is a relatively new technology in the clinical setting. Therefore, we have focused the majority of this article on the development and validation strategies employed for NGS test implementation.
Gene selection and probe design
Candidate genes for the panel were selected based on feedback provided by Mayo Clinic clinicians specializing in cancer genetics, Gene Reviews and other reputable sources [1,3,4]. The original list included 22 genes, all of which corresponded to entries in Online Mendelian Inheritance in Man (OMIM) [McKusick-Nathans Institute of Genetic Medicine, Johns Hopkins University (Baltimore, MD), {July, 2013}. A set of evidence-based criteria was then used to rule out genes with insufficient evidence to demonstrate cancer risk, thus ensuring the clinical utility of the genes included on the panel. These criteria were internally devised by the Mayo Molecular Genetics Laboratory independent of the gene list generation (Table 1) and applied to the initial list of candidate genes to aid in the final selection of our gene panel. Only genes with well-established disease risk, as demonstrated by a substantial body of research (i.e., those satisfying criterion 3, 4 or 5 listed in Table 1), were included. Additional evidence such as frequency of germline mutations in affected versus control populations and segregation with colorectal cancer in families was also considered. The final list of 16 genes, in order of established risk, included: APC, MLH1, MSH2, MSH6, PMS2, MUTYH, BMPR1A, SMAD4, STK11, PTEN, EPCAM, SCG5, AXIN2, TP53, CHEK2, and MLH3. Once the final gene list was determined, a SureSelect XT Custom Target Enrichment System (Agilent Technologies, Inc., Santa Clara, CA) reagent was designed to reference sequence GRCh37/hg19 (February 2009) using the Agilent eArray design software.
| Score | Criterion |
|---|---|
| 5 | Definitive evidence exists to support clear disease-risk repeatedly demonstrated by well-designed studies, disease-risk has been quantified (e.g. APC) |
| 4 | Substantial body of research exists to support clear disease-risk repeatedly demonstrated by well-designed studies; more research is needed to quantify risk (e.g. BMPR1A, PTEN) |
| 3 | Sufficient* evidence exists to suggest associated disease risk (e.g. TP53) |
| 2 | Case reports exist demonstrating germline mutations in individuals with the desired phenotype† (e.g. BMP4) |
| 1 | Disease-risk assumed solely based on theoretical protein interaction, pathway involvement, or protein function, no evidence of risk/disease in individuals with the desired phenotype† (e.g. MSH3) |
Table 1: Scoring criteria for including or excluding genes for the Hereditary Colorectal Cancer NGS Panel. *Sufficient meaning a) repeated occurrence of germline mutations in “X” gene with greater frequency in individuals with the desired phenotype† than in controls b) germline mutations in “X” gene segregating with disease in multiple families c) the identification of germline mutations in unrelated individuals with tumors demonstrating absence of protein expression for that gene. †Personal or family history of colon cancer.
Test design and workflow
For the 16 gene panel, a combination of NGS (13 genes), multiplex ligation-dependent probe amplification (MLPA) and long-range PCR (LR-PCR) with Sanger sequencing (one gene, PMS2), and array comparative genomic hybridization (aCGH) (16 genes) was utilized (Table 2). Reportable NGS variants or low coverage regions were identified for confirmatory or supplementary sequencing.
| Gene | Gen Bank Accession Number | Genomic Location* | Met criteria for final gene list | Testing Method |
|---|---|---|---|---|
| APC | NM_001127511 | chr5:112042718-112182435 | Yes | NGS, aCGH, Sanger |
| AXIN2 | NM_004655 | chr17:63524185-63558240 | Yes | NGS, aCGH, Sanger |
| BMPR1A | NM_004329 | chr10:88515896-88685444 | Yes | NGS, aCGH, Sanger |
| CHEK2† | NM_007194 | chr22:29083231-29138322 | Yes | NGS, aCGH, Sanger |
| MLH1 | NM_000249 | chr3:37034341-37092835 | Yes | NGS, aCGH, Sanger |
| MLH3† | NM_001040108 | chr14:75479967-75518735 | Yes | NGS, aCGH, Sanger |
| MSH2 | NM_000251 | chr2:47629763-47710860 | Yes | NGS, aCGH, Sanger |
| MSH6 | NM_000251 | chr2:48009721-48034584 | Yes | NGS, aCGH, Sanger |
| MUTYH | NM_001128425 | chr1: 45794415-45806642 | Yes | NGS, aCGH, Sanger |
| PTEN | NM_000314 | chr10:89622695-89729031 | Yes | NGS, aCGH, Sanger |
| SMAD4 | NM_005359 | chr18:48556083-48611909 | Yes | NGS, aCGH, Sanger |
| STK11 | NM_000455 | chr19:1205298-1228934 | Yes | NGS, aCGH, Sanger |
| TP53 | NM_000546 | chr17:7571220-7591363 | Yes | NGS, aCGH, Sanger |
| PMS2 | NM_000535 | Yes | aCGH, LRPCR+Sanger, MLPA | |
| SCG5-GREM1 | chr 15 | Yes | aCGH | |
| EPCAM | chr 2 | Yes | aCGH | |
| BRAF | No | Not applicable | ||
| CTNNB1 | No | Not applicable | ||
| EGFR | No | Not applicable | ||
| ENG | No | Not applicable | ||
| KRAS | No | Not applicable | ||
| PIK3CA | No | Eliminated from final design | ||
| PMS1 | No | Eliminated from final design | ||
| SK11IP | No | Eliminated from final design | ||
| TGFBR2 | No | Eliminated from final panel |
Table 2: NGS Hereditary Colorectal Cancer Panel (HCCP) genes and testing methods.* UCSC Genome Browser, GRCh37/hg19 (February 2009) primary reference assembly. †CHEK2 and MLH3 are not associated with a known hereditary cancer syndrome defined by a distinct spectrum of tumors. However, literature suggests that mutations in these genes may confer an increased risk of colon cancer and therefore, are predicted to contribute to cancer risk in patients and families.
Processing of samples and data was managed utilizing the services of three clinical core facilities (NGS, Sanger, and aCGH), a bioinformatics pipeline and a reporting laboratory, each with their own role. The overall workflow is shown in Figure 1.
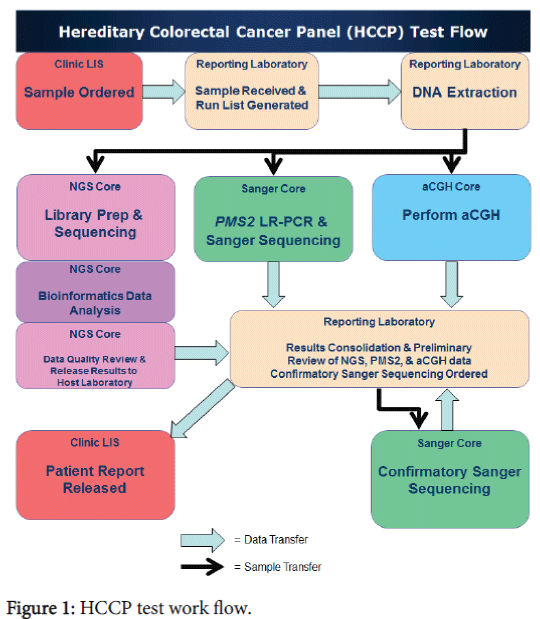
Figure 1: HCCP test work flow.
Library preparation
The SureSelect XT Custom Target Enrichment System [5] was utilized for library preparation and involved mechanical shearing (ultra-sonication) of 3 μg of genomic DNA to 150 base pair fragments with the LE220 (Covaris, Inc., Woburn, MA). Library preparation was automated on the Biomek FXp Laboratory Workstation (Beckman Coulter, Inc., Brea, CA) to include: enzymatic mediated end repair, adenine addition (a-tailing), adapter oligonucleotide ligation, and enrichment of adapter ligated fragments via a six cycle PCR. Following each of these process steps, the libraries were purified with the AMPure XP Purification system (Agencourt, Beckman Coulter, Inc.). Custom biotinylated RNA oligonucleotides complimentary to the target sequences were used for in-solution hybridization. After hybridization, Dynabead MyOne Streptavidin T1 beads (Life Technologies, Inc., Carlsbad, CA) were used to isolate (capture) the target regions and a 14 cycle PCR amplification added sample specific index sequences. A final quantitation of libraries was performed to ensure sufficient product (≥ 2.0 nM) for sample normalization and pooling. Library quantity and quality were evaluated on the Qubit 2.0 Fluorometer (Life Technologies, Inc.) and the 2100 Bioanlayzer (Agilent Technologies, Inc.).
Sequencing
Following library preparation, samples were normalized to a concentration of 2.0 nM, pooled, and sequenced on the Illumina GAIIx instrument [6] to produce 101 base single reads. Sixteen samples were pooled across each of four lanes of the Illumina GAIIx flow cell, with a total of 32 samples included on each instrument run.
Bioinformatics
The raw sequence output files were processed using CASAVA (Illumina, Inc.) and demultiplexed into individual sample FASTQ [7] sequence files. Initial read quality was assessed using the FastQC algorithm. Secondary analysis was performed using the CLC Genomics Server v4.1 (CLC Bio, Boston, MA), with read alignment to generate a BAM [8] file completed using the standard aligner and variant calling using the quality-score based caller. Variants require a minimum base quality of 20 and a neighbourhood (5 bases to the left and right of variant position) mean quality value of 15.
Alignment was done against the complete hg19 version of the human reference genome and subsequent variant calls reported back for the assay target region only. Post-secondary analysis was carried out using custom scripts to annotate the variants and load them into a custom-built web application for quality review and results interpretation. Validation of the variant calling was carried out using both synthetic and Sanger confirmed samples. INDEL detection was profiled using synthetic data and shown to be accurate up to insertion and deletion lengths of eight base pairs. The complete bioinformatics workflow was further validated through input/output testing by the Mayo Software Quality Assurance team. Target sequences with 100% redundant sequence found in off-target genomic regions were identified by a systematic analysis of all read-length fractions within the assay target, using the CLC aligner.
Data consolidation and confirmatory testing
Data from the testing performed by the three clinical core facilities were consolidated and reviewed, following completion of NGS, aCGH, and PMS2 sequencing. NGS variants or low coverage regions were identified and exported to a custom data consolidation software program, which transferred information to the Sanger sequencing core where confirmatory or supplementary sequencing was performed.
NGS assay validation
Samples were selected for end-to-end process validation with additional samples being run by NGS alone to satisfy NGS assay specific validation requirements [9-12].
In total, 115 individual samples were run: 80 cases known to be genotype positive, 20 phenotypically normal, expected to be genotype negative, ten analytical measurement range (AMR) to test the limit of detection at given variant frequencies, and five analytical range (AR) samples to test the limit of detection at various input DNA quantities.
Included within the 20 phenotypic negatives were six samples collected in either acid-citrate-dextrose (n = 3) or sodium heparin (n = 3), to test for interfering substances. All other samples were initially collected as whole blood samples with EDTA as the anticoagulant.
The assay validation was completed in five instrument runs, each with 32 individually indexed samples multiplexed together. Assay parameters tested were accuracy, precision, reportable range, reference range, analytical sensitivity (limit of detection), analytical specificity, and interfering substances/events.
The results described below are those obtained from the NGS portion of the overall assay validation.
Accuracy
Of the 100 samples sequenced to assess accuracy, (80 phenotypic positive and 20 phenotypic negative) two phenotypic positive samples failed due to technical error. Within the remaining 78 phenotypic positive samples, six samples contained multi-exon deletions or duplications that were not expected to be detected due to the limitations of NGS technology at the time of testing, and were excluded from the NGS accuracy calculations. Two additional samples contained INDELs greater than eight base pair.
While these INDELS were not expected to be detected by our NGS informatics process, we included these two samples in the accuracy calculations, leaving 92 total samples evaluated for accuracy. Accuracy was considered acceptable if the assay demonstrated greater than 90% concordance with the previously reported results obtained by Sanger sequencing or restriction fragment length polymorphism (RFLP) methods. Out of 92 samples, 89 were accurately called by the NGS assay for an overall accuracy of 96.7%.
Of the 72 phenotypic positive samples included in the accuracy calculations, 71 samples (98.6%) had variations accurately called by NGS. Single nucleotide variant (SNV) detection accuracy was 100% with 43/43 called correctly by NGS. INDEL accuracy was 100% for INDELs of one to eight nucleotides in length (n = 27/27) and 97% overall (range 1-14 nucleotides, n = 28/29), with only one of two INDELs greater than eight nucleotides detected by this assay.
A 14 base pair insertion was correctly called and confirmed by Sanger sequencing, however an insertion of 11 base pairs was not detected. Detection of INDELs greater than eight base pairs was a known limitation of this technology at the time of initial validation.
The 20 phenotypic negative samples were anonymous laboratory waste specimens referred for other non-related testing and had not been evaluated for hereditary colorectal cancer. Eighteen out of these twenty were identified as negative.
One sample had an alteration in MUTYH, consistent with carrier status for the autosomal recessive CRC, MUTYH (or MYH)-associated polyposis syndrome and thus not expected to significantly increase the risk for CRC. Another clinically normal sample harbored a c.1100delC variant in CHEK2. Mutations in this gene are known to be of lower penetrance, increasing a patient’s risk of breast cancer or Li-Fraumeni like syndrome, but at a lower penetrance where it’s not entirely unusual that we could find a mutation in a normal donor sample [3,13].
Nine of these samples each had a likely benign variant identified by NGS and confirmed with Sanger sequencing. Therefore, of the 20 phenotypic negative samples, two of them harbored a variant that would be reported out as significant, but not necessarily indicative of imminent disease.
Precision
Assay precision was assessed for both inter-assay precision and intra-assay precision through the use of 3×3×3 experiments.
These experiments included three phenotypic positive samples across three separate instrument runs (inter-assay precision) or three samples run in triplicate within the same instrument run (intra-assay precision).
In both cases, the stated acceptance criteria (100% concordance of variant calls within the regions of interest and a repeat rate of <10%) were met. Precision data is shown in Table 3.
| Sample | Gene | Expected positive result | Genomic Position* | Replicate 1 Variant Detected | Replicate 2 Variant Detected | Replicate 3 Variant Detected |
|---|---|---|---|---|---|---|
| Intra-Assay Results | ||||||
| 1 | MSH2 | 1656delC | 4.8E+07 | c.1655het_delC† | c.1655het_delC† | c.1655het_delC† |
| 2 | APC | c.9+5G>A | 1.1E+08 | c.1258+5G>GA‡ | c.1258+5G>GA‡ | c.1258+5G>GA‡ |
| 3 | MSH6 | 2061T>A | 4.8E+07 | c.2061T>A, | c.2061T>A, | c.2061T>A |
| Inter-Assay Results | ||||||
| 4 | MSH6 | 1691C>A | 4.8E+07 | c.1691C>A | c.1691C>A | c.1691C>A |
| 5 | MSH2 | 599_600insAT | 4.8E+07 | c.599_600het_insTA† | c.599_600het_insTA† | c.599_600het_insTA† |
| 6 | APC | 1264G>A | 1.1E+08 | c.1264G>A‡ | c.1264G>A‡ | c.1264G>A‡ |
Table 3: Results for Intra-Assay and Inter-Assay Precision Experiments *UCSC Genome Browser, GRCh37/hg19 (February 2009) primary reference assembly. †These mutations are the same. The Sanger call is correct and is called most 3'. ‡The Molecular Genetics Laboratory uses the historic nomenclature for the APC gene. See included genomic location for confirmation of mutation calling.
Analytical sensitivity was measured using a three-fold approach: conducting a false negative analysis for samples having full Sanger sequence data available, a study of AMR (limit of detection at given variant frequencies), and a study of analytical range (limit of detection at given input DNA quantities). There were a total of 26 samples utilized to measure analytical sensitivity, 20 phenotypic negative and six phenotypic positive samples. These samples were Sanger sequenced for all genes and exons on this panel. We treated all variants called by Sanger as an event for which either a correct variant call (true positive) or a variant not called (false negative) was made by NGS. The final calculation was made by dividing the number of true positives by the sum of true positives and false negatives.
Sanger sequencing identified 619 variants within the targeted region, of which eight were a common 16 base insertion not expected to be detected by NGS [13]. Of the remaining 611 Sanger identified variants; there were no false negatives within our data set, resulting in 100% sensitivity.
AMR and analytical range were set up to test the limits of detection (LOD). The AMR tested decreasing amounts of library preparation input material, starting at the manufacturer’s recommended 3.0 μg of DNA and decreasing in amounts to 2.0, 1.0, 0.5 and 0.25 μg. All assay quality metrics for library preparation, instrument run and NGS data analysis were met for the 3 μg and 2 μg inputs. The 1.0 μg input sample met the minimal library preparation quality requirements, but failed to meet instrument run and NGS data analysis quality requirements. The samples below 1.0 μg input failed to meet any of the quality requirements. Therefore, the determined AMR LOD for this assay was 2.0-3.0 μg.
The analytical range of the NGS assay was tested by creating synthetic genotypes of decreasing frequency by mixing samples with known homozygous variants with wild type DNA. We tested the ability of the assay to detect variants at frequencies of 50, 35, 30, 25, 20, 15, 10, 5, 2, and 1 percent. Due to bioinformatics filtering and the reduced reliability of Sanger sequencing to confirm reportable alterations below a variant frequency of 20%, we did not review variants ≤10% (even though they were often observed in the raw data), therefore the NGS analytical range LOD was set to ≥15%. Table 4 shows the NGS determined frequency for variants tested in the analytical range LOD experiment, down to 15%.
| Variant | 50% | 35% | 30% | 25% | 20% | 15% |
|---|---|---|---|---|---|---|
| AXIN2 c.148C>T | 50 | 36 | 31 | 25 | 22 | 15 |
| MLH1 c.1668-19A>G | 45 | 26 | 28 | 25 | 18 | 12 |
| MLH3 c.4335A>G | 43 | 32 | 31 | 23 | 18 | 14 |
| MSH6 c.186C>A | 51 | 32 | 29 | 25 | 18 | 17 |
| MSH6 c.260+22C>G | 37* | 35 | 28 | 22 | 15 | 13 |
| MSH6 c.540T>C | 50 | 34 | 33 | 23 | 22 | 15 |
| MSH6 c.276A>G | 47 | 36 | 28 | 24 | 21 | 17 |
| MSH6 c.3438+14A>T | 45 | 36 | 33 | 29 | 23 | 16 |
| MLH3 c.3643+27T>C† | 100/100 | 100/100 | 100/100 | 100/100 | 100/100 | 100/100 |
| Median | 47‡ | 35 | 30 | 25 | 20 | 15 |
Table 4: Determined Variant Allelic Frequency (Analytical Range LOD) – artificial constructs homozygous for the listed polymorphism created at 50%, 35%, 30%, 25%, 20%, and 15%. *This alteration was detected at a lower than expected frequency within a region of low coverage (<100x). The sample was confirmed heterozygous by Sanger sequencing. †Both samples used for creation of the artificial constructs are homozygous for this polymorphism. The expected result would be 100% variant frequency across all dilutions. ‡Excludes MSH6 c.260+22C>G which did not meet minimum coverage requirements.
Analytical specificity
The analytic specificity of the NGS assay was measured in two ways. First, the reads mapped to the human genome and reads mapped to our target regions were evaluated. Read data from regions outside the reportable range were masked and not included in the assay validation. Table 5 shows read mapping data observed in one of the five instrument runs of this validation.
| Sample | Read Number | Reads Mapped | Percent Reads Mapped | Reads Mapped to Target | Percent Mapped to Target | Number of SNPs | SNPs Mapped to Target | Number of DIPs | DIPs Mapped to Target |
|---|---|---|---|---|---|---|---|---|---|
| 1 | 1705557 | 1696273 | 99.5 | 295409 | 17.3 | 5047 | 24 | 1311 | 5 |
| 2 | 9860831 | 9805772 | 99.4 | 1751024 | 17.8 | 36245 | 32 | 10799 | 5 |
| 3 | 8676799 | 8635168 | 99.5 | 1470858 | 17 | 31311 | 27 | 8359 | 2 |
| 4 | 10269831 | 10214579 | 99.5 | 1703521 | 16.6 | 38775 | 30 | 10588 | 3 |
| 5 | 9872898 | 9821336 | 99.5 | 1743823 | 17.7 | 35470 | 26 | 9421 | 4 |
| 6 | 8262455 | 8224209 | 99.5 | 1584114 | 19.2 | 31300 | 27 | 8762 | 5 |
| 7 | 10347034 | 10288449 | 99.4 | 1735613 | 16.8 | 44243 | 41 | 12221 | 3 |
| 8 | 10187246 | 10138526 | 99.5 | 1794333 | 17.6 | 34462 | 33 | 9416 | 4 |
| 9 | 7571350 | 7536458 | 99.5 | 1339840 | 17.7 | 31276 | 23 | 7977 | 4 |
| 10 | 8557028 | 8516113 | 99.5 | 1501814 | 17.6 | 32276 | 31 | 8860 | 5 |
| 11 | 6134420 | 6103166 | 99.5 | 1151316 | 18.8 | 21838 | 28 | 6055 | 5 |
| 12 | 10225394 | 10171191 | 99.5 | 1940867 | 19 | 35749 | 35 | 9831 | 5 |
| 13 | 9181506 | 9135346 | 99.5 | 1801949 | 19.6 | 29999 | 29 | 8035 | 3 |
| 14 | 9994677 | 9942469 | 99.5 | 1800472 | 18 | 34051 | 32 | 9208 | 3 |
| 15 | 5449461 | 5420162 | 99.5 | 1010224 | 18.5 | 19956 | 30 | 5499 | 7 |
| 16 | 8409392 | 8363105 | 99.4 | 1551494 | 18.4 | 33190 | 34 | 9337 | 4 |
| 17 | 8903420 | 8858285 | 99.5 | 1781176 | 20 | 31297 | 33 | 7820 | 4 |
| 18 | 7243361 | 7202510 | 99.4 | 1319148 | 18.2 | 28245 | 29 | 7995 | 3 |
| 19 | 12463244 | 12404181 | 99.5 | 2650594 | 21.3 | 46256 | 32 | 13915 | 4 |
| 20 | 9904062 | 9853860 | 99.5 | 2188346 | 22.1 | 29317 | 35 | 8142 | 3 |
| 21 | 9288774 | 9226286 | 99.3 | 1611844 | 17.4 | 36718 | 25 | 6714 | 2 |
| 22 | 10083275 | 10032435 | 99.5 | 2175807 | 21.6 | 37967 | 36 | 11275 | 4 |
| 23 | 9554976 | 9507166 | 99.5 | 2059056 | 21.5 | 31928 | 33 | 8632 | 4 |
| 24 | 10609193 | 10560697 | 99.5 | 2077398 | 19.6 | 38821 | 25 | 7051 | 5 |
| 25 | 10557418 | 10511764 | 99.6 | 2361758 | 22.4 | 33297 | 30 | 10007 | 4 |
| 26 | 10201421 | 10152255 | 99.5 | 2300590 | 22.6 | 35368 | 24 | 10919 | 5 |
| 27 | 9478037 | 9427693 | 99.5 | 1889725 | 19.9 | 39342 | 23 | 12378 | 5 |
| 28 | 9070408 | 9018082 | 99.4 | 2184894 | 24.1 | 33618 | 24 | 9205 | 4 |
| 29 | 10763871 | 10720109 | 99.6 | 2444033 | 22.7 | 31834 | 27 | 8694 | 4 |
| 30 | 11707608 | 11651935 | 99.5 | 2267109 | 19.4 | 42448 | 15 | 11424 | 5 |
| 31 | 11011349 | 10958167 | 99.5 | 2698072 | 24.5 | 30819 | 26 | 7645 | 5 |
| 32 | 11688313 | 11631653 | 99.5 | 2202958 | 18.8 | 52426 | 13 | 14855 | 5 |
| Lane 1 | 1223663 | 1019917 | 83.3 | 155648 | 12.7 | 5058 | 24 | 1003 | 2 |
| Lane 2 | 1217149 | 1006850 | 82.7 | 154200 | 12.7 | 4878 | 24 | 1016 | 2 |
| Lane 3 | 1301721 | 1092918 | 84 | 168772 | 13 | 4966 | 26 | 1072 | 3 |
| Lane 4 | 1177553 | 966737 | 82.1 | 146298 | 12.4 | 4674 | 25 | 981 | 2 |
| Lane 5 | 1098845 | 886507 | 80.7 | 174734 | 15.9 | 2474 | 23 | 534 | 4 |
| Lane 6 | 1076257 | 884072 | 82.1 | 174155 | 16.2 | 2483 | 23 | 529 | 4 |
| Lane 7 | 1065343 | 873454 | 82 | 173211 | 16.3 | 2434 | 23 | 528 | 3 |
| Lane8 | 1089164 | 894286 | 82.1 | 177761 | 16.3 | 2411 | 24 | 519 | 4 |
Table 5: Read mapping data from one of the five instrument validation runs.
The second measure of analytical specificity was a false positive analysis for those samples which had full Sanger sequencing data. Each nucleotide to be evaluated (all nucleotides within the region of interest, specifically- exons plus 30 bases flanking each exon) was treated as an event for which either a correct, wild type sequence, call (true negative) or an incorrect variant call (false positive) was made. The final calculation was made by dividing the number of true negatives by the sum of true negatives and false positives. The number of true negatives becomes quite large due to the fact that a single wild type sequence would contain 48,513 true negative calls and thus the reported value will be approaching one. The analytical specificity as calculated with our false positive analysis was (1260737/1260737) 100% specificity. While this number is quite impressive, one must take note of the raw false positive numbers as they do occur, only at a very low frequency as compared to all the bases interrogated in the design. In our analysis, we detected 18 false positives in total in nine total samples, averaging two per sample. These DNA alterations of undetermined significance were identified by NGS and confirmed by Sanger sequencing would eventually be classified as benign and therefore, not reported.
The reference range of our assay is the sequence noted in the UCSC Genome Browser, GRCh37/hg19 (February 2009) primary reference assembly. The acceptance criteria were met since ≥ 99% of the NGS reads generated on a run aligned to the reference sequence (Table 5). The reportable range for this assay is any reportable alteration within exons ±30 base pair of those genes listed in Table 2.
Bioinformatics
The bioinformatics pipeline was extensively validated through our Software Quality Assurance (SQA) team to be certain that all scripts and file transfer operations occurred with high fidelity. In addition, the ability of the bioinformatics pipeline to detect known variants and minimize the calling of false positives was assessed as part of our global assay validation previously discussed. In addition, specific operations were performed to assess the reproducibility of the CLC Bio and FASTQC software. These three samples were run through the bioinformatics pipeline three separate times and sample quality (Table 6), mapping reports (Table 7), variant information (Table 8), and coverage plot reproducibility (Figure 2) information collected.
| Sample Identifier | Total sequences | Average best quality Score | GC content | Pct>Q30 |
|---|---|---|---|---|
| VAL450_1 | 5648685 | 33.8 | 45 | 87.7 |
| VAL450_2 | 5648685 | 33.8 | 45 | 87.7 |
| VAL450_3 | 5648685 | 33.8 | 45 | 87.7 |
| VAL415_1 | 10226706 | 33.55 | 45 | 88.25 |
| VAL415_2 | 10226706 | 33.55 | 45 | 88.25 |
| VAL415_3 | 10226706 | 33.55 | 45 | 88.25 |
| VAL430_1 | 9309482 | 32.075 | 46 | 82.4 |
| VAL430_2 | 9309482 | 32.075 | 46 | 82.4 |
| VAL430_3 | 9309482 | 32.075 | 46 | 82.4 |
Table 6: Sample quality - CLC Bio & FASTQC software.
| Sample Identifier | Total Sequences | Reads Mapped to Reference | % Mapped to Reference | Read Mapped to .bed file | % Mapped to .bed file |
|---|---|---|---|---|---|
| VAL450_1 | 5648685 | 5600850 | 99.2 | 781495 | 13.8 |
| VAL450_2 | 5648685 | 5600850 | 99.2 | 781612 | 13.8 |
| VAL450_3 | 5648685 | 5600846 | 99.2 | 781406 | 13.8 |
| VAL415_1 | 10226706 | 10123175 | 99 | 1657005 | 16.2 |
| VAL415_2 | 10226706 | 10123175 | 99 | 1657120 | 16.2 |
| VAL415_3 | 10226706 | 10123176 | 99 | 1657083 | 16.2 |
| VAL430_1 | 9309482 | 9266674 | 99.5 | 1725369 | 18.5 |
| VAL430_2 | 9309482 | 9266674 | 99.5 | 1725117 | 18.5 |
| VAL430_3 | 9309482 | 9266674 | 99.5 | 1725342 | 18.5 |
Table 7: Mapping report - CLC Bio & FASTQC software.
| Sample Identifier | SNPs in Ref | SNPs in bed | DIPs in Ref | DIPs in bed |
|---|---|---|---|---|
| VAL450_1 | 19325 | 22 | 4922 | 3 |
| VAL450_2 | 19325 | 22 | 4922 | 3 |
| VAL450_3 | 19325 | 22 | 4922 | 3 |
| VAL415_1 | 36218 | 27 | 8054 | 6 |
| VAL415_2 | 36218 | 27 | 8054 | 6 |
| VAL415_3 | 36218 | 27 | 8054 | 6 |
| VAL430_1 | 42954 | 32 | 11534 | 6 |
| VAL430_2 | 42954 | 32 | 11534 | 6 |
| VAL430_3 | 42954 | 32 | 11534 | 6 |
Table 8: Variant information - CLC Bio & FASTQC software.
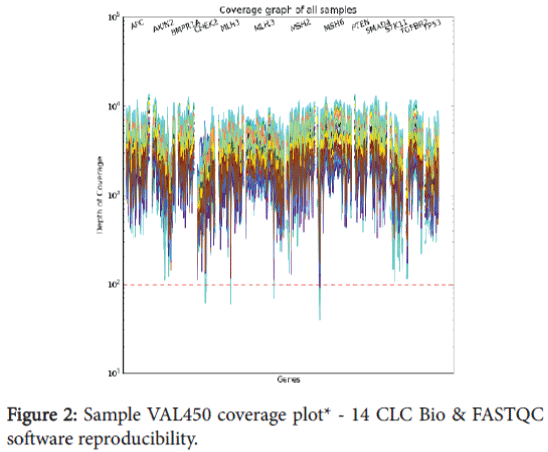
Figure 2: Sample VAL450 coverage plot* - 14 CLC Bio & FASTQC software reproducibility.
The sample quality results (Table 6) indicate that FASTQC is not biased when run on the same sample multiple times, and the sequence quality and GC content remain unchanged. The mapping report (Table 7) shows that the total number of reads, reads mapped to reference, and reads mapped to the bed file (target regions) remain unchanged for all three sample. The number of variant calls (Table 8) indicates the number of single nucleotide polymorphism (SNP) and insertion/ deletion polymorphism (DIP) calls remains unchanged across the three samples. Figure 2 includes an example from one of the samples and shows uniformity of coverage across the target regions for each of the three replicates of this sample. This data verifies the reproducibility of the CLC Bio software is 100% concordant for all three samples.
The continued maturation of NGS technology is allowing clinical diagnostic laboratories to implement these methods in pursuit of comprehensive routine testing. Through the work described here, we were able to develop, optimize, and successfully implement a comprehensive panel utilizing multiple molecular technologies useful for diagnosing patients with suspected hereditary colorectal cancer.
Gene panel based testing is rapidly gaining traction since it offers a more comprehensive and cost effective approach for diagnostic analysis of patients suspected to have a certain disease. NGS technology allows this type of testing to be performed less expensively than investigating just two or three individual genes by traditional Sanger sequencing methods. More importantly, given the diagnostic overlap with disorders that have different genetic involvement, broad panel based tests can be more diagnostically efficient than traditional single gene serial analysis approaches. Though payer reimbursement has been challenging in this space, careful analysis should prove NGS panel tests to be of a higher value for both patients and payers.
Another key advantage inherent to the NGS process is the sensitivity of the assay to detect specific mutations like single nucleotide variants and small INDELS. Our work here demonstrated that we could easily detect mutations down to 15% variant/normal allele ratios. This is a self-imposed limit within our laboratory, chosen since beyond this point we began to see false positive rates rising. In reality though, it was quite obvious to manually inspect our traces and see evidence of the variant alleles below 5%. In production, however, it is not practical for manual review of all loci, so our cut off was set at a level that allows for reliable calling of mosaic alterations automatically. As a point of reference, Sanger sequencing has a commonly recognized limit of detection in the 20% range [14]. Improved sensitivity utilizing NGS, as we have demonstrated here, is important since many hereditary diseases can be the result of new (de novo) mutations in the index cases. For example, in FAP the index de novo mutation rate is as high as 25%. Using traditional, less sensitive methods might not detect the causative mutation. Like any other technology, expert knowledge must first be gained by the user prior to routine clinical use. A welldesigned validation can be of great service in this capacity, and is especially important in the application of NGS as it, like any other test, has limitations, though often the excitement around the technology makes it easy for laboratorians to under-discuss the topic.
One of the most important limitations of clinical NGS applications is the decrease in detection efficiency for larger insertions and deletions (i.e., 8 bp). The chemistry does not seem to be the limiting factor as manual inspection often shows that there are reads confirming the large event, yet the alignment software is unable to place them properly and thus call them out in a variant file. While the size of a detectable event is getting larger all the time, it still cannot rival that of Sanger sequencing. Furthermore, detecting complete exon deletions and duplications is just becoming available.
This limitation in the bioinformatics capabilities highlights another barrier to accessing the technology. Currently, it is still preferable to have a team of savvy bioinformaticians and information technology specialists at your disposal. There is a paucity of end to end bioinformatics solutions that one could purchase off the shelf and that can be run by a standard laboratory technician. Given the nascent nature of NGS testing, using an off the shelf solution without expert understanding and testing of the complex analytics used could put a laboratory in jeopardy. What is more commonly deployed, as was done in this case, is to create a hybrid of purchased and custom created software. The consequence of this is that any internally developed solution requires expert bioinformatics support to fix bugs, implement new/improved industry capabilities, and validate the systems as required by the laboratory.
Another limitation needing careful consideration is the potential for false positive results by NGS as compared to Sanger sequencing. This topic has been addressed by nearly every publication on NGS methodologies. However, digging beyond the surface, the need to confirm all results seems to be an overly-Draconian approach to the real, yet limited risk of a false positive result. A recent publication suggests that within controlled parameters, specific alterations like SNVs might not need confirmation [15,16]. We agree and feel that our zero false positive rate in our validation data suggest this is a more realistic and evidence based position to take.
In summary, we have described the validation and implementation of a multigene NGS panel useful for diagnosing patients suspected of a hereditary colorectal cancer syndrome. In our pursuit of this validation we have learned the strengths and weaknesses of the current NGS methodologies, as tested here. Considering both, we feel that the time is right for laboratories to begin gathering experience in this field and panels offer an attractive and limited way to begin this education. NGS is a complicated method, yet not too dissimilar from many new technologies that get introduced into the laboratory. They must be studied in a carefully designed validation to fully know the correct application and limitations of the assay. Once that has been completed, the laboratorian has another strong diagnostic tool in their arsenal of methods to help our patients.
We thank the staff of the Clinical Genome Sequencing Laboratory (CGSL) at Mayo Clinic for their ongoing support of the institution’s clinical NGS needs. We would also like to thank the Mayo Clinic Department of Laboratory Medicine and Pathology and the Center for Individualized Medicine for their generous support of this work.