Journal of Geology & Geophysics
Open Access
ISSN: 2381-8719
ISSN: 2381-8719
Research Article - (2012) Volume 1, Issue 1
Determination of the formation of the Pabdeh boundary is a main challenge in Zagros sedimentary basin area. The work on hand is an attempt to clarify those based on chemical changes. The location under observation is the outcrop of the Pabdeh Formation (Paleocene-Oligocene) in Bangestan Anticline, the southern part of Zagros orogenic belt. The Pabdeh Formation stratigraphy linked to Asmari and Gurpi has been introduced as a gradual type and somewhat vague in this respect. To overcome these problems, 12 fresh samples from Gurpi, Pabdeh, and Asmari have been selected and chemically analyzed. Variation on both major and trace elements during this stratigraphy sequence generally reveal the high peaks of their frequencies in the lower and upper borders of the Pabdeh Formation. This border is different to the border which was determined during normal studies. These variations illustrate that the stratigraphy age reduction in the boundary of expected deposition time is based on present data documented that the Cretaceous-Tertiary boundary (K-T) had started lower than the stratigraphy limit. Geochemical ratios, including Ni/Co, V/Cr, and V/(V+Ni) were used to diagnose the Paleo-environmental conditions of Pabdeh Formation in comparison to Gurpi and Asmari formations. These chemical indicators present variable paleoredox conditions for the Pabdeh Formation.
Keywords: Chemo-stratigraphy, K-T boundary, Pabdeh Formation, Zagros
According to the stratigraphy evidence available, Pabdeh-Asmari and Pabdeh-Gurpi have been mentioned as ultimate border in the Zagros sedimentary basin [1]. Zagros Basin is one of the most famous oil basins in Middle East [2]. It should be mentioned that in Zagros; these formations have been analyzed from different surface and subsurface locations. Regardless of the thickness of this formation and because of the limitation of its fossil content and also pelagic complexities together with turbidities and generation of a relative condition, the border of this formation with Asmari and Gurpi formations were eventually reported and there have been disputes regarding the these borders.
By petro graphic and facies analysis of exposure to the type of section of the Pabdeh Formation, Paleogeographic reconstruction during the Eocene period indicated that the area was situated in the tropics, storm-dominated paleo latitudes [3]. A regional sequence stratigraphy model has also been proposed for the Oligo-Miocene Asmari and Pabdeh Formations in the Dezful Embayment of SW Iran [4].
The Pabdeh Formation is a predominantly marble-shale unit of marine origin developed in southwest Lorestan, Khuzestan, coastal and sub-coastal Fars Province. There is a connection between the Cretaceous (Gurpi Formation) and Oligocene time (Asmari Formation). The Cretaceous / Paleogene boundary (KTB) determination is now a serious world-wide problem to reconstruct the Cretaceous to Cenozoic sediments and geo-history. There is a lot of literature available in this area of research [5-7]. In Iran, there are documents about the base of the Paleocene within the Gurpi Formation in Lorestan area, SE Zagros that implies ca. 65.5 Ma [8-11]. They believe that this age is corresponding to an early folding phase near the Cretaceous-Paleocene boundary. According to previous studies the KTB is located at the uppermost shale of the Gurpi Formation.
The Cretaceous-Paleocene sediments are however widely distributed throughout the Dezful Embayment, Zagros region but identification of the boundary of the Gurpi Formation (Cretaceous) sometimes are exposed to problems with the Pabdeh Formation (Paleocene) and so litho-stratigraphically it’s called Gurpi-Pabdeh Formation [1,12]. This issue has also been observed gradually from the Pabdeh to Asmari Limestone area. In this paper, new data inferred by a chemo-stratigraphy method for the Cretaceous-Paleocene and Eocene- Oligocene of the Pabdeh boundaries has been interpreted.
In Zagros area there are many obscurities regarding the K-T border which means the border between Gorpi and Pabdeh formations. As far as these two formations are concerned, in this article we try to with regard to the geochemical differences provide dissociation through time since working is impossible through stratigraphy.
The Pabdeh Formation outcrop in this area consists of the upper Paleocene to Oligocene sediments (Figure 1) to a thickness of 140 meters which is observed as alternative shades of purple shale; marble and shale; limestone and layers of gray to black shale containing organic matter. The carbonate pelagic facies in the Pabdeh Formation are mudstone, wax stone, pack stone and shale [1,3]. The lower border of Pabdeh Formation (K-T) has been determined in this location by pelagic fossil “meta–minifies” and alluvium logy. The borders here are jagged and commence in the form of conglomeritic rock with the Gurpi Formation pieces being connected to each other via a mold of shale and marl (Figure 2). This border is erosion type with same inclination. This cross section is near Ablish village in the northern part of Behbahan city. Geographical specifications of the area studied are 50° 15′ east, 3035′ north.

Figure 1: Geographical and geological position of the area studied, Bangestan anticline.
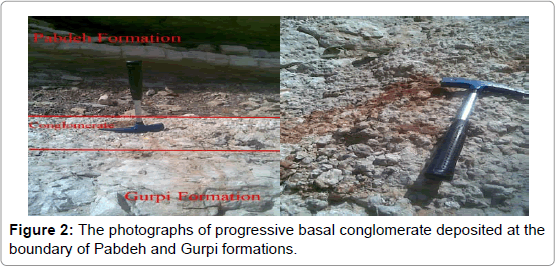
Figure 2: The photographs of progressive basal conglomerate deposited at the boundary of Pabdeh and Gurpi formations.
In this research, a standard field sampling of the step formation was conducted and also vertical to the layers continuation. Of these, 76 samples were collected from the sample cuts and 70 of them belonged to the Pabdeh Formation while 3 samples to Gurpi and 3 belonged to Asmari. For geochemical studies, 12 samples were collected from places where they were mainly composed of shale and were relatively well distributed along the formation. After powdering the samples, they were transferred to the laboratory for analyzing with RXF, model PHILIPS 1480. The results were obtained with the use of Excel software elements and oxides and the changes were intensely plotted and compared to the stratigraphy column. It should be noted that the XRF instrument has the accuracy of ± 0.01% for oxides and 1 (ppm) for trace elements. The amount of less than 1ppm will be mentioned as digit 1 for information. High amount of L.O.I is because of the carbonates.
To study the statistics analysis and to obtain the mathematical relationship between geochemical parameters of selected samples given in Table 1, SPSS16 and Excel soft ware’s been used and different parameters such as p, r, and R2 were calculated. Apart from many different tests which were conducted on the statistical analysis, one of the criteria for accurate determination obtained from the practical relation is proximity of the correlation coefficient, R2, to 1. This case shows the percentages covering proposed model. The quantity r, called the linear correlation coefficient, measures the strength and the direction of a linear relationship between two variables. The linear correlation coefficient is sometimes referred to as the Pearson product moment correlation coefficient in honor of its developer Karl Pearson. The P value is a probability (a measure of how much evidence we have against the null hypothesis), with a value ranging from zero to one. In actually R2 is a statistic that will give some information about the goodness of fit of a model. In regression, the R2 coefficient of determination is a statistical measure of how well the regression line approximates the real data points. An R2 of 1.0 indicates that the regression line perfectly fits the data.
| Sample Oxides and Elements | Gu1 | Pb2 | Pb6 | Pb8 | Pb17 | Pb33 | Pb38 | Pb49 | Pb54 | Pb63 | Pb66 | AS |
| 0.0 m | 1.2 | 2.4 | 4 | 36.2 | 67.1 | 91.6 | 114.6 | 122.8 | 132.3 | 140 | 150.8 m | |
| SiO2 (%) | 9.01 | 22.67 | 11.49 | 9.94 | 8.41 | 8.05 | 7.30 | 6.94 | 6.20 | 24.92 | 3.16 | 3.10 |
| Al2O3 | 1.78 | 4.65 | 2.36 | 1.70 | 1.54 | 1.32 | 1.32 | 1.41 | 1.40 | 5.92 | 0.06 | 0.27 |
| Fe2O3 | 1.19 | 2.36 | 1.87 | 1.43 | 1.38 | 1.31 | 1.16 | 1.24 | 1.29 | 3.18 | 0.44 | 0.39 |
| CaO | 47.42 | 35.31 | 45.03 | 46.39 | 46.61 | 47.03 | 48.53 | 48.47 | 49.02 | 33.57 | 52.15 | 52.78 |
| Na2O | 0.09 | 0.13 | 0.08 | 0.06 | 0.08 | 0.08 | 0.08 | 0.06 | 0.05 | 0.06 | 0.08 | 0.06 |
| K2O | 0.56 | 1.32 | 0.67 | 0.51 | 0.48 | 0.28 | 0.24 | 0.31 | 0.48 | 1.82 | 0.29 | 0.31 |
| MgO | 0.55 | 1.37 | 1.00 | 1.11 | 1.08 | 0.92 | 0.78 | 0.73 | 0.66 | 1.54 | 0.76 | 0.66 |
| TiO2 | 0.120 | 0.308 | 0.140 | 0.115 | 0.113 | 0.105 | 0.054 | 0.061 | 0.078 | 0.430 | 0.033 | 0.042 |
| MnO | 0.007 | 0.008 | 0.013 | 0.030 | 0.022 | 0.027 | 0.016 | 0.008 | 0.003 | 0.004 | 0.013 | 0.013 |
| P2O5 | 0.212 | 1.405 | 0.353 | 0.372 | 0.362 | 0.684 | 0.757 | 0.731 | 0.665 | 0.074 | 0.120 | 0.117 |
| SO3 | 0.318 | 0.575 | 0.050 | 0.033 | 0.030 | 0.031 | 0.030 | 0.020 | 0.015 | 0.043 | 0.025 | 0.024 |
| L.O.I | 38.43 | 28.45 | 36.64 | 38.07 | 38.093 | 39.11 | 39.44 | 39.15 | 39.75 | 28.06 | 42.13 | 35.41 |
| Trace Element (ppm) | ||||||||||||
| Cl | 84 | 111 | 105 | 84 | 91 | 88 | 93 | 95 | 99 | 126 | 186 | 191 |
| Ba | 8 | 56 | 3 | 3 | 7 | 18 | 26 | 5 | 2 | 100 | 7 | 5 |
| Sr | 855 | 767 | 422 | 387 | 413 | 522 | 691 | 674 | 683 | 591 | 618 | 722 |
| Cu | 80 | 56 | 33 | 56 | 46 | 51 | 44 | 51 | 54 | 31 | 111 | 86 |
| Zn | 87 | 69 | 27 | 28 | 32 | 27 | 34 | 38 | 27 | 40 | 45 | 44 |
| Pb | 9 | 22 | 11 | 10 | 10 | 10 | 8 | 8 | 7 | 14 | 6 | 5 |
| Ni | 95 | 137 | 60 | 48 | 51 | 48 | 50 | 48 | 38 | 47 | 28 | 27 |
| Cr | 4 | 83 | 13 | 23 | 25 | 21 | 28 | 5 | 2 | 27 | 7 | 2 |
| V | 17 | 38 | 17 | 9 | 11 | 21 | 28 | 31 | 22 | 49 | 12 | 12 |
| Ce | 40 | 79 | 30 | 13 | 13 | 21 | 19 | 24 | 36 | 6 | 18 | 12 |
| La | 23 | 42 | 16 | 6 | 6 | 6 | 8 | 8 | 18 | 3 | 8 | 8 |
| W | 1 | 1 | 1 | 1 | 1 | 1 | 1 | 1 | 1 | 1 | 1 | 1 |
| Mo | 1 | 3 | 9 | 2 | 8 | 5 | 4 | 22 | 34 | 16 | 14 | 16 |
| Nb | 2 | 8 | 12 | 6 | 7 | 4 | 5 | 2 | 2 | 7 | 2 | 4 |
| Ga | 7 | 10 | 9 | 7 | 7 | 6 | 6 | 8 | 6 | 10 | 6 | 6 |
| Zr | 105 | 147 | 60 | 57 | 63 | 54 | 83 | 83 | 86 | 161 | 72 | 78 |
| Y | 7 | 95 | 11 | 12 | 11 | 5 | 3 | 3 | 5 | 18 | 1 | 3 |
| Rb | 21 | 40 | 24 | 24 | 22 | 19 | 16 | 18 | 18 | 42 | 14 | 15 |
| Co | 3 | 1 | 2 | 4 | 4 | 4 | 2 | 5 | 5 | 1 | 5 | 4 |
| As | 1 | 29 | 4 | 2 | 6 | 3 | 1 | 5 | 33 | 7 | 37 | 28 |
| U | 1 | 1 | 1 | 1 | 1 | 1 | 1 | 1 | 1 | 1 | 1 | 1 |
| Th | 4 | 5 | 5 | 7 | 5 | 6 | 2 | 7 | 8 | 6 | 3 | 6 |
| Chemical Indicators | ||||||||||||
| V/Cr | 4.25 | 0.04 | 1.3 | 0.4 | 0.44 | 1 | 1 | 6.2 | 11 | 1.8 | 1.7 | 6 |
| Ni/Co | 31.7 | 137 | 30 | 12 | 12.75 | 12 | 25 | 9.6 | 7.6 | 47 | 5.6 | 6.75 |
| V/V+Ni | 0.15 | 0.21 | 0.22 | 0.16 | 0.18 | 0.31 | 0.36 | 0.39 | 0.37 | 0.51 | 0.3 | 0.3 |
| CIA% | 3.57 | 11.2 | 4.9 | 3.5 | 3.16 | 2.7 | 2.7 | 2.8 | 2.7 | 14.3 | 0.11 | 0.5 |
| Mn/Ti | 0.07 | 0.03 | 0.12 | 0.34 | 0.25 | 0.33 | 0.38 | 0.17 | 0.05 | 0.01 | 0.5 | 0.4 |
| Sr/Ba | 107 | 13.7 | 141 | 129 | 59 | 29 | 27 | 135 | 342 | 6 | 88.3 | 144.4 |
| Zn/Cu | 1.08 | 1.2 | 0.8 | 0.5 | 0.7 | 0.5 | 0.8 | 0.7 | 0.5 | 1.3 | 0.4 | 0.5 |
| Ca/Mg | 86.2 | 25.8 | 45 | 41.8 | 43.1 | 51.1 | 62.2 | 66.4 | 74.3 | 21.8 | 68.6 | 80 |
| Mn | 54 | 61 | 100.7 | 132.4 | 175.1 | 209 | 123.9 | 62 | 23.2 | 31 | 100.7 | 100.7 |
| Ti | 720 | 1848 | 840 | 690 | 678 | 630 | 324 | 366 | 468 | 2580 | 198 | 252 |
| Fe | 8330 | 16520 | 13090 | 10010 | 9660 | 9170 | 8120 | 8680 | 9030 | 22260 | 3080 | 2730 |
Table 1: Geochemical analysis data of selected samples based on stratigraphy column in the Bangestan anticline.
Changes in the mineral compositions of a formation can be noticed and which are dependent on parameters and different processes such as sedimentation rate, deposition environment and paleo-climatic conditions, litho logy and digenetic effects. Study of each of these processes can be useful and effective for the explanation of carbonate and clay mineral compositions and their changes in the formation.
The element Ca, Mg, Fe, Mn, Sr and Na in the carbonates rock are essential to understand carbonate mineralogy, salinity, environmental setting, substitution of elements and temperatures (Rao, 1996). The proposed major elemental geochemical parameters [13], such as Fe2O3 + MgO%, TiO2%, (Al2O3/SiO2), (K2O/Na2O) and Al2O3/ (CaO + Na2O) are used to discriminate the plate tectonic setting of sedimentary basins. The ratio K2O/Na2O is a measure of the potassium feldspar and mica versus plagioclase feldspar content in the rock, and Al2O3/ (CaO + Na2O) parameter is a ratio of the most immobile to the most mobile element. Roser and Korsch used the ratio of K2O/Na2O and SiOv2 content of published data from ancient sedimentary suites to define passive margin (PM), active continental margin (ACM) and oceanic island arc (ARC) settings.
The elements La, Ce, Mo, Y, Th, Zr, Pb, Ba, V, Ga, As, Zn, Cu, Rb and Cr are most suited for provenance, salinity, and temperature setting determinations because of their relatively low mobility during sedimentary processes and their low residence time in sea water. These elements are transported quantitatively into clastic sedimentary rocks during weathering and transportation, reflecting the signature of the parent materials[14].
Many researchers [15,16] believe that the Pabdeh Formation is formed of very fine grain carbonate and detrital sediments. To attain the operation method of the processes; this is possible only through geochemical studies of sediments. Study of trace elements, especially in the rocks without fossils or other environmental indicators could be used to determine the salinity, temperature, depth and also other paleoenvironmental traits. From the elements point of view chemical farcies can be applied as an index for genesis and digenesis of sediments.
Many researchers have used the major and accessory elements, oxides and dissociation diagrams, to study tectonic environments and also petrology. Bhatia [13] used the oxides ratio and their relation to separate these environments. According to Figures 3a and 3b, a marine environment with tectonic activity and Figures 4a and 4b have been considered as limestone to calcareous shale for the Pabdeh Formation.
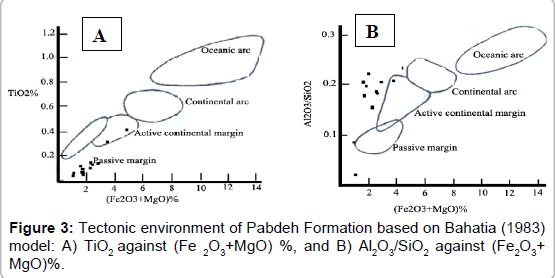
Figure 3: Tectonic environment of Pabdeh Formation based on Bahatia (1983) model: A) TiO2 against (Fe 2O3+MgO) %, and B) Al2O3/SiO2 against (Fe2O3+ MgO)%.
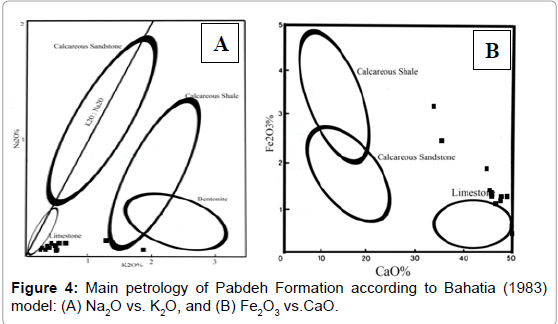
Figure 4: Main petrology of Pabdeh Formation according to Bahatia (1983) model: (A) Na2O vs. K2O, and (B) Fe2O3 vs.CaO.
Even though the sedimentary environment in Pabdeh formation is an active margin environment, but because of low Fe, Mn and Ti, does not show any suitability with this graph. Based on the litho logical changes within the thickness of Pabdeh Formation from the base to the top, the environment has been inferred to be shallower. This depth reduction can be due to global cooling of water and weather or the effects of orogenic phases following the Cretaceous event [5-7,17-20]. In this project, we decided to analyze the effects of chemical changes (oxides and elements) in this hypothesis. Because of vicious changes in the sedimentary environment, these two samples will stay far from the other samples. This difference is because of inconformity of Litho logy with the graph data, since graph is for the [13] carbonates but the samples under consideration are Marl.
A criteria indicator of hot weather is evaporation of sediments and abundance of carbonate rocks [21], and with regard to the ratio of Mg/ Ca which increases with the increase in salinity and also considering the preferential replacement of Mg and Sr. instead of Ca in the carbonate sediments along with increase in the temperature, they can be used as indicators to previous temperature [22]. By referring to Table 1, it appears that Ca/Mg ratio varies from 25.8 to 74.3. At this range it was observed that from the base, this factor increased to the top but just before the upper limit where the Pabdeh abruptly declined towards the Asmari where it inclined again. This trend can be related to orogenic phases and therefore changes in depositional conditions.
Ratio of Mg/Ca show a salinity parameter which according to the degree of salinity of the area can be investigated and also controlling process of Dolomitization of the area. Considering its lowness, Dolomitization has not taken place. Sr value changed from 767 to 387 ppm that is comparable to high value of Gurpi (855ppm) and Asmari (722ppm). Changing trend in Sr presents a descending – rising – decreasing pattern from the lower part to the upper part of Pabdeh Formation, respectively. This matter is also exhibited by P2O5 since it increased and then decreased. Reduction in the amount of P2O5 towards the top is one of parameters indicating deep reduction of area (Figure 6). However the changes in the amount of MnO and Fe2O3 in pb63 sample show the oxidization condition for a short span of time.
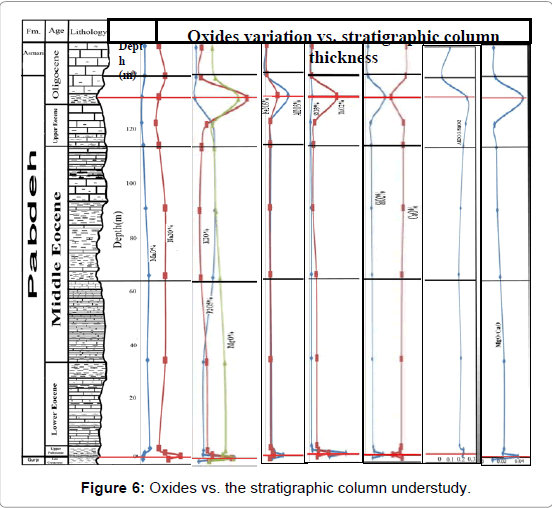
Figure 6: Oxides vs. the stratigraphic column understudy.
Change of Mn, Fe and V in all the samples according to the [23] model belong to group 3 (Mn<800, Fe<37500, V<320) domain which shows regenerated environment (without sulfate with Eh) and the condition of pH is medium to low. In some samples there is some nonconsistency in elements distribution and environmental conditions because of mineralogy which are sensitive to the concerned elements.
Ni/Co has been used as an indicator of oxygen levels has V/ Cr. Hatch and Leventhal ascribed V/(V + Ni) ratios to depositional environment. Both Ni and V occur in highly Stable tetrapyrrole structures preferentially preserved under anaerobic conditions. Lewan suggested that in crude oils these elements remain unchanged because of the strong bonds with high molecular weight organics. V also may occur absorbed onto clay minerals. Cr seems to be associated only with the detrital faction is not influenced by redox conditions, and thus high V/Cr values (>2) are thought to indicate anoxic conditions. High Ni/ Co ratios are thought to be associated with anoxic conditions.
In the present study, based on paleoredox indicators [24] a good agreement is not noticed in the interpretations of redox conditions (Figure 6) using thresholds established by Jones and Manning for Ni/ Co and V/Cr (Figure 5a). However, V/(V + Ni) ratios predict lower oxygen conditions than either Ni/ Co or V/Cr for all samples. In fact, for most of the Pabdeh samples, V/(V + Ni) predicted dioxic conditions, whereas Ni/Co (Figure 5b) and V/Cr predicted oxic to dysoxic. There seems to be a coupling of Mo with Ni/Co suggesting similar controls on accumulation (Figure 5c). Figure 6c shows the Pabdeh samples have Mo contents < 200 ppm, plot within dysoxic to suboxic/anoxic ranges. In V/cr and Ni/co some of the samples in oxide part which is because of the lowness of ratio of V/cr and may be this substance not being absorbed by the organic substances and this by itself shows non presence or less presence of organic substances, but the Mo/Ni graph is because No is non mobile substance and there for shows the ratio better. In the whole these samples are because of the sensitivity of the substances to the environmental conditions. This is different to those indicated by other indicators. Ranges for V/Cr and Ni/Co are for V/(V + Ni). However, the present data in this paper does show a less variability between units that would be consistent with deposition under paleoenvironmental conditions. Thus, it may be reasonable to use these ratios and ranges in a relative sense and should be applied cautiously due to differences between basins of different geologic age and geographic settings.
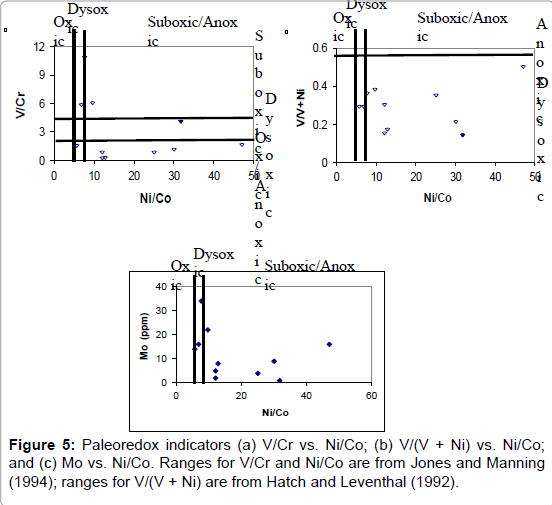
Figure 5: Paleoredox indicators (a) V/Cr vs. Ni/Co; (b) V/(V + Ni) vs. Ni/Co; and (c) Mo vs. Ni/Co. Ranges for V/Cr and Ni/Co are from Jones and Manning (1994); ranges for V/(V + Ni) are from Hatch and Leventhal (1992).
The Chemical Index of Alteration (CIA) which is innovated by [Al2O3/(Al2O3+Cao+Na2O+K2)O] × 100 gives an indication of the degree of weathering in the source region [25-27]. It will be 70–75 for average shale’s [26]. High values (i.e., 76–100) indicate intensive chemical weathering in the source areas whereas low values (i.e., 50 or less) indicate unweathered source areas. Akaegbobi et al. [27] suggested that CIA value of more than 90 indicates weathering under humid conditions but <90 indicates moderately weathered source rock. The samples of this area present low CIA % and vary from 11.2 to 0.11 at the base to the top respectively, and it is therefore inferred that the source has undergone less weathering in a hot, dry climatic condition. However, it seems the weathering alteration rate was constant during Upper Pabdeh deposition and changed for a period then recurred again. Mn/Ti ratio can be seen as a indication of the distance from land, increasing with the distance to land [28,29]. The present result of this ratio indicates that the lower part of Pabdeh is progressively going farther and farther apart and the distance of the land was coming down. This union applies to the effects of orogenic phases that appeared as shallow basins in the two boundaries of the Pabdeh Formation. Sr/Ba ratio in freshwater and salt water can be distinguished; in salt water, the ratio is >1 but in fresh water sediments is <1. In the selected samples which were analyzed (Table 1) the Sr/Ba ratios are relatively high in content (107) in Gurpi, low content (13.7) in the lower boundary of Pabdeh, but during Pabdeh deposition it shows a fluctuation as decreasing in lower part, increasing in upper part and the upper boundary as well.
Zn and Cu among the heavy metals traces can be used by the evaluation of these metals concentration-ratio variability as a evidence of the contamination source [30-32] besides the metal record preservation without significant changes in time. This evaluation is also based on the assumption that the source presents a unique and consistent ratio of metals. Zn/Cu ratios in the samples understudy exhibit a range of 0.5 to 1.2 without any significant enrichment. The samples also show different degrees of trace-elements enrichment, with the approx. order of enrichment being Ni>Zn>Cu>V>Pb>Cr>Co>Mo in Gurpi; Ni>Cr>Zn>Cu>V>Pb>Mo>Co in the lower boundary of Pabdeh; Ni>Cu>Zn>Cr>V>Pb>Mo>Co in middle part of Pabdeh; Cu>Zn>Ni>Mo>V>Pb>Mo>Co in the upper part of Pabdeh and lower part of Asmari formations. Differing degrees of enrichment and order may reflect differences in depositional environment during accumulation. High Mo concentrations in the Pabdeh (generally 2-14ppm) may infer dysoxic-sub-anoxic conditions prevailing during sediment accumulation. Gurpi and Asmari formations show lower (1ppm) and higher Mo (16ppm) contents, relatively.
By comparing oxides frequencies (Table 1), the reduction in the amount of SiO2, Al2O3, MgO, Fe2O3, (K2O+Na2O) and increase in the amount of CaO from the base towards the top of Pabdeh is the sign for reduction of the depth an environment towards the top of Pabdeh (Figures 6,7 and 8). These changes in the stratum column are wobbly and sometimes even intangible.
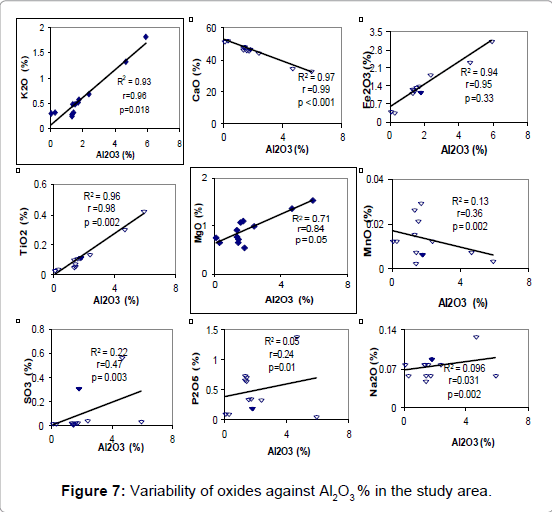
Figure 7: Variability of oxides against Al2O3 % in the study area.
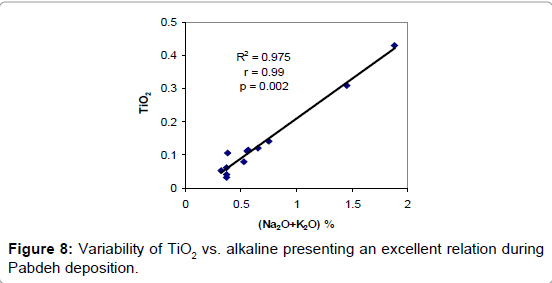
Figure 8: Variability of TiO2 vs. alkaline presenting an excellent relation during Pabdeh deposition.
The ratio of MgO/CaO decreases with the decrease in the age towards the top (Table 1). Since the water temperature determines the carbonate mineralogy and therefore one of the controlling elements for main and incidental elements, therefore with reduction in the ratio, mineralogy changes from HMC to aragonite. With regard to this point it is revealed that aragonite of the environment has a high temperature (30°C), thereby along with this increase in the temperature and decrease in the depth causes increase in saltiness and it can be mentioned that environmental saltiness towards the top of Pabdeh partly increases. Alkaline elements show increase in the saltiness along with decrease in the age of formation. Presence of very thin layers of Gypsum and Anhydrite vapors which look like very thin layers of shale and support these changes. This reduction in depth can be related to the Alpine orogenic belt reproduction phase which had taken place at that time. The sudden increase in the percentage of shale and clay minerals in the upper section of Pabdeh formation is possibly related to this phase. Hovaizavi [33] believed that this mountain reproduction in inclined mid Dezful Embayment is accompanied by increase in the destruction which can be observed on entrance to the area as a form of lime and shale containing silt and sand. All oxides against Al2O3 (%) were plotted. Based on these plots, SiO2, Fe2O3, TiO2, MgO, and SO3 exhibited a positive trend and passed statistic tests except CaO which showed a negative pattern due to deposition of calcareous sediments. Among these TiO2 indicates a good bond with alkaline (Figure 8) and it can be referred to as a paleo-salinity indicator. P2O5 and Na2O in spite of their positive trends and passing statistic test present a low value of R2.
Changes in the trace elements (ppm) do not follow a uniform trend through the formation (Figures 9,10). In the area of study, changes in the amount of Mn, Cl, Ga, Y, Ba, Ce, Ni, show its increase with the decrease of the age (except for pb63). Unusual increases of these elements in this sample show the sedimentation in this organization (Pabdeh-Asmari-boundary).
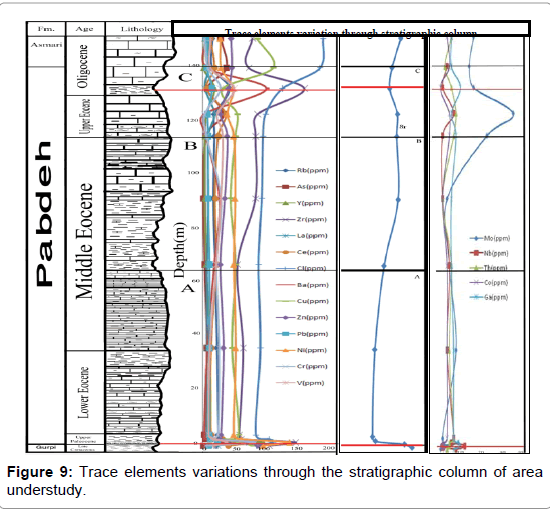
Figure 9: Trace elements variations through the stratigraphic column of area understudy.
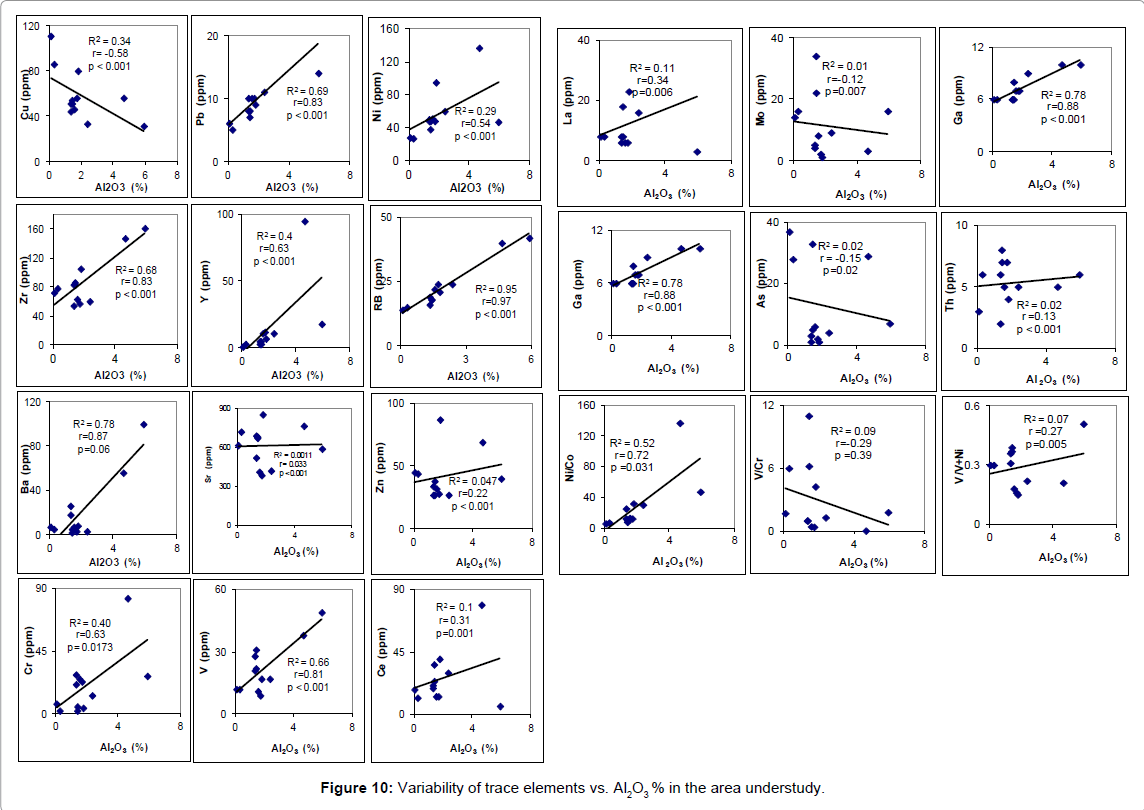
Figure 10: Variability of trace elements vs. Al2O3 % in the area understudy.
Considering the amount of elements and changes in the saltiness which have taken place in the vertical sequence from the base to the peak, show changes from sweet to little salty and from very deep to low depths (Figures 6-10). Change in Sr value through this column from the bottom to the top of the Pabdeh (Figure 9) shows increase in the concentration of this element with reduction in the ratio of Mg/ Ca which is due to increase in the temperature due to the shallowness effect of the area of sediment area. This depth reduction could cause aragonite carbonic compositions. Of course the amount of “Sr” present in the limy formation has direct relation with the amount of clay since clay minerals have properties of absorption of Sr changes in the amount of SO3 verifies the mentioned method, since its amount increases upwards (specially in the pb63 sample) (Figure 5). Presence of thin layers of evaporate sediments is a reason in this instance.
Considering Figure 10 reveals that most of the trace elements indicate a correlation with Al2O3 ratio with reasonable statistic parameters except Ni, Zn, Sr, Ce, Cr, La, Mo, As and Th. The chemical variation of these trace elements, and Ni/Co, V/Cr, and V/V+Ni to Al2O3 (Figure 10) do not present a good correlation coefficient (R2) when they passed statistics tests (r and p) except V/Cr ratio. Ni/Co and V/V+Ni ratios indicate positive trends while V/Cr shows a negative trend. Therefore V/Cr and V/V+Ni ratios have different geochemical behavior and fail to show any relation to Al2O3 ratio.
As noted earlier and based on field work, the lower boundary is located on pebble conglomerates with detrital bitumen, presents the post Cretaceous nonconformity. The upper correlation to the Asmari limestone is conformable and transition is easily seen. Based on elemental study, key and outline of the Pabdeh Formation can be divided into 3 sections, lower (A), middle (B) and upper (C). According to Figures 6-10 of course these boundaries do not coincide with all elements and oxides due to the effects of several factors such as petrologic specification and depositional conditions. Accordingly for (A) which is a deep environment can be considered wherein it reduces from the beginning of the formation towards the upper part of the environment. In the middle part (B) the condition of the area a little more stable than (A). But still the environment has its regenerative condition. The presence of middle layers of dark shale which contain minerals proves this. Section (C), or Upper Pabdeh - the environment becomes less deeper than the other two sections. But it is still relatively deep.
Alternative layers of marl and limestone were discussed in detail by Elricka [34] and Westphal [35]. They mentioned that this is a characteristic of the equatorial and semi equatorial weather conditions and suggested an area similar to aragonite sedimentation in the shallow and warm seas. Of course in the area under study; due to the high values of MgO and Sr, it seems that the top of the formation is characterized by an intermediate to shallow marine.
Keeping in mind, the studied microscopic complex specifications got from the area and analysis of geochemical changes in the stratigraphy column of the Pabdeh Formation, it is logical to infer that a group of organic matter has been transferred to the basin and the source may be located far from the depositional basin because of relatively less Mn.
In this project, measurement of the amount of elements (ppm) and oxides (%) in shale lime samples, limy shale and mid layer shale and the drawing of diagrams of frequency of these elements against stratification series of Pabdeh Formation show the samples in relation to the upper section of the formation; here severe frequencies can be seen in the curve which when compared to the lower and upper samples are much clearer and can be referred to as the boundary between Pabdeh and Asmari formations. The boundary between Pabdeh and Asmari was not transitional, and has been considered as a definite boundary.
Geochemical data shows the shallowness of the Pabdeh sedimentation area as a vertical column. This formation is the evidence of the changes in the sea water levels which coincide with the global changes of water levels which in turn show the shallowness of the area along the sedimentation deposition of the Pabdeh Formation. The sedimentation of this formation is seen as a development of mountains which would gradually increase and move upwards towards the peak of the Pabdeh Formation, as the amount of carbonate materials and evaporate must grow from the base towards the peak of Pabdeh. The existence of Asmari carbonate Formation on the upper part is the thin anhydrite layers and also the presence of debris silt and sand grain size proving the above hypothesis.
We would like to express our sincere thanks to the department of basic Science, Science and Research branch, Islamic Azad University, Tehran and all our colleagues for their critical discussions and support. We also express special thanks to the Authorities of Shahid Chamran University research department. Thanks also to the anonymous referees for all their gracious and critical points.