Journal of Medical Diagnostic Methods
Open Access
ISSN: 2168-9784
ISSN: 2168-9784
Research Article - (2025)Volume 14, Issue 2
Statistically, about seven hundred thousand patients suffer brain tumor disease every year around the world causing the condition unstable and even, dangerous to live with. The condition happens when the brain cells that have undergone mutation or exposure to a radiation source can no longer control their growth relatively. Herein, we introduce CAD-BT, an intelligently automated detection and classification system that is dedicated to determine the severity of brain tumors. The system capitalizes on the MobileNet architecture with a subnet-enhanced version along with residual blocks to increase performance. The CAD-BT preprocessing is done by means of an approach which consists of MSR-enhanced, CLAHE-enhanced, histogram equalization, Gaussian blur and mixed-enhanced techniques that help to optimize tumor visibility, suppress surrounding noisy brain tissue and enhance overall brain tumor examining classification accuracy. To deal with the under-representation of the bottom layer classes, data augmentation methods are used in order to improve generalization on the model. Additionally, the grouping of residual blocks in the MobileNet architecture outperforms the classification task for 4 brain tumor severity levels. In regard to CAD-BT, the outcome is a top-notch quality with a simplified model range and fewer manipulations to carry out. This research evaluates the performance of the CAD-BT system through mixed datasets of various kinds. This is done through the use of a pre-trained model to the purpose of extraction of the semantically important aspect of brain tumor images. The final step involves categorizing the images into one of four classes: Glioma, meningioma, lack of tumor and pituitary. This categorization is brought out by the fact that an SVM classifier layer with linear activation function is included. Astonishingly it achieves a 99.5% accuracy and confirms on a difficult brain tumor dataset which we used to validate the algorithm. Moreover, in this research, five models, namely, InceptionV3, Efficient-Net, VGG19 and Xception, achieve accuracies of 88%, 85%, 87% and 82%, respectively. The analyses and comparison of the results brought forth the effectiveness of the CAD-BT tool in increasing model performance and learning. Therefore, with that said, the CAD-BT system allows neurologists to have a helping tool that provides an appropriate frame for classifying brain tumors of different types in their early stage.
Brain Tumor (BT); Feature extraction/classification; MobileNet model; Deep Learning (DL); Image processing
Brain Tumors (BT) are among the most frightful illness, as they paralyze the life of the individuals in the most unfavorable ways. BT results in severe neurological symptoms such headaches, seizures, memory loss, difficulties concentrating and speaking, altered reflexes or numbness in certain body parts, changes in the capacity to grasp language and even personality abnormalities. In the US, one of the leading causes of death is BT. Rendering to the national cancer institute, brain and additional nervous classification tumors accounted for 1.4% of all cancer deaths in 2018, making it the 12th leading cause of death that year. Based on the aggressiveness of the tumor and its propensity to spread, BT are divided into four groups [1]. Benign (non-cancerous), low-grade (less dangerous), high-grade (more serious) and metastatic BT. According to each kind corresponds to a certain stage in the development of cancer. Benign tumor typically does not spread, develop slowly and may be surgically removed without causing long-term harm; lowgrade malignant tumor must often be treated with radiation or surgery despite their tendency to develop slowly and have less ability to spread; high-grade malignant tumor is more aggressive because they develop more quickly and are more likely to metastasize. Finally, metastatic brain cancers that have scatter into other areas of the body might be challenging to treat radiotherapy and chemotherapy are combined to treat brain cancers so they can be used separately or together depending on the size and spot of the BT. While radiation destroys cancer cells by beaming high-energy x-rays, gamma rays or electrons onto the tumor chemotherapy uses medications to inhibit the proliferation of cancer cells. Both treatments have potential adverse effects, including a higher risk of infection, exhaustion, hair loss and nausea. Several procedures, such as imaging tests and neurologic evaluations, can be used to discover whether a BT is existing [2].
CT scans, PET scan or MRI are some of the tomographic methods that are used. Doctors can determine whether the tumor is primary or a metastatic by making a diagnosis from the results of these examinations. In contrast, DL tools can be used for the automation of BT detection and classification. DL models are more accurate and cost-effective than the traditional methods of detecting BTs. This ability allows it to find small tumors earlier in their development that may be undetected by manual inspection or imaging techniques. Furthermore, they are quicker than the traditional methods thus they can quickly analyze huge amounts of data. Therefore, DL becomes an efficient way of defining and categorizing them. Besides the advanced image processing tools and methods make it possible to find tumors in images with a high preciseness. Lastly, DL can help by being able to learn from labeled data. These methods have proven to enhance speed and accuracy in comparison to standard techniques in both BT detection and classification tasks [3].
This article presents an innovative DL model technique for classification of BTs is proposed. In this model a modified mobile net architecture for an efficient deep-learning model, which adds the residual blocks for the in-depth training of the model is used. The proposed approach gets evaluated on different datasets to prove its superior performance. the system achieves 100% accuracy on the publicly available dataset (SARTAJ) the other tested dataset is PAK-BT which a private dataset collected specially for this research. Figure 1 demonstrates the visual representation of the disease imaginings.

Figure 1: Visual representation of brain disease images.
Research motivation
Although there are several techniques for classification BTrelated MRI images have been established, there are still some substantial challenges:
Because of this, the main goal of the research aims to progress a multilayered DL model for fully automated processing of BTMRI images, especially in the case of BT-related tumor illness. In this study, a CAD-BT system that incorporates residual blocks is built using a multilayered mobile net system. A fully trained CAD-BT system is capable of accurately identifying BT on a variety of BT-related BT-MRI images that contain anatomical elements. Certain BT-related disorders and anatomical characteristics have been recognized by an expert neurologist [4].
Research contribution
To get over the issues mentioned above, this work combines DL archtectures with several layers and image processing techniques to categorize MRI brain pictures into tumor, glioma, meningioma, no tumor and pituitary. Here, we highlight the significant achievements of the CAD-BT system:
An autonomous approach for characteristic between malignant and non-malignant brains MRI scans is presented in the study. Potential lesions are divided using a variety of techniques employing a feature set created from shape, texture and strength. With a Support Vector Machine (SVM) classifier applying several cross-validations on the feature sets against three standard datasets harvard, rider and local the system’s accuracy is evaluated. The system achieved an average accuracy of 97.1%, an Area Under the Curve (AUC) of 0.98, 91.9% sensitivity and 98.0% specificity. This technology could locate cancers faster and with greater accuracy than current ones however our proposed system achieves higher accuracies on our privately collected dataset. In order to precisely detect lesion symptoms, Saba employed the grab cut method and transfer learning with the Visual Geometry Group (VGG-19) is altered to collect features combined with hand-crafted (shape and texture) characteristics in the serialised manner. The integrated vector is distributed among classifiers and the entropy of these attributes is optimized for precise and quick sorting. Medical Image Computing and Computer-Assisted Intervention (MICCAI) datasets, such as multimodal BT segmentation (BRATS) 2015, 2016 and 2017, are used to test the model. The results reveal a score of 0.99 in BRATS 2015, 1.00 in BRATS 2016 and 0.99 in BRATS 2017. In this research the brain surface extraction approach is used to first separate the brain. Particle swarm optimization is used to enhance the segmentation of the image with the skull removed. Following the extraction of comprehensive characteristics and Local Binary Patterns (LBP) from the segmented images, a genetic algorithm is utilized to choose the top features. The classification of tumor grade is performed last using Artificial Neural Networks (ANNs) and other classifiers. The anticipated technique attains a maximum accuracy rate of 99% when tested on complicated brain datasets like the rider and BRATS challenge. This showed how effective it was in comparison to other ways, demonstrating its value and originality. in BRATS 2015, 1.00 in BRATS 2016 and 0.99 in BRATS 2017. Amin proposed an architecture that can accurately segment benign and malignant tumors. The input photos are refined and correctly segmented using a variety of spatial domain approaches. Additionally, following the Softmax layer, two score vectors are generated using the Alex and Google networks for categorization. Along with the Softmax layer, these two vectors are concatenated and sent into numerous classifiers. The Medical Image Computing and Computer-Assisted Intervention (MICCAI) challenge dataset, which comprises of multimodal BT segmentation (BRATS) 2013-2016 and Ischemic Stroke Lesion Segmentation (ISLES) 2018, is used to evaluate the effectiveness of the anticipated approach. In research presented in the creative picture slices were sharpened and noise was removed using a Weiner filter with different wavelet bands. Groups of tumor pixels are discovered using potential field cluster. Additionally, Fluid Attenuated Inversion Recovery (FLAIR) and T2 MRI scans are used to highlight the tumor locations using global thresholding and unique mathematical morphological approaches. To ensure accurate classification, features from the local binary pattern and Gabor wavelet transform are combined. A technique for extracting and recognising malignancies from MRI data was created by Khan in. This method uses feature selection and watershed segmentation based on markers. It consists of the following five steps: Improving the tumor’s contrast, tumor extraction, obtaining form, texture and point characteristics, choosing highly ranked features using the chi-square max conditional priority procedure and classifying those features using a support vector machine. The BRATS 2013 dataset from Harvard and private MRI picture sets were used in experiments, which demonstrated increased precision and accuracy when compared to earlier techniques. An approach for differentiating between benign and malignant tumor was provided in this work. It combines algorithms for lesion improvement, feature extraction, choice and classification. During the lesion enhancement stage, the N4ITK3 technique normalises the input picture. A serial fusion-based method for feature extraction and fusion is used to merge HOG (shape), SFTA and LBP based features. Then, for feature vector selection, the Boltzmann entropy method is used. Three BRATS datasets that are accessible to the general public are utilised to gauge performance. The model is trained independently on benchmark datasets and for tumor estimate it obtains a mean Dice Similarity Coefficient (DSC) of 0.99. Evidence suggests that, when compared to other methodologies, the suggested model successfully distinguishes between aberrant and normal brain areas. An unsupervised clustering method for tumor segmentation was put out in this article. The proposed method proved its superiority with remarkable detection performance. This is performed by merging Gabor Wavelet Feature vectors (GWF), Oriented Gradient Histograms (HOG), Local Binary Patterns (LBP) and Segmentation-based Fractal Texture Analysis (SFTA) features. Furthermore, a Random Forest (RF) classifier is employed to differentiate between three sub-tumoral locations: Entire, enhancing and non-enhancing tumors. To avoid overfitting, 0.5 holdout validation and fivefold cross-validation are also employed [5].
This paper introduces a novel framework termed CAD-BT, which combines CNN with residual blocks to address the categorization of brain illness images. The CAD-BT framework is specifically designed for the classification of images depicting glioma, meningioma, no tumor and pituitary. Within this framework, the residual blocks technique is integrated to effectively extract significant attributes from the images. Transfer learning is employed on the residual blocks to train the system specifically for brain-related defects. CAD-BT incorporates essential mechanisms for the detection of brain disease imaginings and identification of the aforementioned health issues. The framework's systematic stages are presented in Figure 2. Throughout the training process, parameters of the residual blocks are continuously refined to improve performance.

Figure 2: BT categorization methodology.
As well as that, the transform layer feature is suggested to connect the parts by merging them with component-wise multiplication. To achieve more reliable classification results, LSVM activation function has been used. An enhanced pretrained mobile net with residual blocks engineering signifies a big step of progress in two of the most important parts among computer vision and DL. The innovative approach that is being adopted at present uses the advantage of the neural network that is made up of mobile net and res net in order to create the hybrid model that will be expected to outperform the previously known models. Mobile net's potential in extracting features and res net's ability in building a solid training scheme and adaptation makes this model a candidate for universal applications. This model stands out through providing an opportunity for the formation of elaborate machines that perform in highly accurate domains or areas upon instructions.
The tailoring of fitting tasks to precise requirements is priceless when standard models cannot meet perfect results. An excellent feature of this prototype consists in its appropriate validation of initial experience. Across a wide range of inclusive studies which focusses on both large-scale databases and real-world scenarios, no other method beats it. Research in deep learning and computer vision has been particularly convincing over the last years due to this overwhelming amount of empirical evidence. Besides, the feature can be label with high source credibility, thereby prompting it to execute appropriately in limited spaces where computing and memory constraints are serious such as mobile devices. Not only the model is being used to improve the efficiency, but it also performs well regarding interpretability, an aspect that is critical in cases of self-driving and healthcare. It describes the reasoning used, including residual blocks, which is an essential feature to confidence and security-critical applications. The integration of "pre-trained mobile net model and residual blocks" brings, sound scientific improvement. This approach has gained popularity in many vision problems where its ability to blend strengths of both mobile net and res net algorithm effectively is considered to be a big plus.
What is noteworthy is that it provides excellent interpretability, resource usage efficiency and proven results from real-world applications. This technique has enormous prospects in the development of computer vision concerns, both in quality and performance. The phrase "original mobile net model" can also be interpreted as the initial model's fundamental structure at the time of its publication. Hence, this structure commonly utilizes a blend of mixed-depth wise convolution operations, squeezeand- excitation block elements as well as many other meticulously developed feature extraction mechanisms at the same time. The model gets training from scratch to be able to attain specific objectives using the relevant data sets as a practice dataset. The presence of residual blocks into the network architecture of the upgraded pre-trained mobile net model shows that adaptations or expansions of the original version of the mobile net has already been applied or integrated. Residual connections, which is another term for skip links, is one adaptation that could be considered cross layers. This was one of the design concepts that res net architecture had been popularized and this has shown outstanding performance in the deep neural networks area. By the use of residual blocks the network was stimulated, it arranged components from the architecture of mobile net and res net in one system. This integration of architectures can be, in fact, used as a support for the model to flourish by the strengths of both mobile net and res net, speeding up feature extraction by mobile net and augmenting the relying of res net on the training process. This implies that standard mobile net was subject to revamping, that is, introducing shortcut connections thus giving it an edge over the usual mobile net architecture. Firstly, the moment residual units into the mobile net architecture holds high importance. This addition not only will strengthen the training stability, but it will also help to quickly acquire new knowledge and facilitate its further interpretation. It's worth mentioning that the implementation and design decisions applied to merge mobile net and res net components can impact the characteristics of the "mobile net model with residual blocks". Besides, carrying out extensive experiments on your datasets and tasks seems to be necessary to practically test the superiority of this enhanced model [6].
Data acquisition and preprocessing
The CAD-BT model was trained and assessed with the help of the dataset, PAK-BT, consisting of about 4,600 photos. These imaginings were sourced privately from reputable brain conveniences in Pakistan, with permissions obtained from both patients and physicians to utilize the data. Stakeholders agreed to supply data anonymously, with no sharing of clinical information, ensuring patient confidentiality while enabling study access. The dataset was compiled from PAK-BT and wellknown online sources, predominantly consisting of BT images depicting various brain conditions, including glioma, meningioma, no tumor and pituitary images. Normal and unhealthy brain photos were manually curated by a trained neurologist to develop the training dataset, ensuring accuracy and standardization. In enhancing the interpretability of deep neural networks, the MSR enhanced, CLAHE enhanced, histogram equalization, gaussian blur and mixed enhanced preprocessing approach shows a vital role. It enables the generation of interpretable heat maps highlighting key areas within an image, aiding in object localization and understanding model predictions. MSR enhanced, clahe enhanced, histogram equalization, gaussian blur and mixed enhanced simplicity, effectiveness in localization, generation of comprehensible illustrations and widespread adoption within the DL community make it a preferred choice for explaining model decisions. While the report does not delve deeply into MSR enhanced, CLAHE enhanced, histogram equalization, gaussian blur and mixed enhanced application rationale, its selection corresponds with the fields of study and the demand for comprehensible insights into the model's decision-making process. The incorporation of MSR enhanced, CLAHE enhanced, histogram equalization, gaussian blur and mixed enhanced underscores ongoing endeavors to enhance the transparency and reliability of DL models, thereby increasing their accessibility and trustworthiness across various applications, as depicted in Figure 3.

Figure 3: Illustrates the outcomes of that preprocessing techniques.
Figure 1 displays meticulously inspected brain photographs totaling 9,600 images. The construction of training and testing fundus sets involved three distinct datasets, each with specific dimension settings detailed in Table 1. All images underwent resizing to 700 × 600 pixels and subsequent processing to establish binary labels. Of the complete dataset, comprising 9,600 photos, 4,500 were designated for system evaluation. To ensure impartiality, the dataset underwent class balancing, equating the number of photos across various health conditions. Prior to input into the CAD-BT model algorithm, images were pre-processed by resizing to 700 × 600 pixels and standardization to minimize data point variance. The PAK-BT dataset was utilized for both training and evaluating the CAD-BT system, with each image originally saved at a resolution of 1125 × 1264 pixels [7].
| Name | Glioma | Meningioma | No-tumor | Pituitary | Image sizes |
| Pak-BT | 1150 | 1150 | 1150 | 1150 | 700 × 600 |
| SARTAJ | 100 | 115 | 115 | 74 | 700 × 600 |
Table 1: Dataset for the CAD-BT framework consisting of brain diseases.
Data from three distinct sources were utilized and the photographs were resized to a standard dimension of 700 × 600 pixels to streamline and normalize the dataset. Additionally, qualified pulmonologists presented to generating both brain disease and non-brain disease data during the dataset construction process for accurate ground truth evaluation. The MSR enhanced, CLAHE enhanced, histogram equalization, Gaussian blur and mixed enhanced technique was employed for image pre-processing to enhance image clarity and remove interference, as illustrated in Figure 3. By applying MSR enhanced, CLAHE enhanced, histogram equalization, Gaussian blur and mixed enhanced to the MRI images, we were able to identify key areas and assess their importance in detecting brain diseases. This technique facilitated the identification of distinct characteristics that significantly influenced the predictions of CNN for the MRI-based diagnosis of BT images.
Data augmentation
Table of the SARTAJ dataset demonstrates that the dataset is inconsistent. Consequently, the model may be biased in favor of one class when training. Data augmentation is a way of artificially expanding increase the amount of data by generating additional data points from already existing ones. It contributes to improving and stabilizing the model's performance. Helps to avoid the issues of overfitting. Figure 4 illustrates the augmentation steps.

Figure 4: Augmentation steps for BT images.
In augmentation, crop, contrast, vertical and horizontal flip, pan and emboss enhance images. Cropping removes undesired elements of an image, retaining just the required sections. Contrast adjusts the brightness levels in the image, whilst vertical and horizontal flips change the orientation of the image and its axes. Panning is a technique for zooming in and out of an area of focus, whereas embossing adds depth and texture to an image by moving pixels up and down. The parameters are displayed in Table 2 and Figures 5,6.
| Approaches | Values |
| Width shift range | 0.3 |
| Rotate range | 15 |
| Zoom range | 0.3 |
| Contrast | True |
| Crop | True |
| Vertical-flip | True |
| Horizonal-flip | True |
| Pan | True |
| Spin-range | 0.2 |
| Emboss | True |
Table 2: Table present the data augmentation technique.

Figure 5: Modified MobileNet architecture for BT classification.

Figure 6: This diagram showing how residual block is used to produce the CAD-BT model.
In this model, we added the average pooling 2D layer, flatten layer residual and residual 1 layer after the pointwise 13 convolution layer to improve feature outcomes. This model's features are utilized and then after model assessment, SVM classifier is used on this.
LSVM
The linear Support Vector Machine (SVM) is utilized for brain disease classification with a 75% to 25% train-test split. We opt for linear SVM due to its efficacy with small datasets and highdimensional performance. SVM, known for its superior classification, is commonly used in real-world scenarios. Instead of traditional classifiers, a depth-wise separable Convolutional Neural Network (CNN) is developed for computer vision or image classification challenges. We choose linear SVM for its ability to manage the small datasets while performing well in high-dimensional contexts, pertinent for our binary classification tasks. Moreover, linear SVM aids in enhancing our approach's effectiveness and determining the optimal hyperplane for segregating ill and normal cells in retinal images [8].
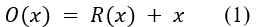
In Equation (1), a linear SVM accepts a feature vector (Z=Z1, Z2, ……. Zn) and yields a decision function value y expressed as:
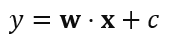
Where w signifies the weight vector, c represents the bias term. Both w w and c are learned during training. The feature vector x is assigned to class 1 or class -1 based on whether y is greater or less than 0, respectively.
The CAD-BT algorithm was trained using a database comprising 4600 MRI image data. All 4600 MRI images were resized to (700 × 600) pixels for feature extraction and classification operations. The CAD-BT system was constructed using mobile net and residual blocks. Training the CAD-BT model spanned 80 epochs, with the best model achieving an f1-score of 0.99 in the 15th epoch. Development of the CAD-BT system took place on a computer featuring an HP-i7 CPU with 8 cores, 16 GB of RAM and a 2 GB NVIDIA GPU. The system runs on windows 11 Professional 64-bit.
Experiment 1
The experiment is being carried out using the SARTAJ dataset, an available online dataset containing a total of 394 images. Among these, 100 images represent glioma, 115 represent meningioma, 105 represent no-tumor and 74 represent pituitary, as shown in Table 3. The pictures in this dataset have dimensions of 512 × 512 pixels. We conduct both training and testing of our model on the SARTAJ dataset and report the experimental results. These results are summarized in Table 3 and Figure 7. Notably, our proposed model achieves 100% accuracy on this dataset.
| Input | Array X |
| Output | Response map z = (z1, z2 . . . , zn) |
| Step 1 | Data standardization |
| Step 2 | Method specification |
| Step 3 | Convolutional parameters and filter set Z as inputs for batch normalization |
| Z=Conv (Z) and | |
| Z=BN (Z) then applied | |
| Step 4 | Utilization of depth wise Conv2D |
| Step 5 | Network configuration |
| The network is initiated with 14 conv layers, featuring an ascending order of filters ranging from 32 to 102. Post each conv layer, a ReLU activation is applied | |
| The architecture then proceeds t integrate skip connections by applying the add function | |
| The design includes three separate instances of skip connections, each situated post max pooling and preceding two depth wise convolutional layers, with stride settings of two and a ratio of conversion maintained at 1:1 | |
| Step 6 | The feature map |
| z=(z1, z2,., zn) was formed and then flattened using a flattening layer |
Table 3: CAD-BT model implementation for feature map extraction.

Figure 7: Utilizing graphical analysis to evaluate the accuracy and loss of the CAD-BT model across training and validation of SARTAJ dataset.
Experiment 2
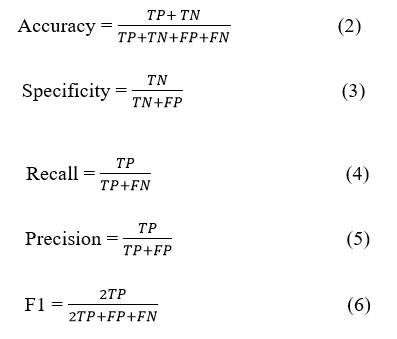
In this experiment, we conducted equivalent analysis of our model with other DL models, namely InceptionV3, EfficientNet, VGG19 and Xception, utilizing the same dataset Pak-BT. Table 4 shows the results of this comparison, highlighting the performance of the CAD-BT system against the Area Under the Curve (AUC), sensitivity, specificity and accuracy of these models. Numerous performance metrics were utilized to evaluate the models, including the confusion matrix, accuracy, precision, recall, specificity and F1 score. The confusion matrix provides a comprehensive understanding of values such as true positives, false positives, true negatives and false negatives. Statistical analysis equations (1, 2, 3, 4, 5) were utilized to calculate Accuracy (ACC), Specificity (SP), recall, precision and F1 score values, enabling the assessment of the CAD-BT system's performance. These analytical metrics were instrumental in evaluating the performance of the proposed CAD-BT system and comparing it with previously developed systems.

Figure 8: Confusion Matrix of Sartaj Dataset.
In the test dataset, the initials TP, TN, FP and FN, respectively, stand for true positive, true negative, false positive and false negative data. The results of the present study, comparing the proposed CAD-BT model with other DL-based models using the same dataset, are presented in Table 1. Figure 8 illustrates the validation and training accuracy, along with the reduction in training and validation accuracy, for the additional four DL models.
Equation
| Models | Accuracy | Sensitivity | Specificity | Error rate | AUC |
| CAD-BT | 0.99 | 0.9892 | 0.99 | 0.005 | 0.99 |
| InceptionV3-model | 0.88 | 0.87 | 0.86 | 0.12 | 0.89 |
| Efficient-model | 0.85 | 0.85 | 0.83 | 0.14 | 0.87 |
| VGG19-model | 0.87 | 0.85 | 0.86 | 0.13 | 0.89 |
| Xception-model | 0.82 | 0.82 | 0.83 | 0.18 | 0.84 |
Table 4: Modern comparative analysis compares the CAD-BT system to other DL-based BT systems using 4600 pictures.
Experiment 3
In this experimentation, we used a novel dataset acquired from hospitals in Pakistan to assess the efficiency of our proposed CAD-BT system. Initially, we compared the model's performance utilizing data from both sets on the training and validation sets, as well as the loss function. Figure 7 depicts the dataset's confusion matrix as calculated using the CAD-BT model. Figures 8 and 9 show the effectiveness of our model in both training and validation scenarios, as well as the area under the curve. Using the Pak-BT dataset, we achieved a fantastic accuracy of 0.99, a f1-score of 0.99 and an AUC of 0.99 in both the training and validation sets (Figures 10-12).

Figure 9: Visual representation of different model results.

Figure 10: Utilizing graphical analysis to evaluate the accuracy and loss of the CAD-BT model across training and validation of PAK-BT Dataset.

Figure 11: This figure presents the confusion matrix of PAKBT dataset.

Figure 12: Displays the AUC of the presented CAD-BT system on a selected dataset.
Experiment 4
In this experiment, we assessed the effectiveness of our proposed CAD-BT system using the BRATS 21 dataset. Initially, we conducted a comparison of the model's evaluation on both the training and validation sets, analyzing the loss function using data from mutually sets. The confusion matrix of the dataset using the CAD-BT model is presented in Figure 7. Additionally, Figures 8 and 9 showcase the effectiveness of our model across both training and validation scenarios, including the area under the curve. Remarkably, leveraging the BRATS 21 dataset, we attained an outstanding accuracy of 0.99, an f1-score of 0.99 and an AUC of 0.99 on both the training and validation sets [9].

Figure 13: Utilizing graphical analysis to evaluate the accuracy and loss of the CAD-BT model across training and validation of BRATS 21 datasets.

Figure 14: Confusion matrix of BraST21 dataset.
DL techniques have developed as influential tool in the realm of medical imaging, offering numerous advantages for the detection and classification of BTs. These approaches aid in the specific identification of various type of cancers and their differentiation from healthy tissue that subsequently leads to the avoidance of false positives and negatives. This asset is of crucial importance for early-stage diagnosis and efficient treatment planning. On the other hand, DL algorithms facilitate the fast analysis and processing of large medical images, a labor-intensive task if performed manually. This not only saves time but also enhances the comprehensiveness and thoroughness of analysis of patient information to improve the precision of diagnosis and prescription of treatment. Furthermore, the flexibility and adaptability of DL is one of its major strengths. These algorithms can actively incorporate new data sources and have the capability to deal with the variability in the data, thereby making them highly dynamic and adaptable in the real-world health care scenarios. As a result, patients treated with BT obtain personalized diagnoses, individualized therapy plan and continued monitoring of the disease progression and therapy effectiveness. Speaking further, future research in this field is directed towards the design of advanced segmentation and classification models using 3D medical images. Through the use of machine learning techniques for feature extraction, these models can additionally provide an improvement in the precision and dependability of tumor detection and categorization. Besides, automating the diagnostic aspect of the process will lead to smooth operation of processes and increase efficiency in healthcare settings. Great innovations in quantum computers entail the evolution of DL algorithms that can detect cancerous growths with a very high accuracy which was impossible before. These algorithms will become the key element of differentiations between healthy and malignant cells, as well as discovery of the disease earlier and development of more effective treatment methods.
Concurrently, researchers are starting to implement alternative cost-effective options, for instance, low-cost ultrasonography, which combined with the DL approaches can enable accurate and accessible diagnostic modalities especially in resourceconstraint areas. By introducing the alternative technologies that brings the cost of imaging modalities down, they could quite immaculately support for a democratization of the high-quality health care. The ability of DL technology to transform healthcare in a way that is so imminent, specifically for BT (television) diagnosis and treatment, is hard to refute. Advancements in technology and innovations are certain to give people using it more precision in diagnostic tests, earlier disease detection, better treatment and most importantly, a better prognosis [10].
Identifying and classification of BTs is the core of the research in medical imaging. The objective of this study is more accurate identification and classification of BTs for earlier diagnosis and treatment. The recent progress in the field of Convolutional Neural Network (CNN) has made the automatic detection and segmentation of BT from the MRI data achievable. Also, the CNN-based methods have managed to classify different varieties of BTs into separate categories. Despite the newest astounding technological breakthroughs, there are still gaps that must be filled. These conditions can still be improved to achieve higher precision and effectiveness. With DL methods, both BT detection and classification are carried out. This feature enables it to differentiate between tumor and normal regions and allows the separation of tumors into different classes which is of great value for medical applications. A novel computerized BT system, CAD-BT, has been created by using DL models. This system uses the mobile net architecture, residual network blocks and image processing for the enhancement of tumor classification precision. Remarkably it is revealed that the model is more effective using residual blocks, even though one would anticipate that an acceleration and compression of a dynamic system would not necessarily lead to a higher classification accuracy. Our improved mobile net model produced results even better than the initial forecast, ensuring accurate predictions and therefore, a valuable resource for further studies. The system under study employs DL architecture that is characterized by higher efficiency as compared to state-of-the-art DL architectures. The model can be continuously updated for increased accuracy and robustness with additional training or by using optimization techniques.
Muhammad Zaheer Sajid: Conceptualization, investigation, methodology, writing original draft.
Ayman Youssef and Muhammad Imran Sharif: Conceptualization, supervision, writing review and editing.
Ayesha Butt, Muneeba Daud: Methodology, supervision, writing review and editing.
Muhammad Fareed Hamid: Conceptualization, supervision, writing review and editing.
The datasets generated and/or analyzed during the current study are available from the corresponding author upon reasonable request.
No funding was received to assist with the preparation of this manuscript.
The authors have no conflicts of interest to declare.
No ethics approval is required for this study.
All authors read and approved the final manuscript.
[Crossref] [Google Scholar] [PubMed]
[Crossref] [Google Scholar] [PubMed]
[Crossref] [Google Scholar] [PubMed]
[Crossref] [Google Scholar] [PubMed]
[Crossref] [Google Scholar] [PubMed]
[Crossref] [Google Scholar] [PubMed]
[Crossref] [Google Scholar] [PubMed]
[Crossref] [Google Scholar] [PubMed]
Citation: Sajid MZ, Sharif MI, Youssef A, Butt A, Daud M, Hamid MF (2025) CAD-BT: A Computer Aided Diagnostic System Based on Optimized MobileNet for Detection and Classification of Brain Tumor. J Med Diagn Meth. 13:519.
Received: 10-May-2024, Manuscript No. jmdm-24-31315; Editor assigned: 15-May-2024, Pre QC No. jmdm-24-31315 (PQ); Reviewed: 29-May-2024, QC No. jmdm-24-31315; Revised: 14-Apr-2025, Manuscript No. jmdm-24-31315 (R); Published: 21-Apr-2025 , DOI: 10.35248/2168-9784.25.14.519
Copyright: © 2025 Sajid MZ, et al. This is an open-access article distributed under the terms of the Creative Commons Attribution License, which permits unrestricted use, distribution and reproduction in any medium, provided the original author and source are credited.