Journal of Geology & Geophysics
Open Access
ISSN: 2381-8719
ISSN: 2381-8719
Research Article - (2014) Volume 3, Issue 5
Arabian Sea is in general biologically most productive region in the North Indian Ocean, in particular eastern Arabian Sea. However, there is a lack of pre-existing studies performed to reveal the seasonal and interannual variability of the primary production. The potential role of atmospheric and oceanographic events on promoting the distinct development of phytoplankton in the northern and southern parts of eastern Arabian Sea regions was investigated in this article. In order to study the temporal variability of the bio-physical parameters, we used 12 years (1998-2009) of Sea WiFS chlorophyll-a data and 10 years (2000-2009) of QuickSCAT wind stress data (zonal and meridional) as two important forcing parameters. Relative impacts of the Indian Ocean Dipole (IOD), associated with the global climatic event of El Niño Southern Oscillation (ENSO) on biophysical parameters of eastern Arabian Sea during the study period have been analyzed at the two regions. Seasonal and interannual variabilities are clearly observed in both chlorophyll-a and wind stress time series. The overall seasonal variation for chlorophyll-a were 0.17 and 2.29 mg m-3 with a standard deviation of 0.03 and 0.54 mg m-3 for the northern and southern regions, respectively, and the coefficient of variation was 8-65%. The relationship between chlorophyll-a and multivariate ENSO index was negative at northern and southern regions in all seasons, and the IOD also showed negative relation except pre monsoon sea.
Keywords: Atmospheric, Eastern, Arabian, Teleconnections
Ocean is one of the main resources for the human and other species living on our planet Earth. Ocean biology is important not only for ocean fish production, but also for impact on biogeochemical cycling, including controlling ocean surface CO2 by the flux of carbon from the surface to the deep ocean. The Arabian Sea is one of the most biologically active regions in the world. It is approximately triangular basin with largest zonal extent of about 3000 km and a slightly smaller meridional extent. Its proximity to the equator makes the radius of deformation to be about 100 km. In Arabian Sea it is expected that the interaction between the open-sea and the coastal regime is important to the dynamics of the Sea. The west coast of India forms a eastern boundary of Arabian Sea. The Arabian Sea is one of the most intriguing areas of the world because of the strong seasonal variation in seasurface hydrography. As one might expect, that is because the monsoon system greatly influences this area. The monsoonal wind system in summer and winter over the Arabian Sea drives spectacular seasonal variations, for example the annual reversal of the surface circulation. The Arabian Sea experiences extremes in atmospheric forcing which leads one of the largest intra-annual variability compared to the other ocean basins of the world. The semi-annual reversals in atmospheric and ocean circulation, the inflow of warm high saline waters from the Persian Gulf and the Red Sea, and the zone of oxygen deficient waters (~150-1000 m) make the Arabian Sea a unique tropical basin.
Satellites have been used for several decades to observe bio-physical processes in the upper layer of the oceans. Usually it concentrates on the measurements of ocean temperature, ocean color, and computation of ocean water transport based on satellite-measured wind stress [1]. Satellite data provide the ability to systematically analyze Chl-a variability over the Arabian Sea by using Coastal Zone Color Scanner data [2-4] in the beginning and more recently using the significantly improved systematic global coverage of SeaWiFS data. The timing of peak productivity, however, differs from region to region within the northwestern Indian Ocean [5]. Several studies on the phytoplankton seasonality and its provincial nature over the Arabian sea using multi satellite observation from 1978 to present [6-8] reveals that the northern Arabian Sea is more productive during winter season and the western and eastern parts of the Arabian Sea is more productive during summer season because of strong vertical mixing triggered by the coastal and open ocean upwelling. The chl-a concentration over the Arabian Sea has a good relation with the Eurasian snow cover [9]. Based on the unique combination of sea-surface temperature, sea-surface Chl-a and maximum bottom depth obtained from field measurements, the Arabian Sea was divided into six provinces [10]. This classification scheme combined with the use of satellite data to allow the real-time identification of dynamic boundaries of biogeochemical provinces.
The surface chlorophyll-a concentration over the Arabian Sea is generally low during inter-monsoon periods (March-May and October- December) with values in the range of 0.03 to 0.05 mg m-3, while during the NE and SW monsoons the chlorophyll-a concentrations go up to 1.34 mgm-3 in the eastern Arabian Sea and up to 11mg m-3 in the western Arabian Sea [11]. Large blooms are common in late winter located in the north of about 20°N. Average chlorophyll concentrations for the north of about 20° N were significantly higher than those between about 10° and 15°N where both prior to and during the months of seasonally elevated pigment levels. Vertical mixing in the interior of the Arabian Sea, increased by atmospheric processes such as lowering of sea surface temperature (SST) or wind effects other than evaporation will enhance nutrient supply to the mixed layer and thus algal growth rates and concentrations. In fact, the previously known average hydrographic features at least qualitatively explain the differences in pigment patterns and levels between the southern and northern areas. The study of inter- annual variability of surface chl-a assumes significance as the biomass exerts considerable influence on upper layer thermodynamics [12-15] and biogeochemical dynamics. Naqvi et al. [16] shows the increase in biological productivity of the Arabian Sea over the last few years by the satellite data for the period 1997–2003. Sarma et al. the semiannually reversing winds and associated changes in the upper layer circulation control the Chl-a variability in the Arabian Sea and its marginal seas [17].
El Niño is also known as a cause of interannual climate fluctuations over the Pacific Ocean, which in turn causes variability in biological production and ecosystem dynamics. One consequence of the 1997- 1998 El Niño appears to be a reduction in Chl-a off the southwest coast of India in 1998. An increased frequency of El Niño events may lead to a reduction in offshore carbon in this dynamic upwelling region [18]. The Indian Ocean Dipole (IOD) is one of the dominant modes of the interannual variability of the Indian Ocean SST [19]. During the Indian Ocean Dipole (IOD) events, SW monsoon winds are weaker along the Sumatra coast whereas stronger in the Arabian Sea and Bay of Bengal during summer [20]. Therefore, the IOD events are a key to understand the physical and biogeochemical processes with special reference to phytoplankton primary production and air–sea fluxes of carbon dioxide in the Arabian Sea. During IOD event Chl-a is decreased to 0.5 mg m-3 with an increase of 1.8°C for SST from that of normal period and also the reduced vertical mixing might lead to deepening of thermocline and nutricline in the Arabian Sea. As a result, supply of nutrients to the photic zone was reduced during IOD period leading to decrease in primary production by about 30% compared to that in normal period [21].
Upwelling observed in the open ocean which was normally induced by wind stress curl, falls under this category. The best known example of Open Ocean upwelling system is located along the central Arabian Sea associated with Findlater Jet during summer monsoon. The wind maximum around l7°N and 64°E indicates the axis of the Findlater jet. The shoaling and deepening of isotherms on either sides of the axis are the signatures of the upwelling and down welling associated with the jet. The mixed layer depth and SST in the central AS are, to a large extend, regulated by these wind forcing and incoming solar radiation. Kahru et al. [22] examined large‐scale correlation patterns between winds and surface Chl-a concentrations. These patterns provide a consistent view of the main controlling factors of phytoplankton growth (nutrients or light). For most of the global ocean high positive correlations occur in regions where the ocean mixed layer is comparatively shallow and increased winds are readily able to deepen the mixed layer and entrain additional nutrients into the upper ocean. Strong negative correlations tend to occur in regions where late winter mixed layers are deep and the increased winds are likely to deepen the mixed layer enough to push phytoplankton out of the sunlit euphotic zone at the top of the ocean.
The west coast of India (WCI) forms the eastern boundary of the Arabian Sea basin. The coast lies along almost a straight line at an angle of about 24° with the north. Off the coast the bottom topography consists of a continental shelf which is about 60 km wide and a continental slope where the water depth increases from 200 m to 2000 m, followed by a region of uniform depth of approximately 2000 m [23].
The southwesterly wind begin to dominate the coastal wind field in late spring and persists through the summer, which leads to a seasonally intense offshore Ekman transport and a coastal upwelling which are common to the southern part of the Eastern Arabian Sea. Chl-a along the WCI during southwest monsoon varies from 0.5 to 9 mg m-3. The winter bloom appears from early October to last week of January,
but it does not have a clear temporal transition. The area where chl-a concentration exceeds 5 mg m-3 is wider in northern area than in the southern area of the WCI every year [24].
The main objective of this study is to investigate the seasonal and inter-annual bio-physical changes in the eastern Arabian Sea especially at the southern and northern parts. Figure 1 shows the location of the study area, which is a high productive region, off the Mumbai (R1) and Malabar (R2) Coast in the eastern Arabian Sea that supports extensive fishing grounds. The powerful Findlater Jet split at 9°N into two branches, one branch passes through R1 region and the other one passes through R2 region.
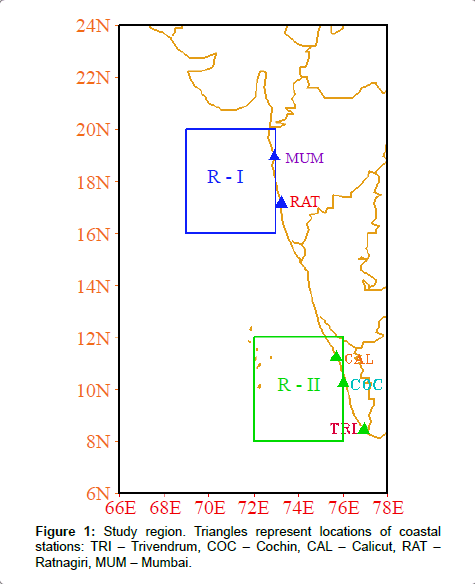
Figure 1: Study region. Triangles represent locations of coastal stations: TRI – Trivendrum, COC – Cochin, CAL – Calicut, RAT – Ratnagiri, MUM – Mumbai.
Sea surface Chl-a
Remote sensing data of Sea-viewing Wide Field-of-view Sensor (SeaWiFS) was used to study the temporal variations of Chl-a concentration at two regions along the west coast of India during 1998 – 2009. The data is available from the Ocean Biology Processing Group (OBPG) at NASA’s Goddard Space Flight Center (GSFC). In the present study, monthly averaged Level 3 standard mapped product was used.
Sea surface wind
Sea surface wind data from scanning microwave radar, using the backscattered signal from the roughness of sea surface, provides the 10 m wind field with an accuracy of about 1 m in speed and about 20° in direction [25]. The data sets provided by QuikSCAT are currently available in different formats and exist from 19 July 1999 to the present on a 0.25° x 0.25° global grid with a 6-hour temporal resolution. In the present study we used 2000-2009 monthly wind fields.
Multivariate ENSO Index (MEI)
Here we attempt to monitor ENSO by the Multivariate ENSO Index (MEI) on the six main observed variables over the tropical Pacific. These six variables are sea-level pressure (P), zonal (U) and meridional (V) components of the surface wind, sea surface temperature (S), surface air temperature (A) and total cloudiness fraction of the sky (C). These observations have been collected and published in COADS for many years. The MEI is computed separately for each of twelve sliding bimonthly seasons (Dec/Jan, Jan/Feb,..., Nov/Dec) [26]. Negative values of the MEI represent the cold ENSO phase, La Niña, while positive MEI values represent the warm ENSO phase (El Niño).
Indian Ocean Dipole
Dipole Mode Index (DMI) was used as the indicators for IOD. DMI is the difference of the area-averaged SST anomaly between the regions 50°E-70°E, 10°S-10°N in western Indian Ocean and 90°E-110°E, 10°S-Equator in eastern Indian Ocean. The satellite derived SST with 4 km resolution has been used for calculating DMI and is derived from Advanced Very High Resolution Radiometer (AVHRR) of the National Oceanic and Atmospheric Administration (NOAA).
Seasonal Variability
Spatially averaged Chl-a, zonal and meridional wind stress and wind stress curl showed a strong seasonal cycle dominated by summer peak at R1 (1.4 mg m-3) and R2 (1.62 mg m-3) regions (Figure 2). Second peak is observed at R1 (1.02 mg m-3) region from January to March (Figure 2a-2d). The Chl-a varies from 0.2 mg m-3 to 1.78 mg m-3 at the seasonal variation of Chl-a is strongly correlated with the zonal and meridional wind stress at two regions. The exception is the R2 region where the zonal wind stress is well correlated. It means that the zonal wind stress plays a dominant role on upwelling process at R2 region. One month lag in positive curl is observed at R2 region, but there is no lag at R1 region. Strong positive curl (Figure 2d) is ensues strong upwelling at R2 brings high nutrient water from the sub surface to surface. Not only wind speed but also air-sea interaction plays a vital role at R1 region of the Chl-a enhancement.
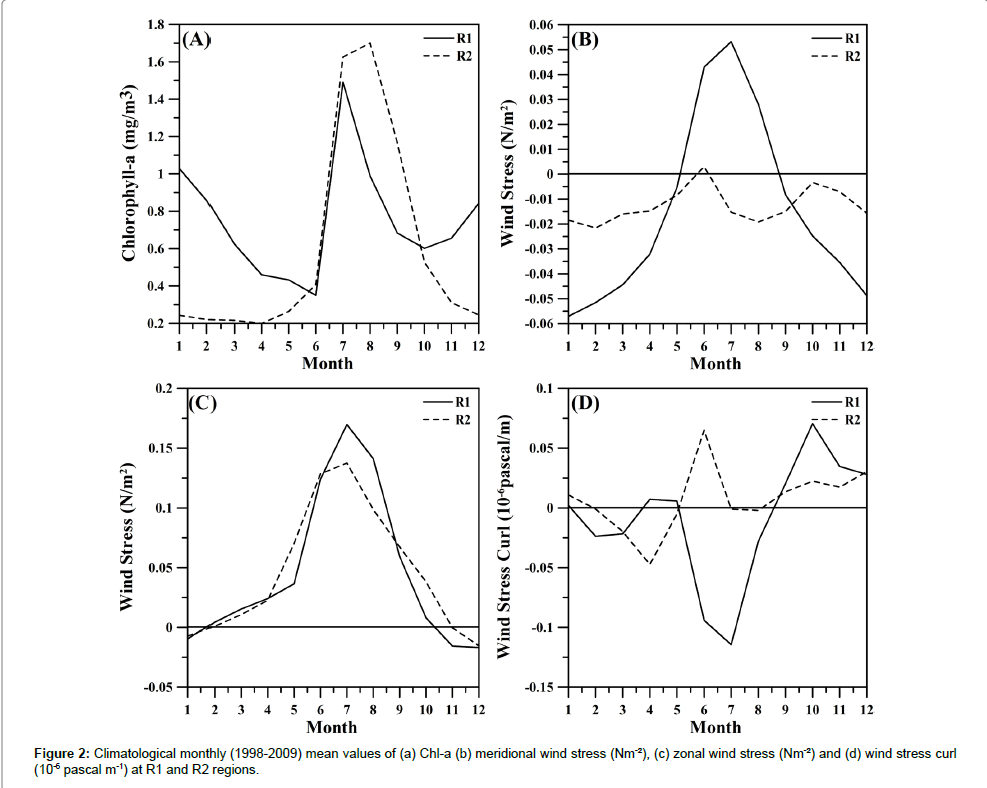
Figure 2: Climatological monthly (1998-2009) mean values of (a) Chl-a (b) meridional wind stress (Nm-²), (c) zonal wind stress (Nm-²) and (d) wind stress curl (10-6 pascal m-1) at R1 and R2 regions.
Figure 3 shows the intra-seasonal variation in Chl-a over the R1 and R2 regions. The overall seasonal minimum (0.42 mg m-3) Chl-a is observed during 2004 in the pre-monsoon season and the maximum (2.29 mgm-3) is in summer monsoon season of 1998 which is also an strong El Nino year at R1 region. Whereas R2 is also shows seasonal peak (1.77 mgm-3) during the summer monsoon season of 1998, but the low value (0.17 mgm-3) is during pre-monsoon season of 2002. The Chl-a variations are higher during summer monsoon season at R2 region compared with R1 except 1998 and 2009 years. During the winter of pre-monsoon and northeast monsoon seasons the difference in Chl-a between R1 and R2 is positive which means R1 region is more productive during the above seasons. During winter season (Figure 3a- 3d), the magnitude of the Chl-a at R2 was lower compared with R1 and the difference was about 0.52 mg m-3, but the pattern was the same and there was a decreasing trend at R1 (r = -0.56, p<0.01). During the northeast monsoon season (Figure 3d), a cyclic and same pattern is observed in the chl-a concentration at both regions, and the difference between two regions is very small. The wind stress is lower compared with southwest monsoon season (Figure 4a-4d). One more important feature is that the concentration is higher at R1 when compared with southwest monsoon season. This is mainly due to the upwelling process along the coast.
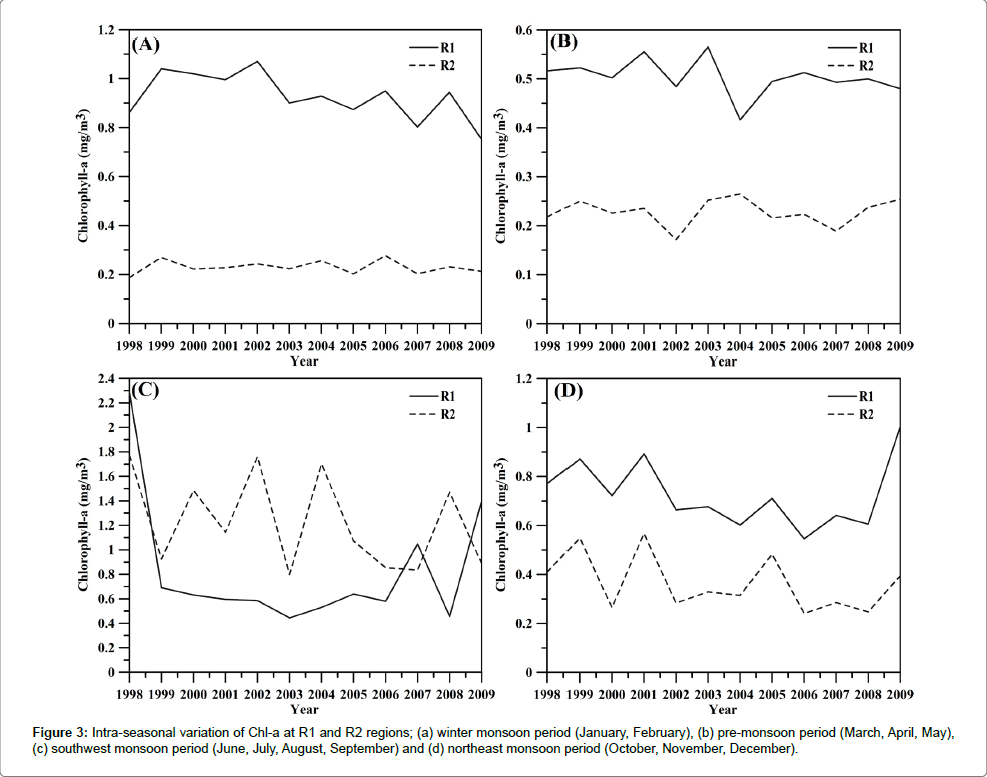
Figure 3: Intra-seasonal variation of Chl-a at R1 and R2 regions; (a) winter monsoon period (January, February), (b) pre-monsoon period (March, April, May), (c) southwest monsoon period (June, July, August, September) and (d) northeast monsoon period (October, November, December).
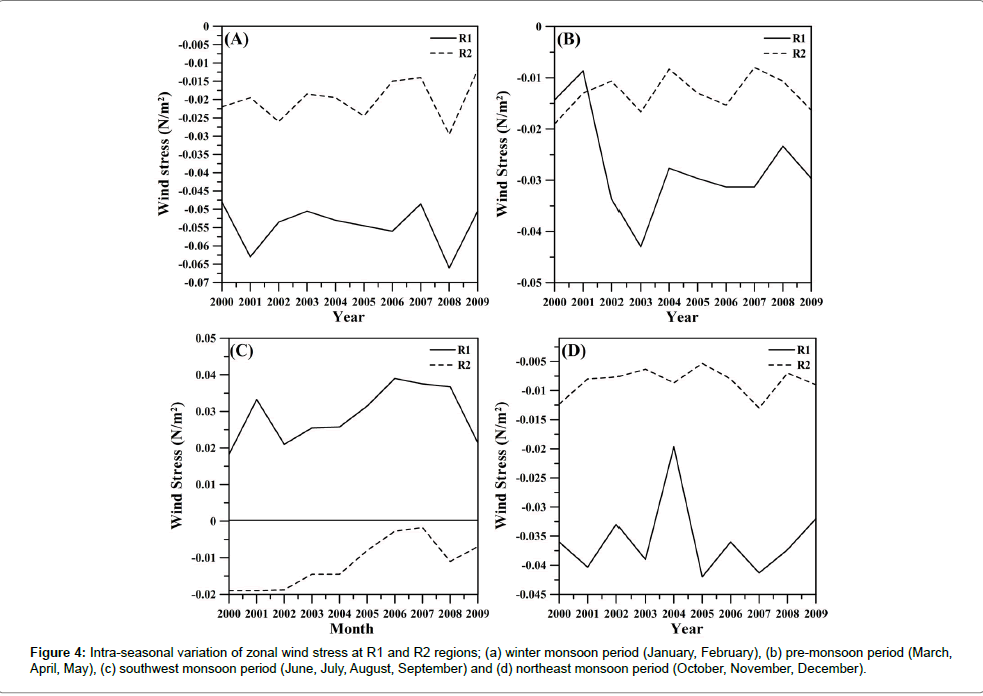
Figure 4: Intra-seasonal variation of zonal wind stress at R1 and R2 regions; (a) winter monsoon period (January, February), (b) pre-monsoon period (March, April, May), (c) southwest monsoon period (June, July, August, September) and (d) northeast monsoon period (October, November, December).
The important feature of this high concentration is coastal upwelling phenomena along the coast due to the favorable wind conditions. Only two years (1998 and 2009) of the concentration is high, this may be due to some remote forcing at R1. An abnormal behavior in chlorophyll-a concentration is observed at R2 during 2001-2005 and the effect of El Nino is also not clear. In some years (Ex. 2002) the concentration is increasing and another year (Ex. 2009) it is low. This is quit opposite behavior compared with the other two seasons (winter and pre monsoon). But the entire scenario is reversed at R1 region. During La Nina phase the situation is opposite except during 2004. The wind stress also plays an important role during this season. The strength of wind is very high compared with the other two seasons (Figure 3c and 4c).
The chl-a for both zonal and meridional wind stress shows a great variability (Table 1). In all seasons high concentrations ranges widely from 0.42 to 2.29 mgm-3 is observed at R1 regions with a mean of 0.93 mg m-3 and a standard deviation (SD) of 0.54 mgm-3, whereas the concentrations at R2 ranges from 0.17 to 1.17 mgm-3 with a mean of 1.23 mgm-3and its standard deviation is 0.39 mgm-3. It is the highest value in all seasons. The mean value of Chl-a concentration is high at both regions during southwest monsoon season, but the SD is higher at R1 during winter season. Thus, the Chl-a concentration is higher at R1 than R2 during southwest monsoon. But the coefficient of variance is high at R1 region because of high concentration in two years (1998 & 2009 see in Figure 3c). Both zonal and meridional wind stress almost show the same patterns.
| Parameter | Region | Season | Min | Max | Maen | SD | CV (%) |
| Chl-a | R1 | Winter | 0.75 | L07 | 0.93 | 0.1 | 10 |
| Pre-monsoon | 0.42 | 0.57 | 0.5 | 0.04 | 8 | ||
| Southwest Monsoon | 0.44 | 2.29 | 0.82 | 0.54 | 65 | ||
| Northeast Monsoon | 0.55 | 1 | 0.73 | 0.14 | 19 | ||
| R2 | Winter | 0.19 | 0.28 | 0.23 | 0.03 | 12 | |
| Pre-monsoon | 0.17 | 0.26 | 0.23 | 0.03 | 12 | ||
| Southwest Monsoon | 0.8 | 1.77 | 1.23 | 0.39 | 32 | ||
| Northeast Monsoon | 0.24 | 0.57 | 0.36 | 0.12 | 32 | ||
| Zonal Wind stress | R1 | Winter | -0.007 | 0.002 | -0.003 | 0.003 | -104 |
| Pre-monsoon | 0.019 | 0.033 | 0.025 | 0.004 | 17 | ||
| Southwest Monsoon | 0.103 | 0.141 | 0.124 | 0.011 | 9 | ||
| Northeast Monsoon | -0.015 | 0.027 | -0.005 | 0.012 | -228 | ||
| R2 | Winter | -0.012 | 0.004 | -0.003 | 0.005 | -157 | |
| Pre-monsoon | 0.017 | 0.062 | 0.035 | 0.015 | 44 | ||
| Southwest Monsoon | 0.093 | 0.127 | 0.108 | 0.012 | 11 | ||
| Northeast Monsoon | -0.017 | 0.024 | 0.01 | 0.013 | 140 | ||
| Meridional wind stress | R1 | Winter | -0.066 | -0.048 | -0.054 | 0.006 | -11 |
| Pre-monsoon | -0.043 | -0.009 | -0.027 | 0.01 | -36 | ||
| Southwest Monsoon | 0.018 | 0.039 | 0.029 | 0.008 | 26 | ||
| Northeast Monsoon | -0.042 | -0.02 | -0.036 | 0.007 | -18 | ||
| R2 | Winter | -0.03 | -0.012 | -0.02 | 0.006 | -28 | |
| Pre-monsoon | -0.019 | -0.008 | -0.013 | 0.004 | -28 | ||
| Southwest Monsoon | -0.019 | -0.002 | -0.012 | 0.007 | -56 | ||
| Northeast Monsoon | -0.013 | -0.005 | -0.009 | 0.002 | -29 |
Table 1: Basic statistics of seasonal mean chlorophyll-a, zonal and meridional wind stress at R1 and R2 regions.
Inter-annual variation of Chl-a and SSW
The time series of inter-annual variation for the chlorophyll-a at the R1 and R2 are shown in Figure 5. This pattern shows a cyclic variation for R1. There are five high (above 1.5 mgm-3) peak values identified at R2 region during southwest monsoon season. But only three peaks were observed during the same season at R1. But the overall concentration is high at R1 because of the very high chl-a concentration during 1998- 1999 (more than 7 mgm-3). This high concentration coincides with the El Nino year. The high chlorophyll-a values coincide only in two seasons i.e., during 1998 and 2007 (Figure 6a-6d). Owing to that there is 2-3 months lag between R1 and R2 when comparing with the zonal and meridional wind stress and wind stress curl (Figure 7a-7d). The maximum wind stress value coincides with the high concentration in both regions. It seems that wind stress is one of the forcing parameter to increase the chlorophyll-a concentration at these two regions. During 2002 El Nino year the strong negative wind stress curl coincides with the high concentration at R2 region where it is positive at R1 region during southwest monsoon season. It clearly shows that the role of curl on enhancement of chl-a along the eastern Arabian sea.
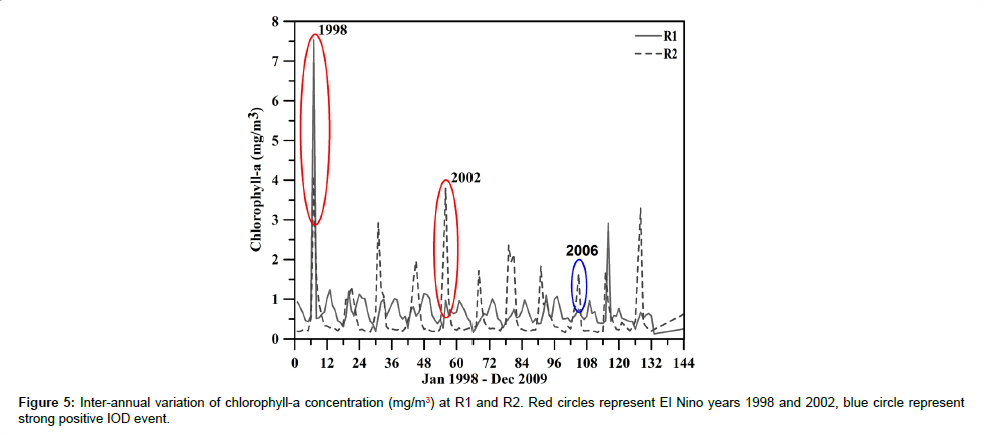
Figure 5: Inter-annual variation of chlorophyll-a concentration (mg/m3) at R1 and R2. Red circles represent El Nino years 1998 and 2002, blue circle represent strong positive IOD event.
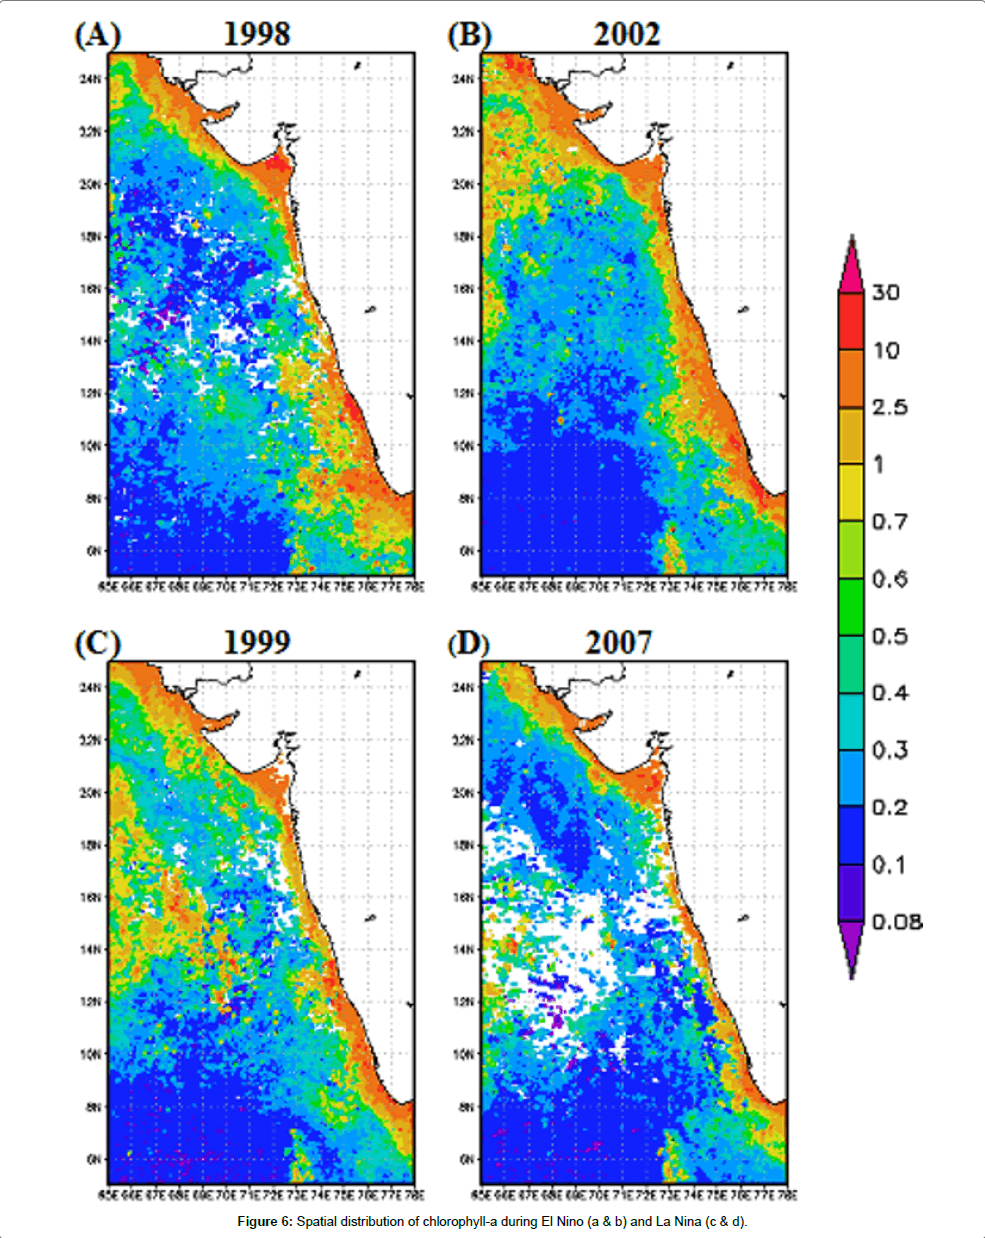
Figure 6: Spatial distribution of chlorophyll-a during El Nino (a & b) and La Nina (c & d).
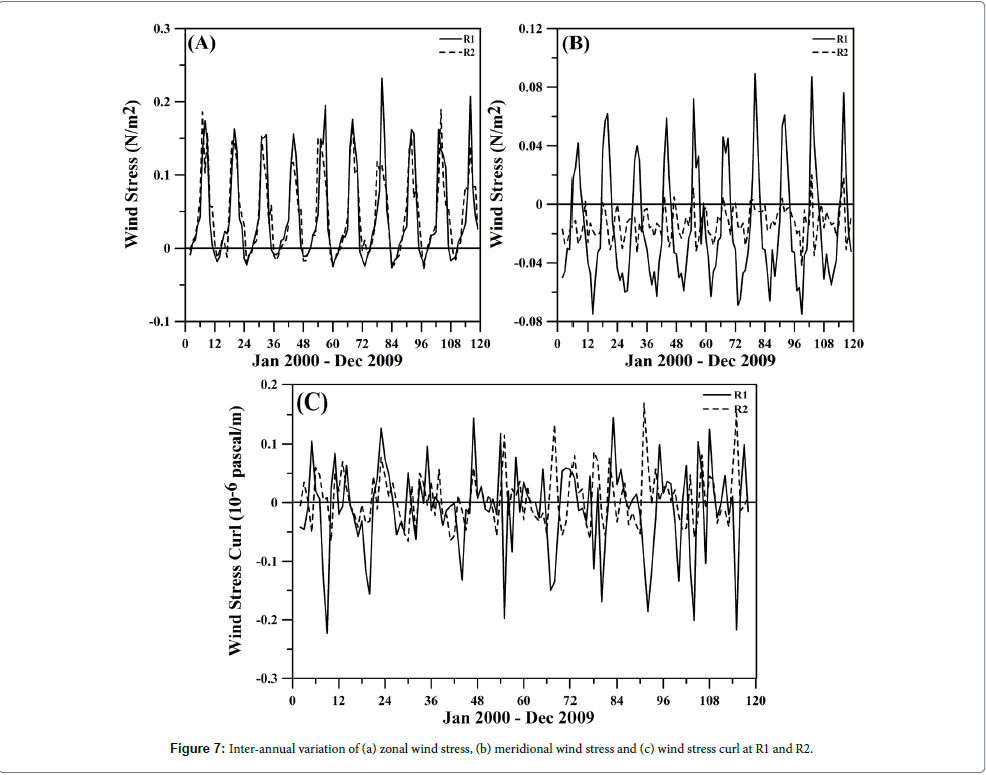
Figure 7: Inter-annual variation of (a) zonal wind stress, (b) meridional wind stress and (c) wind stress curl at R1 and R2.
An immense inter-annual variability is identified in chlorophyll-a concentration and wind stress (Table 2). The chl-a concentration varies from 0.16 to 7.53 mg m-3 with a mean of 0.74 mg m-3, standard deviation of 0.71 mg m-3 and a CV of 118%. The standard deviation is high at R1 region compared with R2. It seems that a low degree of uniformity of the Chl-a as well as homogeneity of a series. This means that chl-a at R1 is less uniform compared with R2 region.
| Parameter | Region | Min | Max | Mean | SD | CV(%) |
| Chl-a | RI | 0.17 | 753 | 0.74 | 0.71 | 96 |
| R2 | 0.16 | 4.1 | 0.59 | 0.7 | 118 | |
| Meridional wind stress | RI | -0.075 | 0.089 | -0.015 | 0.039 | -263 |
| R2 | -0.042 | 0.02 | -0.013 | 0.011 | -86 | |
| Zonal wind stress | RI | -0.027 | 0.232 | 0.046 | 0.065 | 140 |
| R2 | -0.029 | 0.19 | 0.047 | 0.056 | 118 |
Table 2: Basic statistics of annual mean chlorophyll-a, zonal and meridional wind stress at R1 and R2 regions.
Relationship between Chl-a and MEI, IOD
The climatic effects (El Nino and La Nina) are also very well reflected in the Chl-a. During 1998 El Nino, Chl-a increased up to about 7 mgm-3 at R1 region, but the enhancement (4 mgm-3) was low at R2 region, where the opposite trend was observed during La Nina phase at both regions. To investigate the relationship between the chlorophyll-a concentration and putative physical drivers like wind stress, climatic teleconnections (MEI and Indian Ocean dipole (IOD), a simple correlation analysis was performed on the mean fields for each variables. The strongest negative correlation (-0.58, significant at 99.9% level) was seen with zonal wind stress at R2 region during northeast monsoon season (Table 3), the Indian Ocean dipole is also shows the same relationship. The second (-0.55, significant at 99.9% level) and third (-0.53, significant at 0.01% level) highest negative correlation was perceived at R2 region with chlorophyll-a and zonal wind stress during winter season. All the other seasons showed modest correlations (r>0.5) between chl-a and Wind stress (Table 3); the period of analysis was from 1998 to 2009 for chl-a and 2000 to 2009 for wind stress data. It indicates that MEI is a statistically good predictor of the intensity of chl-a, which is normally controlled by the prevailing wind field. ENSO related variability is thus preferred explanation for the local changes in the biological fields at R2. The relationship between IOD and Chl-a is negative in all seasons except for the pre monsoon period (MAM) at R2 compared with MEI. The same relationship is also observed at R1 regions. This shows that the role of IOD is strong in the entire eastern Arabian Sea but the MEI shows different pattern. The overall strong positive relation (0.79, significant at 99.9% level) is between curl and MEI at R1 region during southwest monsoon and the inverse relation (-0.63, significant at 99.9% level) is observed at R2 regions during north east monsoon.
In this study, the Chl-a variability in 4°×4° stretch of two regions in the eastern Arabian Sea along the west coast of India was described. The high Chl-a (>0.4 mgm-3) is from January to March and peak at June at the northern (R1) region, and the high Chl-a values were only shown during southwest monsoon season (from June to September) in the southern (R2) region. This is almost similar to the previously reported seasonal Chl-a at this region [27-29]. It is well established that the upwelling is responsible for the chl-a enhancement at R2 [30]. The upwelling ensues from the strong summer monsoon wind that runs diagonally across the Arabian Sea [31-32]. The offshore extension of the Chl-a around R2 was restricted to the some (marginal Lakshadweep Sea) regions, by the presence along the coast of the southward flowing West Indian Coastal Current. The vertical mixing generated under the action of the cold, dry and continental northeasterly winds is the dominant physical mechanism for the Chl-a enhancement during winter season [33] at R1. Strong decreasing trend is observed in Chl-a at R1 compared with R2. The decreasing trend starts from 2004 onwards. Furthermore, the relationship between Chl-a with wind stress and climatic teleconnections (El Nino and IOD) was explored. The Chl-a bloom occurs as a result of the upwelling that pumps the nutrients of the deep rich water to the euphotic zone through entrainment mechanism due to strong northeasterly winds at R1 regions, and it also coincides with the past studies.
In the present study the authors wish to investigate the relationship between chl-a and climatic teleconnections (El Niño and IOD), its seasonal and interannual variations in the eastern Arabian Sea. The tropical eastern Arabian Sea (particularly the regions R1 and R2) is focused to imperative atmospheric process transferring momentum to the oceanic and coastal waters in the region and altering the balance of the process that maintain the mixed layer. Further, this region was considered as one of the most productive water of the Indian Ocean, which results from the winter cooling and upwelling. SeaWiFS data clearly exemplifies significant seasonal and inter-annual variations in chlorophyll-a concentration at R1 and R2 regions. High concentrations at R1 region is mainly due to the winter cooling, river run off and sometimes wind induced upwelling, but the situation is reversed at R2 regions. The main process to increase the chl-a concentration at R2 is upwelling.
Changes in oceanographic conditions associated with ENSO have long been recognized as having dramatic biological impacts. Inverse relationships between the seasonally averaged Chl-a and wind stress anomaly with MEI were mutually consistent (Table 3) and supported the existence of a link between ENSO and the intensity of chl-a through the atmospheric teleconnection. Owing to anomalously low nutrient concentrations during El Niño, primary production is dramatically reduced causing severe consequences to higher trophic levels of the food web, including substantial reductions to the numbers of planktonfeeding fishes such as sardines and anchovies, which are frequently available in these two regions. The impact of IOD is high at the R2 region compared with R1 region. Fine resolution atmospheric, ocean and ecosystem models are necessary to find out the long term changes in chl-a, estimation of primary productivity and also the carbon budgeting, which plays a vital role in global warming.
| Region - I | ||||
| Parameter | JF | MAM | JJAS | OND |
| Chl_a | -0.43(-0.08) | 0.01(0.20) | 0.07(-0.42) | -0.35(-0.43) |
| Zonal_Wstr | 0.23(0.17) | -0.08(-0.01) | -0.23(0.06) | 0.07(0.03) |
| Meridional_Wstr | 0.43(0.09) | -0.51(0.34) | -0.32(0.34) | 0.51(0.15) |
| Wind stress Curl | -0.04(0.03) | 0.15(0.26) | 0.79(-0.23) | 0.12(0.38) |
| Region- II | ||||
| Chl_a | -0.55(-0.46) | -0.27(0.29) | 0.17(-0.49) | -0.38(-0.48) |
| Zonal_Wstr | -0.53(0.25) | -0.20(0.17) | -0.49(-0.47) | -0.58(-0.61) |
| Meridional_Wstr | 0.24(0.28) | 0.18(-0.40) | 0.01(0.43) | 0.44(-0.01) |
| Wind stress Curl | -0.15(0.10) | -0.45(0.51) | -0.11(0.07) | -0.63(-0.70) |
Table 3: Relationship between chlorophyll-a, wind stress (zonal, meridional) and climatic indices (MEI, IOD) at R1 and R2 regions. Significance level is 99.9 % (Correlation is above 0.4). Within brackets represent relation with IOD.
The present research work is funded by the Department of Science and Technology, Govt. of India under the Fast Track Young Scientist Project (SR/FTP/ ES-09/2008) which is gratefully acknowledged. I am also thankful to jet propulsion laboratory and NASA GIOVANNI for providing satellite data.