Journal of Medical Diagnostic Methods
Open Access
ISSN: 2168-9784
ISSN: 2168-9784
Research Article - (2016) Volume 5, Issue 3
Background: Stroke volume variation (SVV) assessment using electric cardiometry could offer an alternative to invasive maneuvers for determining fluid response.
Methods: Thirty patients with severe sepsis and hypotension (Mean arterial pressure i.e., MAP<65 mmHg), were enrolled in our study. Fluid resuscitation (30 ml/kg) was administered. Fluid response was defined as MAP ≥ 65 mmHg and lactate <4 mmol/L. Preload assessment was done through SVV, to assess fluid response.
Results: The study included 13 males (43.3%) with age 47.8 ± 19.7. Paired comparison showed significant change in MAP readings (P value <0.001). ROC curve showed cutoff 12.5% for delta CO to predict fluid responsiveness with Area under Curve (AUC) 0.927, sensitivity 90.0%, and specificity 70.0%. ROC also showed delta CO cutoff 12.5% to predict survival with AUC 0.756, sensitivity 66.7% and specificity 66.7%.
Conclusion: Stroke volume variation, measured by electric cardiometry could be used to predict fluid response and survival in acute circulatory failure in septic critically ill patients.
Keywords: Right atrial pressure; Tricuspid excursion; Stroke volume variation; Fluid response
Patients with severe sepsis are at risk of acute circulatory failure with subsequent serious morbidity and mortality risks. Sepsis results into an unopposed vasodilatation associated with impaired cardiac contractility. Fluid administration is crucial in managing septic patients with hemodynamic instability, with preload dependency, to reverse morbidities.
However, this imposed the need to predict fluid responders with preload dependency to optimize fluid therapy. Static measures were studied extensively, but the poor predictive value of static measures and clinical examination has led to the investigation of the dynamic measures of fluid responsiveness. Increase in stroke volume variation (SVV) emerged as an acceptable surrogate for positive fluid response [1].
Electrical velocimetry has been validated for non-invasive appraisal of preload dependency [2-5]. In our study, we utilize electrical velocimetry to monitor stroke volume in acute circulatory failure settings.
Aim of Study
To examine stroke volume variation, measured by electrical cardiometry as a predictor of survival and fluid response in management of critically ill septic patients with hemodynamic instability.
Methods
This is a prospective observational study, which was conducted on thirty patients with the diagnosis of severe sepsis, admitted to the Critical Care department of Cairo University. Sepsis was defined using the standard Surviving Sepsis Campaign criteria [6]. Our protocol was approved by the Ethical Committee Review Board of the Faculty of Medicine, Cairo University. All patients consented to participate.
Patients who experienced hypotension (defined as MAP<65 mmHg), were enrolled in our study. Exclusion criteria: Age<18 years, history of heart disease (e.g. valvular, myopathy, ischemic), history of hepatic or renal diseases, evidence of pulmonary embolism or dysrhythmias. Patient enrollment is depicted in figure 1. Acute physiological and chronic health evaluation (APACHE II) scoring system was calculated and lactate withdrawn during the first 24 hours after admission. Fluid resuscitation (30 ml/kg) was given. Stroke volume variation was assessed to judge response to fluid administration. After fluid administration, patients who exhibited persistent hypotension were maintained on vasopressors.
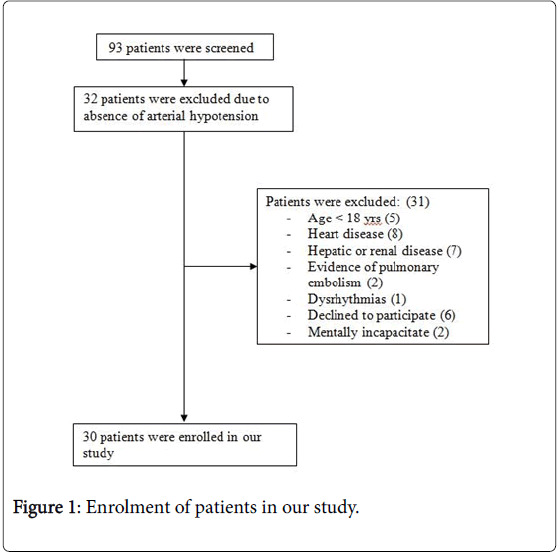
Figure 1: Enrolment of patients in our study.
Fluid response was defined as improvement in MAP after fluid resuscitation i.e., MAP ≥ 65 mmHg and lactate <4 mmol/L. For volume expansion, 30 ml/kg Normal Saline 0.9% was infused over 2 hours.
Measurements were taken before and after fluid administration: stroke volume variation (SVV) by ICON® CARDIOTRONIC, OSYPKA MEDICAL. Patients were studied in a supine position.
Stroke volume variation (SVV) by electric velocimetry (electric cardiometry) device ICON® is used and measured before and after fluid administration. For this purpose, four sensors were applied- first: approximately 5 cm above the left base of the neck, second on the left base of neck, third on the lower left thorax at the level of the xiphoid and the fourth one on the lower left thorax approximately 5 cm below the 3rd electrode at the level of anterior axillary line. The Electrical cardiometry monitor (Electrical Cardiometry monitor, ICON Cardiotronics, Inc., La Jolla, CA 92307; Osypka Medical GmbH, Berlin, and Germany) was connected to the sensor cable and the patient data were fed. The ICON monitor incorporates an algorithm which transforms the ohmic equivalent of mean aortic blood flow acceleration into an equivalent of mean aortic blood flow velocity [7-8].
Stroke volume variation is calculated as percent of change in stroke volume during inspiration and expiration during the most recent 20 seconds. Stroke volume variation is also defined as the variation of beat-to-beat SV from the mean value during the most recent 20 seconds. SVV=(SV max- SV min)/SVmean×100. The mean value of three consecutive SVV determinations was used for statistical analysis (more than 1 min).
Our study was designed to estimate SVV in fluid responders. The equation for sample size is N=4δ2(Zcrit)2 / D2 [9]. Where N is the sample size of the single study group, δ is the assumed SD for the group, the Zcrit value (1.645) is Standard Normal Deviate that corresponds to Significance Criteria of 0.05 and CIs of 95%, and D is the total width of the expected CI. We studied previous studies that explored SVV and expected SD would range 2-3 mm. The limits of the 95% confidence interval to be no more than 1 mm above or 1 mm below the mean of SVV [10-13]. Based on these assumptions, N=4 (2)2 (1.96)2 / (2)2=15. Reviewing previous results to determine prevalence of positive fluid response in severe sepsis scenario, fluid responders comprised 78.2% in ARISE trial and 82.1% in ProCESS trial [14,15]. We assumed fluid response rate of 80% and therefore we need at least 24 patients with severe sepsis to explore SVV in fluid responders.
Numerical variables were described as Mean ± SD. Categorical variables were described as percentages. Comparisons were done using Student ‘t’ test for numerical variables, paired ‘t’ test for paired comparisons and Chi square test for categorical variables. Correlations were plotted and R values were stated. Paired “t” test was used to compare baseline and follow-up measurements.
ROC curves were plotted to predict initial tricuspid E/Ea to different CVP categories and SVV to predict fluid response and survival. P value was considered significant if ≤0.05. Statistics were calculated using SPSS 21 package [16].
Thirty patients were enrolled in the current study. The study included 13 males (43.3%) with mean age 47.8±19.7. Average length of ICU stay (LOS) was 10.7±6.2 days. Sepsis with an identified pathogen (proved by microbiological culture) was documented in 25 patients (83.3%). Sources of infection were described in the table 1. Hemodynamics and laboratory values were presented in Table 2. APACHE II was 16.7±5.6. Mortality was 50.0%.
| Source of infection | Percentage |
|---|---|
| Chest infection | 22 (73.3%) |
| Urinary tract infection | 4 (13.3%) |
| Blood stream infection | 2 (6.7%) |
| Infected surgical wound | 2 (6.7%) |
Table 1: Sources of infection in our study.
| Vital signs and lab values | Mean±SD |
|---|---|
| Temperature | 38.8±0.7 |
| Respiratory rate | 31.0±7.1 |
| Heart rate | 106.4±18.8 |
| MAP | 52.9±7.9 |
| Pulse pressure | 34.0±11.3 |
| Hemoglobin (Hb) | 12.3±0.9 |
| Platelet count | 96.5±64.2 |
| Leucocytic count | 17.7±8.5 |
| INR | 1.7±0.2 |
| Bilirubin | 1.8±1.1 |
| Creatinine | 1.8±1.4 |
| Random blood sugar | 141.8±57.7 |
| C-reactive protein | 18.7±9.9 |
| Lactate | 3.5±1.9 |
Table 2: Vital signs and laboratory values for included patients.
Paired comparisons between MAP and pulse pressure before and after fluid challenge showed significant differences in MAP readings after fluid challenge (P value <0.001) while pulse pressure readings did not differ significantly, (P value=0.110) as shown in table 3.
| Hemodynamic parameters | Before fluid challenge | After fluid challenge | P value |
|---|---|---|---|
| MAP | 52.9±7.9 | 63.8±9.0 | <0.001 |
| Pulse pressure | 34.0±11.3 | 36.0±10.7 | 0.110 |
| SVV | 11.9±3.6 | 6.2±1.1 | <0.001 |
Table 3: Paired comparison between initial and follow-up hemodynamic readings.
In the current study, electrical impedance was utilized to measure stroke volume variation as a predictor for fluid response. Fluid response was determined in 10 patients (33.3%). Fluid non-responders had a higher length of ICU stay (12.9±6.5 vs. 6.5±2.3, P <0.001), worse APACHE II score (19.2±4.1 vs. 11.7±4.9, P <0.001) and higher lactate levels on admission (4.1±1.9 vs. 2.6±1.4, P <0.034). SVV in responders was 15.6±2.7%, while it was 10.1±2.4% in non- responders which was statistically significant (P <0.001).
ROC curve was plotted in figure 2 to show predictability of SVV for positive fluid response. The optimal cutoff was determined using the Youden index method (0.70) showed cutoff 11% for SVV to predict positive fluid responsiveness with Area under Curve (AUC) 0.927, sensitivity 100.0%, and specificity 70.0% in figure 1. Positive predictive value was 77.8% and negative predictive value was 85.7% [17].
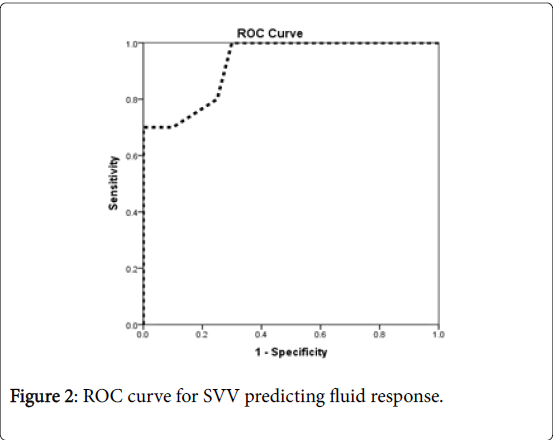
Figure 2: ROC curve for SVV predicting fluid response.
Fluid non-responders showed worse outcome i.e., Mortality (70.0% vs. 10.0%, P=0.005). There were a significant difference between survivors and non-survivors for SVV where SVV in survivors was 13.7±3.5 while it was 10.1±2.8 in non- responders which was statistically significant (P=0.004). ROC also showed SVV cutoff 11% to predict survival with AUC 0.784, sensitivity 80.0% and specificity 73.3% in figure 3. Positive predictive value was 75.0% and negative predictive value was 78.6%. Youden index was 0.533.
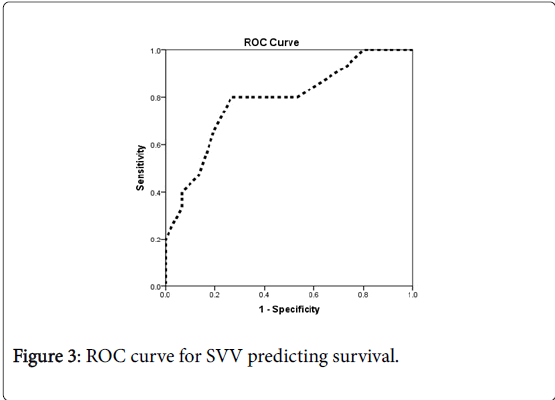
Figure 3: ROC curve for SVV predicting survival.
Surviving sepsis campaign guidelines have proposed both 3-hours and 6-hour bundles to guide management of severe sepsis with evidence of tissue hypoperfusion. Surviving sepsis campaign recommended MAP < 65 mmHg or lactate ≥ 4 mmol/l as surrogates for tissue hypoperfusion and need for fluid resuscitation.
In the current study, fluid responders had shorter length of ICU stay, (6.5±2.3 vs. 12.9±6.5, P=0.001). This was in concordance with Lopes et al. who examined the relation between maximizing stroke volume (volume loading) during high-risk surgery and post-operative outcome. He concluded that maximizing stroke volume improved postoperative outcome and decreased the length of stay in hospital [18].
Regarding the degree of fluid responsiveness, in our study, we have found that patients who had higher baseline stroke volume variation (SVV) showed higher degrees of fluid responsiveness. SVV in responders was 15.6±2.7%, while it was 10.1±2.4% in non- responders which was statistically significant (P<0.001). This was in concordance with Angappan et al. [19] who investigated 45 mechanically ventilated patients in sepsis with acute circulatory failure and receiving volume expansion. Before volume expansion, SVV was higher in responders than in non-responders.
We measured SVV by cardiac velocimetry (electric cardiometry) to assess for fluid response. Previous attempts to assess SVV in predicting fluid response showed the feasibility of SVV in varying scenarios. Guinot et al. [10] conducted a study on 34 patients, monitored by cardiac bioimpedance during surgery under spinal anesthesia. Systolic arterial blood pressure (SAP), SVV, and cardiac output (CO) increased and heart rate decreased in fluid responders. Stroke volume variation in response to mini-fluid challenge differed between patients who showed arterial responsiveness and those in whom SAP did not increase with volume expansion (11.6% versus 2.5%, P value<0.001). Also Cheng et al. [11] examined SVV ability (measured by FloTrac/ Vigileo) in patients undergoing gastrointestinal surgeries. He concluded that SVV measured by FloTrac/Vigileo system could predict fluid responsiveness in patients undergoing ventilation with low tidal volumes during gastrointestinal surgery.
Soliman et al. [12] examined SVV predicting ability for fluid responsiveness in acute circulatory failure and proposed a baseline stroke volume variation ≥ 8.15% that could predict fluid responsiveness in mechanically ventilated patients with acute circulatory failure. Marx et al. [13] also examined SVV in guiding fluid therapy in patients with severe sepsis and concluded that SVV allows estimation of preload and prediction of cardiac index changes in response to fluid loading.
Stroke volume variation by cardiac velocimetry succeeded to predict fluid responsiveness with Cut off value of 11.5%, Sensitivity 100.0%, specificity 70.0% and P value <0.001. Berkenstadt et al. [20] conducted a study on 15 patients to test the ability of SVV to predict fluid responsiveness in patients undergoing brain surgeries. He noticed that SVV value of 9.5% or more, would predict an increase in the SV of at least 5% in response to a 100-mL volume load, with a sensitivity of 79% and a specificity of 93%. Kim et al. [21] also studied SVV values before fluid loading in patients undergoing carotid endarterectomy and he concluded SVV ≥ 7.5% identified fluid responders with a sensitivity of 92.9% and a specificity of 63.6%. Also Suehiro et al. [22] investigated the effectiveness of stroke volume variation (SVV) shown by the Vigileo-FloTrac™ system to predict fluid responsiveness in patients undergoing airway pressure release ventilation. The optimal threshold value of SVV to discriminate between responders and nonresponders was 14% (sensitivity: 78.9%; specificity: 64.3%).
Our findings also showed that fluid responders had better survival rates and SVV could help in guiding fluid therapy to potential fluid responders with expected better morbidity and mortality outcomes. Fluid management, guided by SVV was investigated by Peng et al. [23] who evaluated the influence of stroke volume variation (SVV)-based goal-directed therapy (GDT) on splanchnic organ functions and postoperative complications in orthopedic patients and concluded that SVV-based GDT during major orthopedic surgery reduced the volume of the required intraoperative infused fluids, maintained intraoperative hemodynamic stability, and improved the perioperative gastrointestinal function [23]. Another study by Zhang et al. [24] was designed to utilize stroke volume variation and cardiac index to ensure fluid optimization during one-lung ventilation in patients undergoing thoracoscopic lobectomies and demonstrated that an optimization protocol, based on stroke volume variation and cardiac index, increased the PaO2/FiO2-ratio and reduced the overall fluid volume, intubation time and postoperative complications [24].
Our study confirmed the feasibility of electric velocimetry to measure stroke volume variation, as a predictor of fluid responsiveness in critically ill patients with acute circulatory failure.
Stroke volume variation, measured by cardiac velocimetry, could be used to guide fluid therapy in critically ill patients, with a beneficial impact on morbidity and mortality.