Journal of Geology & Geophysics
Open Access
ISSN: 2381-8719
ISSN: 2381-8719
Research Article - (2022)Volume 11, Issue 4
The hydrocarbon potential assessments were carried out on sixteen (16) samples obtained from the Nkporo shales, Calabar flank, to assess the Total Organic Carbon (TOC), and Soluble Organic Matter (SOM) contents. TOC values ranged from (0.44-5.16) wt. % by common significance of 2.20 wt. % which indicates adequate organic matter of fount stone, while SOM values ranged from (1385-2785) ppm and (13.84-27.85) wt. % of 2041 ppm and 20.65 wt. % common proportion, indicating a higher organic matter for petroleum source rock with good hydrocarbon content. The depth of sample formations ranged from (1.0-25.0) m which depicts a dark grey to the dark brown coloration of Nkporo shales interbred of sandy shale, siltstone, and mudstone respectively. However, the TR analysis for the level of rock maturity shows a high value of 72.82 wt. % which indicates the state of maturity of the studied samples. This implies that the Calabar flank should be an immediate exploration focus.
Calabar flank; Source rock; Nkporo; Shale; Organic matter
The earth science of Nkporo shale (Campano-Maastrichtian) in the Anambra basin, Eze-Aku formation (Turonian), Awgu (Turonian- Coniacian), alluviums within the lower Benue trough of Nigeria have been carried out by a sequence researcher on the shoot and near-surface shale samples, to assess their source rock characteristics features [1,2]. They recorded that Campano to Maastrichtian lithofacies is composed of the major source rocks with a proportion of natural contents of shale fairly similar to the Niger-Delta basin using the formation density technique of organic geochemical analysis. Barely scarce recorded accounts are obtainable on this area of the Calabar-flank, which was involving the use of wire logs for a rapid assessment of the organic content of the sedimentary rock. This technique did not give much aerial coverage data of shoot and near-surface shale evaluation. Based on its time absorbing and exorbitant approaches accompanied the technique analysis, which is subject to the problems of coverage limitation of samples and sampling bias in the identification and characterization of source rocks. This leads to persistent cases of oil seepages that are hazardous to environments and lives within the region. These coverage data limitations of samples and sampling bias problems necessitate us into this current research to assess and ascertain its hydrocarbon potential and gather adequate data within this region. This current research, therefore, poses the fundamental mineralogical methods of shale facies in both out-crops and sub-crops by taking advantage of the evaluation of TOC, and SOM contents over a wide coverage area in the delineation of source rocks. This fundamental method is most preferable and beneficial therefore lower exorbitant, less time- intensive with much aerial coverage data in assessing the bearing hydrocarbon potentials, and gives better attributes of source rocks in the study area. The knowledge through these fundamental mineralogical methods will aid better characterization of shale toward the quantitative, and quantitative analyses, sediment ages, and generation of hydrocarbon potential [2,3]. Two methods were adopted such as geological field mapping and laboratory studies for the goal of achieving the objectives of this study. Sixteen (16) samples were acquired and picked at various lithological locations along the outline, stamped, and kept in bags for further laboratory studies. This was done to assess and ascertain the hydrocarbon potentials of the Nkporo shale in the Calabar flank. This analysis reveals the TOC and SOM contents averages of 2.20 wt. % and 20.41 wt. % above the standard threshold values of 0.5 wt. % interpreted as a good petroleum source rocks. On the other hand, the TR index of maturity shows high values of 72.82 wt. % that is greater than the minimum standard maturity grade of 70 wt. % indicating that the sediments in the study area are mature. Hence, the motives behind this research aimed to carry out a hydrocarbon potential assessment of the Nkporo shale of the Calabar flank. The delineations involve analysis and elucidation of the source rocks variables to assess and ascertain the hydrocarbon source potential of studied sediments.
Location and geology of the study area
It consists of fluvial deltaic clastic sediment accumulating in a prograding deltaic margin as deltaic and non-marine sediments [4]. There are sequences of sandstone, siltstone, carbonaceous and pyritic shales as well as conglomerates. The name ‘Awi Formation’ was given by Adeleye et al. [5]. It is exposed at km 25 from Calabar along Calabar-Ikom Highway. There is a sharp contact between Awi Formation and the basement complex. A formation shows graded beddings. The marine incursion was accumulated in the Middle Albian [6,7], particularly on the horst and relatively stable platform areas and their flanks. It is well exposed at 25.5 km along Calabar-Ikom Highway within a deep valley. They occur as massive boulders and eroded pillars scattered around the area as shown in Figure 1. It is highly fossiliferous with fossil fragments such as pelecypods, gastropods, and bioturbation structures [8]. The Ekemkpon shales which is the next unit is made up of dark grey shales with intercalations of a thin bed of oysters and calcareous limestone nodules. It lies unconformably on Mfamosing limestone formation. This shale unit outcrops at 24 km along Calabar-Ikom Highway as shown in Figure 2. It is about 15 m high here. In terms of fossil assemblages, gastropods, ammonites, pelecypods, bivalves, and foraminifera are here. These shales are highly friable and thinly laminated [9,10]. The next unit which comprises main marlstone with minor intercalations of shale and overlies the Ekemkpon shale unit is the New Nnetim marl. The dissolution near component leads to the formation of caves with stalactite and stalagmite. It occurs with Nkporo shale intercalation. They are fine to mediumgrained, grey-white, and highly fossiliferous with honeycomb and sinkholes. Fossils such as ammonites, gastropods, bivalves, algal, and stromatolitic structures are found here.

Figure 1: Geologic map of Nigeria showing Calabar flank.

Figure 2: Geology outline map and stratigraphy unit of the Calabar flank. Note:  Nkporo
shale;
Nkporo
shale;  New netim marl fm;
  Ekenkpon shale fm;
  Mfamosing limestone fm;
  Awi formation;
  Basement complex
It vile covers marl component, the shale accumulated in shallow open marine to paralic and continental settings [11]. Along Calabar-Ikom Highway, it is found from 20 km to 40 km. The Benin Sandstone consists of unconsolidated sandstone and gravels of continental origin which prevail posit through Tertiary to Recent Periods as shown in Table 1. However, there are plutonic and marble rocks within this region. Dolerites which occur as discordant intrusive and cut across the sedimentary beddings planes of Nkporo and New Nnetim marl are found in the area. This contact with the country rock is sharp, showing a chilled margin at the point of contact. Metamorphic rocks encountered in the area are mica schist, quartzite, and gneisses.
| Age | Lithology | Description | ||
|---|---|---|---|---|
| Recent Eocene |  |
Benin formation | Loose sands, pebbly and arkosic. | |
| Maastrichtian L campanian |  |
Nkporo formation | Dark grey, very fissile carbonaceous shale with gypsum bands and some calcareous nodules. | |
| Santonian |  |
Santonian formation | Santonian deformalional episode characterized by period of folding of pre-existing rocks and erosion and/or non-deposition. | |
| Coniacian | Odukapani group |  |
New natim marl | Dark grey massive marls intercalating with flaggy, calcareous grey shale with thalassinoides structures. |
| Turonain |  |
Ekenkpon formation | Grey fissile shale with thin bands of calcareous nodules, limestone and mudstone units. Abundant shell fragments, keeled ammonite, juvenile bivalves and gastropods. | |
| Cenomanian | 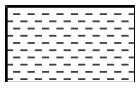 |
Un-named shale | Dark grey shale, highly fissile and separated by the upper shale unit by a regressive mudstone. | |
| Mid-Albian |  |
Mfamosing limestone | White to light grey limestone, stromalolilie at the base, with abundant fossils (gastropods, corals, shell fragments). | |
| Aptian | 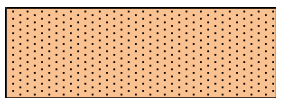 |
Awi formation | Reddish brown, coarse to medium grained arkosic sandstone. Pebbly at the base and exhibit fining upward sequence in cycles, graded bedding. | |
| Precambrian |  |
Precambrian basement complex | South-eastern basement complex Oban Massif composed predominantly of granite genisses, granite and granodiorites. | |
Table 1: Stratigraphic chart of the Calabar flank showing Nkporo Shales.
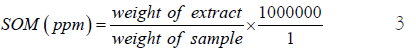
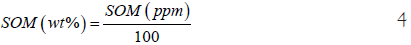
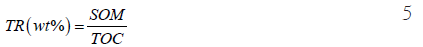
Soluble Organic Matter (SOM)
Sixteen samples were captured via mapping at 5 m intervals and cautiously situated to avert contamination. The qualitative and quantitative analyses of analytic methods were involved. In qualitative analyses, two stages were involved: The determination of TOC, and SOM contents. Quantitative analyses involved the TR index of maturity of the source rocks.
Total Organic Carbon (TOC)
The apparatus used was weighing balance, measuring cylinder, flat bottom flask, burettes, funnel, and spatula. The reagents used were normal potassium dichromate, concentrated sulphuric acid, and sodium fluoride diphenylamine as an indicator.
Two methods can be used in the determination of total organic carbon, the oxidation process and the titration process. However, the titration method was used in this work. Ferrous ammonium potassium-dichromate and sulphuric acid were put in the different burettes and set in a retort stand. 1.0 gram of sample was put on a vessel containing 10 cm3 of potassium-dichromate and 20 cm3 of concentrated sulphuric-acid was poured into the vessel and shaken for one minute. It was then left for 30 minutes for the complete oxidation of organic carbon. There is the possibility that remaining acids may be found. This led to the addition of 0.2 L of distilled water to return the solution to ph 7. The sulphuric-acid promotes the activity of potassium dichromate which oxidizes all the organic carbon. 0.01 L of phosphoric-acid was added to pick all the Fe3+ ions formed and bind into Fe2+ complexes. 0.2 g of Sodium fluoride was added to bind refractory metals that occur in the form of carbonates since we are looking for only organic carbon. Finally, a diphenylamine indicator was added and the color was grey. For the blank titration, there was no sample in the flask. This helped in estimating the endpoint of the titration.
This was employed to determine the organic substance quantity in the sediments that is soluble in an organic solvent. If sediments contain a high quantity of soluble organic matter, their petroleum potential is low since the insoluble parts (kerogen) are precursors of petroleum [12].
The apparatus used were Soxhlet extractor, condenser, round bottom flask, water bath, retort stand, clamp, sample beakers, glass wool, filter paper, measuring cylinder, funnel, and connecting tubes. The reagents used were methanol, acetone, and water. The compound of dimethyl ketone and dichloromethane in the ratio of 9:1 by volume was prepaid for this extraction. Since the reagent can mix with water, the apparatus had to be wetted with these reagents to avoid adulteration. In the Soxhlet extirpation procedure, the solvent acetone and methanol were meant to vaporize and condense on meeting the cool region in the condenser. By this method of refluxing, the solvent was made to in prolonged contact with the sample as much as possible to extract all the solvable materials in the sample [13].
The sample was put in a vessel over a steam bath. A steam bath was used for heating because the solvent used could easily catch fire. The extraction continued for between seven to forty-eight hours until there was no further changed color of the solution. The extract was emptied into a pre weigh beaker covered with a perforated paper to allow for evaporation. Since the room temperature was not enough to dissolve the solid, the vessel and its contents were placed in an oven at a low temperature and the evaporation process was fastened. The vessel contents were re-weighed to find the weight extract differences.
The results obtained from sixteen (16) samples in the geological field mapping were analyzed in the laboratory for organic contents. The organic contents analyzed were TOC, SOM, and TR index of maturity of source rocks using Eqns. 1-5. The results were presented as shown in Table 2. The TOC values ranged from (0.44-5.16) wt. %. The SOM values ranged from (1385-2785) ppm and (13.85- 27.85) wt. % with averages of 2041 ppm and 20.41 wt. %. However, TR values range from (5.04-72.82) wt. % indicating high valesvales of 72.82 wt. % on sample 4. The cross-plots of TOC and SOM show a common positive correlation as shown in Figures 3 and 4, while the cross-plots of TR show a negative correlation in Figure 5. The coefficient of correlation ranged from low in TOC values to Low in SOM and high in TR values from samples 1-4. A little gap in each sample varies from the common trend picked up from the cross-plots. These intervals are higher from samples 3-16 in TOC and SOM values corresponding to low TR index values. Figures 6 and 7, displayed the 3D column attributes about distributions of TOC, SOM, and TR, and three-dimensional terrain models picture of the study area
| Depth (m) | Samples Identity | TOC (wt %) | SOM (ppm) | SOM (wt %) | TR (wt %) | Colors |
|---|---|---|---|---|---|---|
| 1 | 1 | 0.44 | 1385 | 13.85 | 31.48 | Black grey |
| 2 | 2 | 0.76 | 1410 | 14.1 | 18.55 | Black grey |
| 3 | 3 | 0.81 | 1450 | 14.5 | 17.9 | Black grey |
| 5 | 4 | 0.23 | 1675 | 16.75 | 72.82 | Black grey |
| 6 | 5 | 1.62 | 1840 | 18.4 | 11.36 | Light grey |
| 8 | 6 | 2.1 | 2035 | 20.35 | 9.69 | Light grey |
| 10 | 7 | 1.57 | 2336 | 23.36 | 16.15 | Light grey |
| 12 | 8 | 1.05 | 1950 | 19.5 | 18.57 | Light grey |
| 14 | 9 | 2.52 | 2700 | 27 | 10.71 | Light grey |
| 15 | 10 | 2.81 | 2662 | 26.62 | 13.04 | Dark brown |
| 17 | 11 | 3.1 | 2705 | 27.05 | 8.73 | Dark brown |
| 18 | 12 | 3.02 | 1525 | 15.25 | 5.05 | Dark brown |
| 20 | 13 | 2.74 | 1580 | 15.8 | 5.77 | Dark brown |
| 22 | 14 | 3.45 | 1850 | 18.5 | 5.36 | Light brown |
| 24 | 15 | 3.81 | 2800 | 28 | 7.36 | Light brown |
| 25 | 16 | 5.16 | 2785 | 27.85 | 5.04 | Light brown |
| Averages | 2.2 | 2041 | 20.41 | 20.65 |
Table 2: Showing the depth, samples, TOC, SOM, TR contents, and colors.

Figure 3: Correlation of TOC (wt. %). Note:  TOC (wt. %); (-) Linear (TOC (wt. %)).

Figure 4: Correlation of SOM (wt. %). Note:  SOM (wt %); (-) Linear (SOM (wt %)).

Figure 5: Correlation of TR (wt. %). Note:  Linear (TR (wt %)); (-) TR (wt %).

Figure 6: 3-D Column showing the distribution of TOC (wt. %), SOM (wt. %) and TR (wt. %). Note:  SOM (wt %) ;
  TR (wt %).

Figure 7: 3-D contour map showing the modeling of TOC (wt. %), SOM (wt. %) and TR (wt. %).
After the titration and extraction of each sample, the following formulae were employed to calculate TOC, SOM and TR.

Where TOC=Total Organic Carbon, T=Sample titration, S=Standard titration obtained from bank
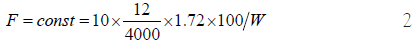
Where W=1
Hydrocarbon potential assessment of the Nkporo shale samples in the Calabar flank was carried out to ascertain if they are good, fair, or weak source rocks. In this study, sixteen (16) samples were analyzed in three criteria: Lithofacies, organic abundance along with degree of maturation. In lithofacies: Nkporo Shales were found in Campano-Maastrichtian ages at a depth ranging between (1-25) m with the description of four sets of two colors. That is Samples 1-2, have black gray, samples 6-14 have light gray, samples 15-20 have dark brown, and samples 22-25 have light brown respectively. However, very fissile carbonaceous shale, gypsum bands, and some calcareous were also depicted [14]. Inorganic richness: The finding of organic abundance was established on the measure of organic carbon. TOC content was analyzed to measure the fundamental materials of each sample as expressed in Equation 1 in weight percentage. The values ranged from (0.23-5.16) wt. %, with an average value of 2.25 wt. %, a higher value of 5.16 wt. % in Sample 4 showing a good grade of source rock richness. Comparing Nkporo shale values with worldwide TOC averages of all shale of 0.9 wt. %, carbon 0.5 wt. %, and source rock shale of 2.2 wt. % required for petroleum source rocks [15]. The values obtained are likewise uniform to the upshots from organic contents analyses in the Anambra Basin and Afrikpo syncline [16]. In their research of organic material of the Agbada, formation addition utilized the formation density technique and acquired TOC values that set to ± 20% of organic results in the Western Niger Delta. The current study area TOC values are higher than the bottom threshold for delineating potential source rocks; this is due to the capacity of Nkoro shale rock to generate and discharge hydrocarbon with a large volume of sediments deposition as shown in the 3D surface contouring parameters in Figure 7. SOM values ranged from (16.75-27.85) wt. % and (1675-2785) ppm, with averages of 24.15 wt. % and 2415 pm with an increase in depth of burial from (10- 25) m. This indicates that the source rock is desirably productive in hydrocarbon with a linear correlation of TOC as shown in Figures 3 and 4. The commonly positive correlation between TOC and SOM reveals that there is no significant anomaly in view of organic contents of the shale. On the other hand, the color changes from dark grey to dark brown indicate SOM content with a good source rock as shown in Figure 5. TR was employed for the quantitative analysis as regards measure the maturation sediment to produce hydrocarbon [17]. TR rate varied from (5.39-72.82) wt. %, with a high value of 72.82 wt. % showing a good maturity of sediments as shown in Figure 5. Also, TR shows a correlative assessment amid TOC and SOM values, measuring the transformation from kerogen into hydrocarbon, which is poor in samples: 6, 17-25, weak in samples: 1-3, 57-18, and good in sample 4. The highest value was seen in sample 4 having a high index of maturity of 72.82 wt. % depicting an age maturity grade of source rock with the threshold >70 indicating a good hydrocarbon potential source rock.
The results of several TOC, SOM, and TR analysis carried out within the studied area reveals that the sample reveals the area is primarily oil inclined. TOC rates ranged from (0.44-5.16) wt. % as well as the mean of 2.25 wt. %. According to Ekweozor TOC of sediments is the fundamental criterion that is essential to interpreting any diverse geochemical data, at such TOC values greater than 1.0 % are graded as a good source rock. SOM values ranged from (13.85-28.00) wt. %, results a mean of 20.41 wt. %. Hence the source, rock category arrangements of SOM, the average SOM values for analyzed sample cataracts within this reach are graded as good source rock. TR index of maturity shows the highest value of 72.82 wt. % which exceeds threshold minimum values of <70, indicating the hydrocarbon potential generation of a good maturation index of dark grey sample coloration. Consequently, it is moderate to infer that the lithofacies of Nkporo shales found in Campano-Maastrichtian ages, degree of organic richness by TOC, SOM are good graded and the maturity assessment of the study area comprise of matured sediments in a primary oil inclined domain.
Authors are appreciative to all competent team personnel amid the field study. Also, thank the Department of Geology,University of Calabar for supplying apparatus for the field work.
[Crossref] [Google Scholar] (11)
Citation: Aka MU, Effiong CI, Akpan DN (2022) Assessment of Nkporo Shales in Calabar Flank to Ascertain its Hydrocarbon Potentials, South- South, Nigeria. J Geol Geophys. 11: 1027.
Received: 09-May-2022, Manuscript No. JGG-22-17408; Editor assigned: 11-May-2022, Pre QC No. JGG-22-17408 (PQ); Reviewed: 25-May-2022, QC No. JGG-22-17408; Revised: 31-May-2022, Manuscript No. JGG-22-17408 (R); Published: 10-Jun-2022 , DOI: 10.35248/2381-8719.22.11.1027
Copyright: © 2022 Aka MU, et al. This is an open-access article distributed under the terms of the Creative Commons Attribution License, which permits unrestricted use, distribution, and reproduction in any medium, provided the original author and source are credited.