Journal of Geology & Geophysics
Open Access
ISSN: 2381-8719
ISSN: 2381-8719
Research Article - (2015) Volume 4, Issue 4
In today’s world, field investigation is a necessity to get a detailed overview of any area for civil engineering construction purpose. Precise determination of engineering geological properties is essential to plan for a proper design and successful construction for any civil engineering structure. The traditionally practiced conventional methods for the same are invasive, costly and time consuming. Electrical Resistivity Survey is an attractive tool for delineating subsurface geology without soil disturbance. Reliable correlation between electrical resistivity values and other field geological parameters can help in successful interpretation of the engineering properties and behavior of soil in evaluation of difficult terrains e.g. for obtaining hard rock position, obtaining continuity of rock strata and for knowing the position of various sub – stratifications. This has led to develop and put in practice the geophysical method of subsurface investigation for a more precise, economical and fast assessment of large areas like the present study area of Cauvery-Vaigai link canal project. The present paper presents the results of the use of Vertical Electrical Sounding coupled with Hydrogeological studies of the Cauvery-Vaigai-Gundar (CVG) link canal area. On the basis of generalized Vertical Electrical Soundings (VES) log it is seen that the aquifers in tertiary rocks are deep – seated, the depth varying from 80 to 300 m from the ground level. It was observed that the open wells are tapping unconfined aquifer system is highly weathered rock, moderately weathered/ fractured hard rock and highly fractured hard rock. The bore wells are tapping the confined aquifer system 40 m Below Ground Level (BGL) in highly fractured hard rock. The aquifers in the bore wells were reported to be in between 40 to 120 m BGL. Most of the bore wells are dry at present due to depletion of aquifer owing to very little precipitation and over exploitation. From resistivity survey it is inferred that where ever highly fractured hard rock are expected along the link, abundant quantity of ground water may be present there in that fractured zones. The result of resistivity values of different rock types of the area show resistivity of less than 20 ohm-m in the weathered soil, while highly fractured rocks show its range between 100 to 250 ohm-m, moderately fractured rocks shows range between 250 and 500 ohm-m and the massive crystalline rocks exhibit the range of more than 500 ohm-m. The water table shows periodical variations. During the excavation of the canal, the study of water table condition will give an idea about the chances of striking ground water to cut and cross drainage portions as ground water poses a serious hazard during the excavation works.
Geophysical survey is necessary to ascertain subsurface geological and hydrogeological conditions and helps to delineate regional hydrogeological features, even pinpoint locations for drilling of boreholes. Geophysical data provides information on local geological environment such as type and extent of surface material, extent an degree of weathered mantle, the nature and extent of underlying bedrock, the structural elements etc. that influence ground water occurrence and movement. The important geophysical method involved in ground water exploration is Geo - Physical prospecting.
The Pre Quaternary biostratigraphy and lithostatigraphy and environment of deposition and the associated tectonism in the Cauvery basin is well documented specially the Creataceous formations [1- 4]. The previous studies on Pre Quaternary sediments have only emphasized the depositional pattern and history in response to the basin tectonics and environment and not related it to the source region climate and tectonism. There is dearth of literature on the Quaternary geology of the Cauvery delta. The first comprehensive geological study of Cauvery river basin was done by Blanford of GSI in 1862. Most of the studies in this region is concentrated on Late Jurrasic to Mio-Pliocene sediments, with major emphasis on the Cretaceous sedimentary rocks [2,5,6]. They have built a detailed biostratigraphy for this period of sediments. Coming to the Quaternary the literature is almost missing except for some work done on sedimentology and geochemistry of surface sediments and channel suspended sediments more so to assess the solute load, nutrient and pollutant transfer by the river [7-10].
The river Cauvery branches off into a number of distributory rivers with its apex located at Grand Anicut (East of Trichy) and forms a triangular shaped delta. While the main Cauvery River flows in the North-eastern rim of the delta as river Coleroon, all its distributaries stand as paleochannels over which the rivers like Vennar, Vettar, Arasalar, Kudamurthi flow as misfit rivers [11]. Such abandoned nature of distributory channels and fluvial activity only in northern rim can suggest that entire Cauvery delta is an abandoned one. There has been lot of debate on the Quaternay tectonics in the Cauvery delta and associated changes in the landforms. Based on the morphological and land sat imagery study suggest northward migration of river Cauvery in the delta from the initial south-east course from Trichy to Bay of Bengal through Vedaranyam to present North-east course along Coleroon [12,13]. In the main Cauvery delta, the present day Cauvery flows in the northwestern rim of the delta as river Colleroon and all the distributary system of rivers, stand exposed as palaeo drainages over which the present day Vennar – Palamcauvery schemes of drainages are misfit. Occurrence of palaeo distributary system in the south with present day Cauvery (Colleroon) in the northern rim was attributed to anticlock wise rotational migration of Cauvery in its deltaic region related to the tectonic upliftment of Mio pliocene sandstone in Mannargudi - Pattukkottai region [11].
Electrical resistivity in support of Geological mapping has been well studied by Dale Rucker et al., [14] wherein the resistivity data was correlated to geological maps and to the data obtained by bore hole logging. Schepers et al., [15] have emphasized that Different geophysical methods have been used successfully to solve a number of special geotechnical problems.
The proposed work of Geophysical resistivity studies was undertaken to know the subsurface Lithology, texture, structure, and mechanical behavior of rock material respectively, and its application to the Project of Interlinking of Indian Rivers. The outcome of the study will be socially relevant because the Rivers have played a central role in Economic and Cultural development of any country but in India it is more than life, here Rivers is divine, River is Goddess.
The Cauvery - Vaigai - Gundar link project cover parts of Karur, Thiruchirapalli, Pudukkottai, Shivaganga, Ramanathapuram and Viruthnagar districts of Tamil Nadu. The Study area falling in parts of Survey of India degree sheets No. 58 I, 58 J, 58 M and 58 N bounded by latitudes 90 10’ 00” to 110 00’ 00” and longitudes 780 05’00” to 790 00’ 00” covering an area of 18,000 sq. km The link canal will off take from a proposed regulator located on the right bank of river Cauvery at the location upstream of the proposed Kattalai barrage. The off take falls within Krishnarayapuram taluk of Karur district in Tamilnadu (Annexure 1).
The rivers that would be crossed by the canal are Napalli, Koraiyar, Kondar, Vellar, Pambanar, Virisalar, Sarugani, Vaigai, Gridhamal, and Gundar. Command area of the link canal lie between north latitudes 9° 10′ 00″ to 11° 00′ 00″ and east longitudes 78° 05′ 00″ to 79° 0′ 00″. The entire link is enclosed in the parts of Survey of India Toposheets bearing Nos 58 J and 58 K of scale 1: 250000 in the districts of Karur, Tiruchchirappalli, Pudukkottai, Sivaganga, Ramanathapuram and Virudhunagar in Tamil Nadu.
Geology of the area
Precambrian crystalline rocks cover 80 percent of the terrain and Paleozoic sedimentary rocks cover the eastern costal terrain and the river valley account for the rest. In the deeply eroded Precambrian terrain rocks of the Khondalite and Charnockite Groups and migmatites derived from them are extensively traced within this west array of crystalline rocks, igneous emplacement of anorthosited, granites, ultramafic bodies and basic sills and dykes are defined. The geological setup of the Cauvery-Vaigai-Gundar link is as follows:
a) Quaternary sediments
b) Tertiary sediments
c) Granites
d) Migmatic rocks
e) Charnockites
Hydrogeology of the area
The hydrogeology parameters include noting the depth to water table, outcrops at surface, road cutting, pits, tunnels and well sections. The observations were carried out in the month of April to May. The water table ranges from 5 to 25 m BGL along the link. The link canal mostly passes through the draught prone area where rainfall is very scanty and hence at most places the water table is 15 m Below Ground Level (BGL). Most of the open wells are 10 to 12 m deep was found to be dry.
Profiling: The resistivity profiling is a technique to locate lateral variations in resistivity at a constant depth. Here the electrode configuration remains the same for the entire area and it is moved as a whole along a traverse, generally normal to the strike of the rock formations. This resistivity profiling is used as a semi-reconnaissance tool in the search of vertical structures with large resistivity contrasts such as faults, geological contacts, dykes, shear zones and veins. Electrode separation for profiling is chosen after conducting a number of vertical electrical soundings in an area. Based on these soundings, an optimum spacing is chosen for the required depth of investigation. Interpretation of resistivity profiling data is usually qualitative in nature. If we run a number of profiles in an area, we can even expect to find somewhat similar results and by joining these anomalies it is possible to support or otherwise the lineaments shown by the remote sensing method.
The sub-surface layers were interpreted using the graphs prepared from resistivity measurements coupled with geological and hydro geological observations. The sub-surface layers are classified on the basis of degree of weathering and fracturing, which are the essential engineering properties from the point of view of excavation of the material.
Vertical Electrical Sounding (VES): As part of the present investigations, detailed geophysical investigation has been carried out in the Cauvery- Vaigai Link Canal Project using the Schlumberger array at the selected locations. Current electrode spacing (AB/2) was gradually increased up to 100 m for delineation of deeper structures. Electrodes were spread in the direction parallel to strike direction. Over layered earth structures (1-D situation), variation in apparent resistivity with current electrode separations is quite smooth. Further, this variation is also smooth when the direction of spread is parallel to the strike and erratic when the direction of spread is perpendicular to the strike for 2-D situation. In the present study, a rather smooth variation in apparent resistivity is observed up to large electrode separations in the strike direction. Therefore, we assume that in such situation 1-D interpretation will yield significant subsurface features for recommending appropriate locations for civil engineering structures.
The vertical electrical soundings, otherwise known as electric drilling, depth sounding or depth probing, is used to determine the resistivity variation with depth and provide the information about the vertical distribution of fresh, brackish and saline water bodies if any and their aerial extent. A VES is typically carried out in Schlumberger array, where the potential electrodes are placed in fixed position with a short separation and the current electrodes are placed symmetrically on the outer sides of the potential electrodes (Figure 1). After each resistivity measurement the current electrodes are moved further away from the centre of the array. In this way the current is stepwise made to flow through deeper and deeper parts of the ground. The positions of the current electrodes are typically logarithmically distributed with at least 10 positions per decade. For large distances between the current electrodes, the distance of the potential electrodes is increased to ensure that the measured voltage is above the noise level and the detection level in the instrument. With the expansion of electrical array, the depth of penetration of electrical current is increased there by detailed information and the vertical succession of various conductive zones, their individual true resistivity and thickness can be obtained. Some of the most common electrode arrays are Wenner, Schlumberger, polepole, pole-dipole and dipole-dipole array.
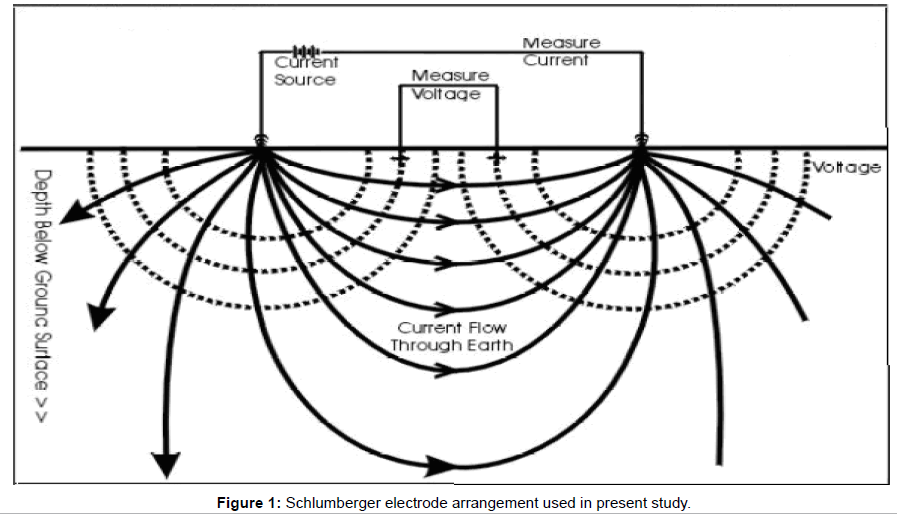
Figure 1: Schlumberger electrode a rrangement used in present study.
In reality, the subsurface ground does not conform to the homogenous medium and hence the resistivity obtained is ‘apparent resistivity’ (pa), rather than the ‘true resistivity’ (pt). Apparent resistivity values calculate from measured potential differences can be interpreted in terms of overburden thickness, water table depth, and the depths an thicknesses of subsurface strata. The apparent resistivity is obtained as the product of measured resistance(R) and geometric factor K, which depends on the geometric spread of electrodes.
pa= (AV/I) X K where AV is the measured potential, I is the transmitted current, and K, the geometrical factor .
The apparent resistivity values along the y-axis can be plotted against logarithmic value of current electrode half spacing along the xaxis to obtain apparent resistivity curves, which is also known as field curves. Further these field curves are interpreted by different techniques like curve matching, curve breaks etc to get the different layer parameters, such as, depth to water table, depth to basement topography, thickness of weathered layers, detection of fissures, fractures as well as fault zone and also the quality of ground water in terms of dissolved salt content. In the present study the curve matching techniques are used to interpret the field curves obtained. VES data together with the subsequent borehole information has helped us to compile the hydrogeological potential of the areas along the link
Singhal and Gupta et al., [16] have given a range of resistivity values of common rock/ materials under dry and saturated conditions and is shown in Table 1.
| Rock/Material | Almost Dry | Saturated with water |
|---|---|---|
| Quartzite | 4.4 × 10 3–2 × 10 8 | 50–500 |
| Granite | 10 3–10 8 | 50–300 |
| Limestone | 600–10 7 | 50–1000 |
| Basalt | 4 × 10 4–1.3 × 10 8 | 10–50 |
| Gneiss | 6.8 ×10 4–3 × 10 8 | 50–350 |
| Sand | 150–2 × 10 3 | 10–100 |
Table 1: Ranges of resistivity values (Q.m) of common rocks/materials [16].
In crystalline terrains, the maximum depth of penetration needed is to reach the compact rock (bed rock), usually having infinite resistivity. Infinitely, resistive basement is reflected in the sounding curves as an asymptote at the extreme right hand part, making an angle of 45° with the x–axis on the double log sheet. Survey will be stopped as soon as this asymptotic part of the curve is obtained. In resistivity survey, Vertical Electrical Soundings (VES) were conducted at 269 predetermined locations using Schlumberger electrode configuration, at the cut and Cross Drainage portions. The soundings were separated by a distance 1 km except at Cross Drainage portions, where it ranged from 100 to 200 meter. The maximum depth of penetration was 40 m at RD 105.000 km [17].
The interpreted resistivity data is correlated with the observed geological and hydro geological field data and the subsurface layers are classified into four categories as:
1. Soil
2. Highly weathered rock
3. Moderately weathered/fractured hard rock
4. Highly fractured hard rock
5. Hard rock
The top layer soil is mostly the deposited layer consisting of sand, gravels, pebbles etc. along with fine particles. The remaining layers are the highly weathered rock, moderately weathered and/or fact hard rock and hard rocks are the same type of rocks with differential weathering. Based on the resistivity, various layer boundaries are demarcated. The layer boundaries at each sounding is referred to the mean sea level in which the topographic level (NSL-Natural Soil Level) is as given by National Water Development Authority (NWDA) and the other layers are as per the depth of their occurrences. Sub surface lithological vertical cross sections are prepared for every 25 km length of the alignment. The layer continuity is drawn by interpolation of the boundaries of the same lithology between the successive sounding, which is prepared through computer graphics. The information in the vertical cross sections consists of surface topographic levels, lithological boundaries, water table sub-surface lithology, Canal Bed Level, Full Supply Level of the proposed alignment. Graphs showing pseudo resistivity section along the Cauvery-Vaigai-Gundar (CVG) Link Canal is enclosed.
The sub-surface vertical layer inferred from electrical resistivity survey, geological and for each 25 km of the link canal alignment. The contoured apparent resistivity pseudo section was produced from plots of VES points against electrode spacing. The pseudo section was generated using IP12 WIN software. The curves were interpreted qualitatively through visual inspection and quantitatively using IP12 WIN software. Interpreted results were used to construct geo-electric section from the layered parameters. The field curves show three, four and five to six layers case. Most of the curves indicate multiple increase and decrease of resistivity with depths.
This graphical information gives an idea about the type of rock formation likely to be encountered at cut and Cross Drainage portions and the volume of the different type of material to be excavated along the alignment. From resistivity survey it is inferred that where ever highly fractured hard rock is expected along the link, abundant quantity of ground water may be present there in those fractured zones. The water table shows periodical variations. During the excavation of the canal, the study of water table condition will give an idea about the chances of striking ground water at cut and Cross Drainage portions as ground water poses a serious hazard during the excavation works. During the survey, over exploitation was observed at some places, where the shallow and deep aquifers are in good health. Some bore wells were also observed near the alignment, whose depths are ranging from 40 to 120 m BGL.
In the study area, shallow ground water aquifers occurs in alluvial plains, palaeochannels and the depth of the water table in the aquifers shows seasonal changes from about 2 to 7 m from the ground level. The aquifers in tertiary rocks are deep – seated, the depth wearying from 80 to 300 m from the ground level. It was observed that the open wells were tapping unconfined aquifer system in highly weathered rock, moderately weathered/fractured hard rock and highly fractured hard rock. The bore wells are tapping the confined aquifer system 40 m BGL in highly fractured hard rock. The aquifers in the bore wells were reported to be in between 40 to 120 m BGL. Most of the bore wells are dry at present due to depletion of aquifer owing to very little precipitation and over exploitation.
Analysis of four layer curve shows that, potential fracture zones occur in this type of resistivity profile. The first layer is top soil and second layer is saturated shallow aquifer, the third layer is basement rock and fourth is the fracture zone. Mostly in five layer cases, the fracture zone occurs as the fourth layer. In the six layer case, the first layer is top soil, the second layer is dry unsaturated zone, the third is saturated and the fourth layer is massive rock followed by fracture zone. In the seven layer case, the shallow saturated zone occurs as third layer. The fracture zone occurs as sixth layer. The above analysis show that fracture zone occurs in various depths in different type of resistivity profile. The areas where apparent resistivity are low in the fourth, fifth and sixth layers have high groundwater potential. Vertical Electrical Sounding (VES) locations show that most of the VES’s near the lineament intersections has very good groundwater potential. It is can be concluded that the potential aquifers in the area are mainly the fracture zones, faults, joints and weathered column and it is under confined to semi-confined condition.
The top layer soil is mostly the deposited layer consisting of sand, gravels, pebbles etc. along with fine particles. The remaining layers are the highly weathered rock, moderately weathered and/Fractured hard rock and hard rocks are the same type of rocks with differential weathering. Based on the resistivity, various layer boundaries are demarcated. The layer boundaries at each sounding are referred to the mean sea level and the other layers are as per the depth of their occurrences. Sub surface litho logical vertical cross sections are prepared for 255 km length of the alignment. The main geological formations observed in the study area are metamorphic hard rock and the remaining stretch is dominated by sedimentary domain consisting of sand, clay and shale, capped by laterite. In metamorphic terrain, top soil and weathered migmatitic gneiss form the media. The sedimentary formations consisting of sand and clay exposed in canal route appear to have poor shear strength. In general, no adverse geological features are noticed along canal alignment, as seen by the present study.
The economy of any project depends upon the quality of the preliminary investigations carried out. The findings generated through this study will give a new insight to researchers in the interpretation of the foundation conditions and will facilitate the design of appropriate foundation systems. The results depicted in the vertical cross sections show the surface topographic levels, lithological boundaries, water table, sub-surface lithology, Canal Bed Level (CBL), and Full supply level (FSL) of the proposed alignment. The sub-surface section of the link is prepared from the data obtained by electrical resistivity survey and geological survey done by the author along the link canal alignment.
As seen from the present study the area is mainly underlain by Charnockite/Charnockite gneiss type formations. This rock type is generally massive and does not store or transmit considerable quantity of water except there are any fractures or joints in it. The Geomorphological map reveals the landforms in the study area which mainly are structural hills, pediplain, less dissected plateau, channel bar, water bodies and valley fill. Among these, Valley fills have the maximum groundwater potential. Slope map shows that steeper slopes in the southern and north eastern part of the study area. Drainage pattern of the basin is influenced by infiltration properties of soil; more is the drainage density lesser the infiltration. Interpretation of VES data gives the details of the underlying fracture zone and thickness of the potential fractured layers. Qualitative interpretation of VES data shows multi layered resistivity profiles for most of the locations (mare than four layers). The pseudosection of measured apparent resistivities as enclosed in Annexure 2 reveals that the values change both horizontally and vertically, although a general increase in the values with depth is expected. At some places, irregular topography between the top heterogeneous ground and the underlying material is observed which may be due to slight variation in lithology or to the weathering of rocks which gives higher resistivity values and indicates that soil is more compacted (128 ohm to 300 ohm) and has less moisture content than the rocks of surrounding areas. The study area has shallow ground water aquifers in alluvial plains and in palaeochannels of the rivers. The depth of the water table in the aquifers shows seasonal changes ranging from 2 to 7 m from the surface level. The aquifers present in the tertiary rocks are deep – seated, and their depth varying from 80 to 300 m from the ground level. It was observed that the open wells were tapping unconfined aquifer system in highly weathered rock, moderately weathered/fractured hard rock and highly fractured hard rock. In addition to this, the bore wells are tapping the confined aquifer system 40 m Below Ground Level in highly fractured hard rock. The aquifers in the bore wells are found to be in between 40 to120 m Below Ground Level. Most of the bore wells are dry at present due to depletion of aquifer owing to very little precipitation and over exploitation, but most of the time, under the sufficient rate of precipitation, the bore wells and dug wells yields good amount of water. The geomorphological characters of the landscape are helping for the additional recharge of the groundwater in this area.
Based on the above studies it is finally suggested that for a huge project like Interlinking of Rivers in India in the present study area of Cauvery-Vaigai-Gundar Link Canal Project, for construction purpose the material like soil/alluvium (including all types of gravel, pebbles, and boulders) should be excavated either manually or by machines. The highly weathered rock material should be excavated either manually or by machines. The material like moderately weathered hard rock is to be excavated either by chiseling or by blasting and the hard rock material should be excavated by blasting.