Journal of Geology & Geophysics
Open Access
ISSN: 2381-8719
ISSN: 2381-8719
Research Article - (2022)
Gold for its high resistance to chemical reaction, high conductivity and ductility, and its rarity has been one of the most sought-after commodities for at least 7000 years and geophysical techniques (gravity, magnetics and electrical methods) have been widely used to get subsurface information of the Earth, without engaging in invasive digging. The geophysical evaluation of gold mineralization potential in parts of Minna has been carried out using three (3) principal geophysical techniques; Vertical Electrical Sounding (VES), Horizontal Resistivity Profiling (HRP), and Electrical Resistivity Tomography (ERT), with Schlumberger, Wenner and dipole-dipole electrode configuration respectively. These result of the analysis of the data obtained revealed a resistivity variation ranging from 20-75 Ωm in different parts of the study area. Also, it indicates a mineralized body that is discontinuous and irregular. The mineralized body is inferred to be gold as a result of the artisanal mining activities ongoing in the study area. The three (3) approaches classify the gold as shallow deposits as they exist between 0.8 m to less than 5 m deep in most cases because of this, they are easily eroded along the surrounding stream and river, and hence, the investigated area could be categorized as alluvia deposits. The resistivity data have been able to delineate a NE-SW trending anomalous zones that is parallel to the regional foliations which is consistent with the auriferous quartz vein exposed by the artisanal gold workings.
Gold; Geophysical techniques; Artisanal mining; Minna
Throughout history, gold has been exceedingly valuable due to several qualities. Its luminance, attractive color, durability, ductility, malleability, high conductivity and resistance to chemical reaction and its rarity has made it highly sought-after. In many areas around the world, gold mineralization is structurally controlled and usually associated with faulted, fracture zones, joints, dyke or major veins/ rock boundaries and many often times as a product of highly weathered geologic material that are subsequently eroded into streams, rivers and are often described as alluvia/alluvium deposits [1-3]. However, in humid tropical settings, where weathering processes are intense and there are deep lateritic soil profiles, exploration efforts are usually hampered by the non-exposure of outcrops, vegetation cover an extensive alteration of truncated lateritic soil profiles. Recent alteration and reworking of the soil profile by surface processes, often results in extensive modification and or complete alteration of the primary chemical and vegetative features of the top soil and thereby making delineation of the depth of ores/minerals bodies cumbersome and this is typical of the study area therefore only geochemical analysis cannot be effectively used in locating deeply embedded and hidden mineralized primary ore bodies (often referred to as blind ore bodies) and so there is need to integrate multi-disciplinary analysis such as geophysical techniques. Geophysical techniques (gravity, magnetics, and electrical methods) have been widely used to get subsurface information of the Earth, without engaging in invasive digging [4]. This helps to solve many problems associated with gold exploration usually as gold has excellent electrical conductivity, making it possible to target them using geoelectrical exploration methods and thus dipole-dipole, horizontal resistivity profiling and Vertical Electrical Sounding were employed in this study to delineate the depth of auriferous ore bodies in parts of Minna area where artisanal mining activities is currently ongoing. The combination of these electrical methods has shown to be a powerful tool in obtaining an overview of the depths to the auriferous ore body.
Location and geology
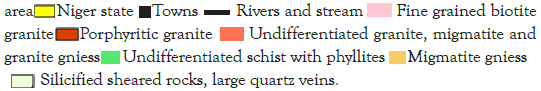
The study area (Figure 1) is part of the Kushaka schist belt of Northwestern Nigeria [5]. Minna is underlain by rocks belonging to the Basement Complex system of Nigeria, these comprises the migmatite-gneiss complex, the Older Granite and schist belt. The basement complex of Nigeria is part of the Neoproterozoic to early Phanerozoic terrain separating the West Africa and Congo Craton. This vast terrain consist of reactivated older crust in which Archaean (ca 2700 Ma) and Paleoproterozoic (ca 2000 Ma ) isotopic ages have been recorded [6].

Figure 1: Geologic map of Minna showing the study area. 
In this study, three electrical resistivity techniques were used, namely; Vertical Electrical Sounding (VES), 2-D Electrical Resistivity Tomography (ERT) and Horizontal Resistivity Profiling (HRP). Omega resistivity meter was used to acquire 1D electrical resistivity data in the study area for gold prospect. Vertical electrical soundings (VES) and Horizontal Resistivity Profiling (HRP) methods were adopted to obtain apparent resistivity in which the data generation and recording were automatically provided by the resistivity meter. Dipole-dipole and Wenner and Schlumberger array configuration were used for 2-D Electrical Resistivity Tomography (ERT), Horizontal Resistivity Profiling (HRP) and Vertical Electrical Sounding (VES). Fifteen (15) sounding stations were occupied along the three traverses i.e. five in each traverse (Figure 2), and the current electrode spacing (AB/2) was varied from 1 to 100 m.

Figure 2: Data acquisition map of the study area.

The electrical resistivity data; the apparent resistivity values were plotted against the electrode spread (AB/2). This was subsequently interpreted quantitatively using the partial curve matching method and computer-assisted 1-D forward modeling with WinResist 1.0 version software. The dipole-dipole data were inverted using the DIPPRO™ 4.0 inversion software. The inter-electrode spacing of 5 m was adopted while inter-dipole expansion factor (n) was varied from 1 to 5. Horizontal Resistivity Profiling (HRP) techniques was taken at a=5, 10, 15, and 20 m which give useful information on the nature and trends of the sub-surface and structural trends and the data obtained were inverted using the Resis2D software. The results from the three techniques were integrated together to evaluate the depth of gold mineralization.
Electrical resistivity tomography using dipole-dipole configuration
In the dipole–dipole array, the space between current electrodes and potential electrodes are equal and the two current electrodes (AB) are kept fixed while the potential electrodes (MN) are moved collinearly to the current ones. The spacing between current electrodes and potential electrodes is a multiple of the electrode spacing. The depth of penetration is a function of spacing and the dipole separation factor (n). The processing and interpretation of the obtained data have been done using computer-assisted 1-D forward modeling with WinResist 1.0 version software. The 2-D inversion model consists of a number of rectangular cells. The arrangement of the cells approximately follows the distribution of the data points in the apparent resistivity pseudo-section. The regularized least-squares optimization method with cell-based model is sufficiently flexible to represent almost any subsurface structures with an arbitrarily resistivity distribution [7]. The 2D resistivity image of the study area exhibits variation of resistivity values corresponding to the lateral variation in the subsurface lithological units. The inverted models of the 3 sections indicates that the subsurface consists of different geologic units which are used in delineating the depth of the gold deposit which is believed to be of a shallow (near surface) occurrence of about 3 m deep and concentrated within the lateral extent between 20-70 m with resistivity variation ranging between 20-75 Ωm. Also, the dipole- dipole section (Figures 3-5) between distances of about 40-50 m reveals a major weak zone which may be responsible for pockets of gold mineralization in the study area [8].

Figure 3: Dipole-Dipole pseudo section along traverse one.

Figure 4: Dipole-Dipole pseudo section along traverse two.

Figure 5: Dipole-Dipole pseudo section along traverse three.
Horizontal Resistivity Profiling (HRP) using wenner electrode array
The horizontal resistivity profiling (Figures 6-8) gives information about the sub structural settings of the auriferous gold deposits in the study area. Three (3) horizontal resistivity profiles with spacing of 5 m, 10 m, 15 m and 20 m were investigated and these shows that the gold deposits were concentrated mainly between distances of 15-40 m, 35-58 m, and 35-58 m along the profile for transverses 1, 2 and 3 respectively, also the resistivity variation ranges from 20- 70 Ωm, 20-99.4 Ωm and 20-99.7 Ωm respectively for transverses 1, 2 and 3. The findings from this approach show that the depth of the gold deposit is shallow (i.e. less than 6 m) (Figures 9-11).

Figure 6: Horizontal Resistivity Profiling (HRP) along traverse one.

Figure 7: Horizontal Resistivity Profiling (HRP) along traverse two.

Figure 8: Horizontal Resistivity Profiling (HRP) along traverse three.

Figure 9: Geoelectric section along traverse one. 


Figure 10: Geoelectric section along traverse two. 


Figure 11: Geoelectric section along traverse three. 

Vertical Electric Sounding (VES) using schlumberger array
Fifteen (15) Vertical Electrical Sounding (VES) probing carried out using Schlumberger configuration. Spacing range is from 0.5 m to 25 m. The geoelectrical cross section indicates that the gold in the study area is of shallow depth (i.e. less than 5m) and the subsurface sections consist of mostly five geologic units comprising of top soil, lateritic layer, clay, partially weathered basement and weathered basement.
Overburden Thickness Map (Figure 12) displays the overburden thickness map of the study area showing maximum overburden thickness of 7.8 m around the northern part. Areas around the south and southeastern parts of the study area have a thin/shallow overburden thickness and this is the region where the presence of gold mineralization is conspicuous and most probably is the basis for shallow lying gold mineralization within the study location. Therefore, this accounts for the local mining activities evident within the area. Depth map of the study area (Figure 13) reveals that the maximum depth to auriferous veins in the study area is 0.8 m at the northern part. Areas around the south, southeastern and southwestern parts of the study area have a very near surface depth to auriferous vein.

Figure 12: Map showing depth to basement in the study area.

Figure 13: Map showing depth to auriferous veins in the study area.
Geological field work on the study area revealed an intercalation of laterite and clay belonging to different geological formation with clays and layers of weathered schist into clay defining the active zone of deposition while the geoelectrical evaluation which include ERT, VES, and HRP established a shallow/low depth of the auriferous veins with the active region existing between 50 m to the end of western region of the study area. The highly weathered clayey schist most of which is eroded as regolith into the adjoining River Rafin Gora contributes the auriferous stream sediments providing materials for the artisanal gold miners.
The authors declare that they have no conflicts of interest regarding the publication of this research work.
Citation: Ogor W (2022) Application of Electrical Resistivity in Delineating Depth of Auriferous Veins in Parts of Minna, North-Central Nigeria: Implication for Gold Exploration. J Geol Geophys. S4:001.
Received: 04-Mar-2022, Manuscript No. JGG-22-16196; Editor assigned: 10-Mar-2022, Pre QC No. JGG-22-16196 (PQ); Reviewed: 24-Mar-2022, QC No. JGG-22-16196; Revised: 29-Mar-2022, Manuscript No. JGG-22-16196 (R); Published: 05-Apr-2022 , DOI: 10.35248/2381-8719.22.S4.001
Copyright: © 2022 Ogor W. This is an open-access article distributed under the terms of the Creative Commons Attribution License, which permits unrestricted use, distribution, and reproduction in any medium, provided the original author and source are credited.