Journal of Geology & Geophysics
Open Access
ISSN: 2381-8719
ISSN: 2381-8719
Research Article - (2016) Volume 5, Issue 6
Integrated geophysical investigation involving Electrical Resistivity (ER) and Ground Penetrating Radar (GPR) techniques were carried out around a site underlined by Basement Complex rocks of southwestern Nigeria. The study was aimed at imaging the subsurface lithological units and delineating shallow geologic structures for the purpose of characterizing the area for construction suitability. A total of twenty five (25) Vertical Electrical Sounding (VES) data using Schlumberger array, ten (10) traverses of Electrical Resistivity Imaging (ERI) using Wenner array and Ground Penetrating Radar (GPR) surveys were carried out along the established traverse lines within the area. The VES data were quantitatively interpreted using partial curve matching technique and subsequently improve upon by inversion software using IPI2Win, to obtain the layer geoelectric parameters. The ERI data was inverted and interpreted using Res2Dinv and Res3Dinv inversion software’s respectively to generate 2D and 3D resistivity image of the subsurface. The GPR data was processed into radar section using RadExplorer software. Vertical electrical sounding results delineates typically three to four geologic layers which are the topsoil/lateritic hardpan, weathered basement (consisting clay and sandy clay) and fractured/fresh basement with layer resistivity value ranges of 10-2684 Ωm, 12-242 Ωm and 229-3213 Ωm respectively and thickness value ranges of 0.5-2.1 m and 4.0-14.1 m respectively. 2-D inverted resistivity results also delineated three major geologic layers which are the topsoil, weathered basement and fresh basement and correlates well with the results obtained from the VES results. Layers 1 to 3 of 3D inverted resistivity slice results show high degree of variation in resistivity distribution at shallow depth, consisting of highly resistive material towards the eastern part with low resistivity material concentrating at the south-western part. Results of the GPR survey also delineated three to four geologic layers which include the topsoil/lateritic hardpan, weathered basement and fractured/ fresh basement. The study area was categorized to have semi-competent to competent basement rock based on the resistivity value of the underlying material within the area. Bedrock depression delineated at some location could pose threat of differential settlement to construction works within the study area. Thus, it should be ensured that foundation is designed to sit comfortably on the competent bedrock or by employing suitable foundation work, such as piling to ensure foundation stability and prevent structural failure. Thus, electrical resistivity and ground penetrating radar techniques are versatile tools in site characterization.
Keywords: Subsurface, Topsoil, Bedrock, Seismic refraction, Amplitude
The increasing rate in failure of structures such as road, buildings, dam and bridges has assumed an alarming dimension [1]. The need for pre-foundation studies has therefore become imperative before any structure is laid so as to prevent loss of lives and also goods and properties. Some earth materials such as sands and fresh rock provide firm support for solid foundation while other host material due to their nature cannot support solid and rigid structures [2]. Such improperly sited structures have failed due to lateral and vertical inhomogeneity in the subsurface earth materials [3-5]. Such fallout can however be prevented when necessary information aimed at better understanding the subsurface geometry and structural setting is available [6]. Geophysical investigation is one of the methods used in probing the subsurface for any construction activities. The deduced soil characteristics are used as preliminary information to determine the suitability of the site for a proposed structure. If this crucial step is omitted, concealed geologic features within the subsurface may precipitate excessive total or differential settlement leading to failure or collapse of structures [7]. Geophysical methods that have been found useful in pre-and post-construction geotechnical investigations include Electrical Resistivity, Seismic Refraction and Electromagnetic methods including the Ground Penetrating Radar (GPR) among others [1,6,8,9]. The main objective of this work was to investigate subsurface stratigraphic and structural setting of the study area and to define its competency for construction purposes using Electrical Resistivity and Ground Penetrating Radar methods.
Site description and geological setting
The study area, Ajibode is located in the North central part of Ibadan, southwestern Nigeria with Latitudes 7°28’32.6″ and 7°28’36.6″ North of the Equator and Longitudes 3°53’20.7″ and 3°53’25.3″ East of the Greenwich Meridian (Figure 1). It shares boundaries with the University of Ibadan and Orogun communities at the south and at the north with IITA, Ojoo and Shasha communities of Ibadan. The geology of the study area, Ibadan is the subset of the geology of the southwestern part of Nigeria. The dominant rock types in this region are granite, quartz schist of metasedimentary series, banded gneiss, granite gneiss, augen gneiss and migmatite complex. Quartzite outcrops as ridges with relatively high elevation with schistose structure. The strike line runs in the N-S direction between 340 and 350° consistently dipping eastwards with characteristic cross-cutting features [10], with dip angle of 47°E and characterized by joints and faults in some cases [11]. Field investigations of Ajibode area showed three main rock types which are banded gneiss, granite gneiss and augen gneiss [12] with the presence of fractures along the general strike of the rock (Figure 2). Banded gneiss occurs at the extreme east and west running south-east of the study area. The general strike of banded gneiss is NNW-SSE while the dips range from 42° to 53° East. The rock is medium grained, crystalline and contorted. The study area is well drained by river Ona and its tributaries. The drainage pattern is dendritic with irregular branching in all directions. The river flows in the southwestern direction and forms the boundary between the University of Ibadan campus and Ajibode village in the northern part.
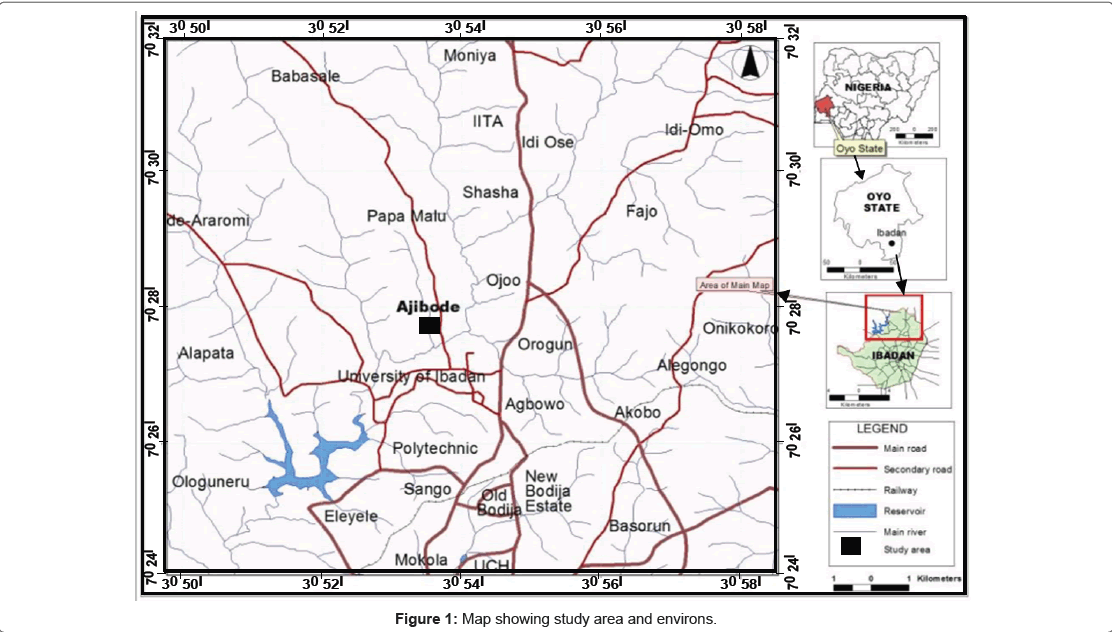
Figure 1: Map showing study area and environs.
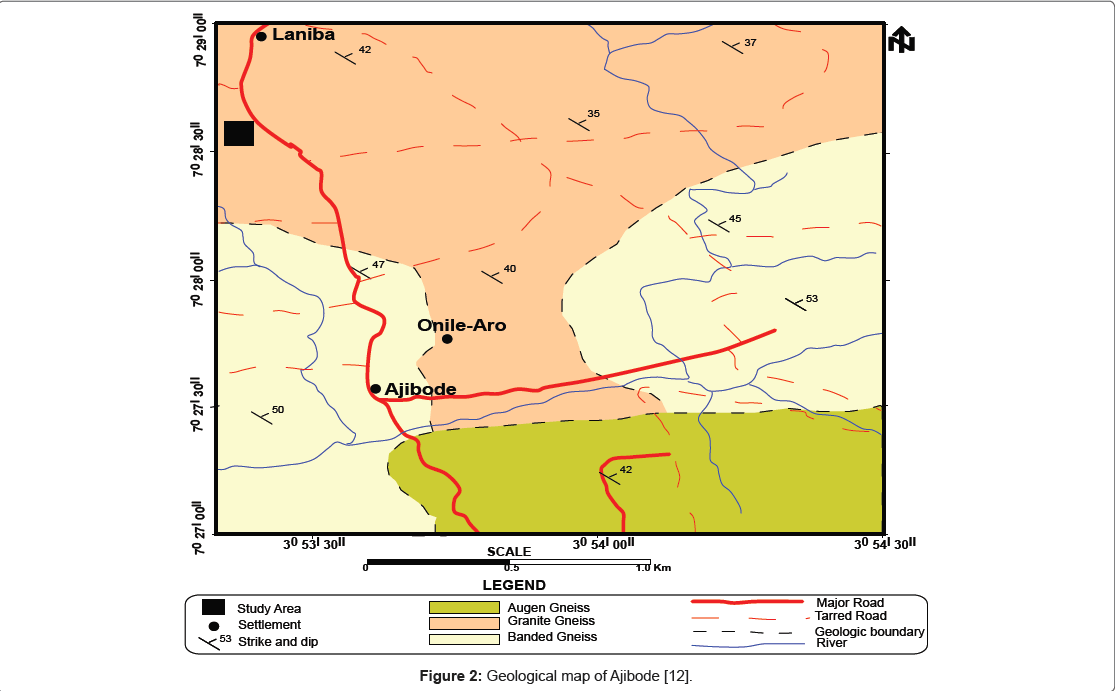
Figure 2: Geological map of Ajibode [12].
A total of ten (10) traverse lines were obtained with five (5) lines each in approximately NW-SE and NE-SW directions along which Electrical Resistivity and Ground Penetrating Radar data were acquired (Figure 3). Vertical Electrical Sounding (VES) data was acquired using Schlumberger electrode array. A total of twenty five (25) VES stations were occupied with each located at the grid points of the traverse line within the study area. The spread length of current electrode ranges from 1.0 up to 100 m in successive steps. Wenner array was employed for Electrical Resistivity Imaging (ERI) with spacing between adjacent electrodes represented by ‘a’, all the possible measurement made with Wenner array is of electrode spacing of “na” where n=1, 2….5 and ‘a’=5 m. GPR data was acquired using “Mala RAMAC/GPR” geophysical survey equipment. The equipment consists of radar antennae housed in a box attached to the survey wheel which rolled along the traverse lines. The box was connected to the computer monitor unit which automatically recorded and store the data as the survey wheel is being moved across the study area. The survey was carried out using two different antenna frequencies (250 MHz and 500 MHz) with antenna separation of 0.36 m and 0.18 m respectively. The start and end time ranges between 168-210 ns and 0-100 ns respectively for both 250 MHz and 500 MHz antenna frequencies and the mode of constant component is taken as “mean”. The direct wave velocities were recorded as 30 cm/ns and the operation length as 52 ns for both frequencies. The GPR data positioning was calibrated using survey wheel.
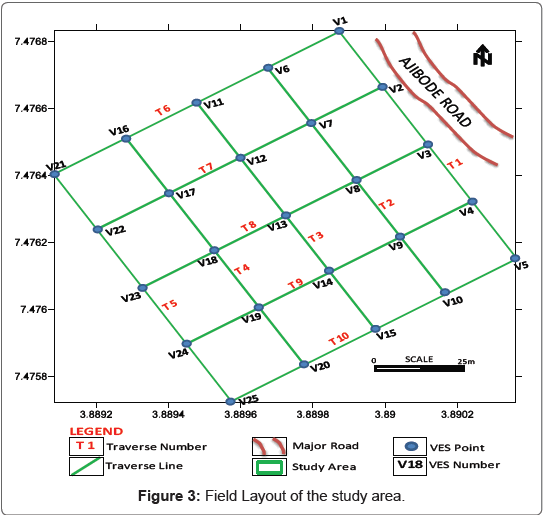
Figure 3: Field Layout of the study area.
Vertical Electrical Sounding data were interpreted by partial curve matching technique [13] with the result of the layer resistivity parameters derived from the partial curve matching technique being used as the initial interpretation of the field curves for the computer inversion using IPI2Win software. Forward inversion modeling technique using regularized least-square optimization method [14] of Res2Dinv and Res3Dinv inversion software’s were used in the interpretation of the 2D and 3D data. GPR data was processed using “RadExplorer V1.4 [15] software” package which is commercially available. The processing parameters applied, as made available by the software and that which gives acceptable result on the radargram includes: DC removal, Time zero adjustment, Bandpass filtering and Amplitude correction.
Vertical electrical sounding results
Quantitative interpretation of the VES curves resulted in determination of geoelectric layer parameters (layer resistivity and thickness) for the subsurface characterization. Based on the approximate range of resistivity values of common rock types [16] and correlation with the pit information (having lithology ranging from topsoil/lateritic hardpan-weathered basement-basement rock) within the study area, three major geologic layers were delineated from the geoelectric layer parameters obtained from the study area (Figure 4) and these includes the topsoil/lateritic hardpan, weathered basement (clayey/sandy clay) and fractured/fresh basement. A summary of the VES interpretation is shown on Table 1.
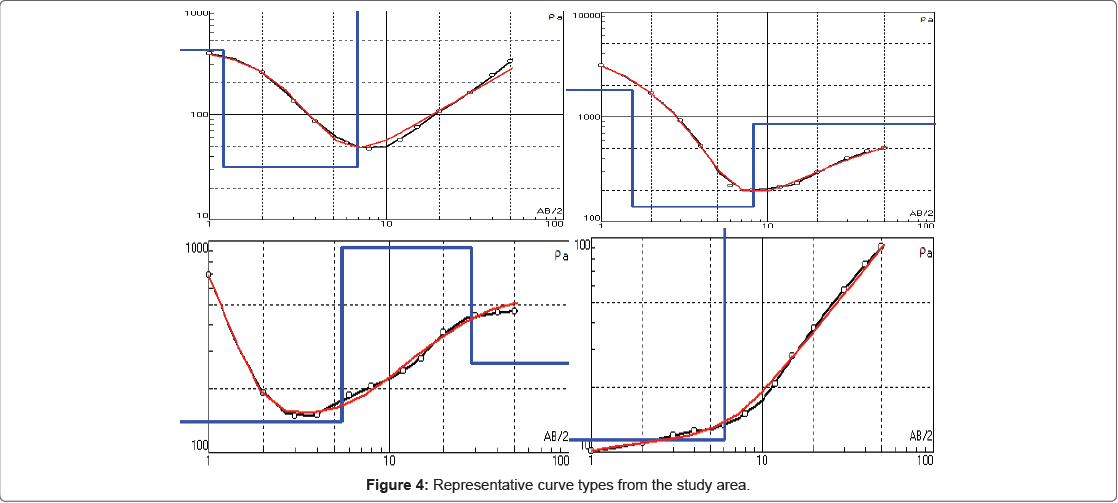
Figure 4: Representative curve types from the study area.
| VES Station | Layer | Resistivity | Thickness | Depth | Lithology | Curve |
|---|---|---|---|---|---|---|
| (?m) | (m) | (m) | Type | |||
| 1 | 1 | 761 | 1.4 | 1.4 | Topsoil | H |
| 2 | 77 | 9.3 | 10.7 | Weathered basement (Clayey) | ||
| 3 | 1711 | - | - | Fresh basement | ||
| 2 | 1 | 1013 | 1.1 | 1.1 | Topsoil | QH |
| 2 | 133 | 3.4 | 4.5 | Sand clay | ||
| 3 | 20 | 10.8 | 15.2 | Weathered basement (Clayey) | ||
| 4 | 360 | - | - | Partly weathered basement | ||
| 3 | 1 | 719 | 1.6 | 1.6 | Topsoil | H |
| 2 | 45 | 4.9 | 6.5 | Weathered basement (Clayey) | ||
| 3 | 3213 | - | - | Fresh basement | ||
| 4 | 1 | 565 | 1.1 | 1.1 | Topsoil | H |
| 2 | 49 | 7.2 | 8.3 | Weathered basement (Clayey) | ||
| 3 | 1103 | - | - | Fresh basement | ||
| 5 | 1 | 913 | 1.5 | 1.5 | Topsoil | H |
| 2 | 60 | 7.3 | 8.8 | Weathered basement (Clayey) | ||
| 3 | 1026 | - | - | Fresh basement | ||
| 6 | 1 | 1827 | 1.2 | 1.2 | Topsoil (lateritic hardpan) | H |
| 2 | 94 | 13 | 14.2 | Weathered basement (Clayey) | ||
| 3 | 726 | - | - | Fresh basement | ||
| 7 | 1 | 1772 | 1.3 | 1.3 | Topsoil (lateritic hardpan) | QH |
| 2 | 233 | 2.7 | 4 | Sandy clay | ||
| 3 | 53 | 7.7 | 11.7 | Weathered basement (Clayey) | ||
| 4 | 555 | - | - | Fresh basement | ||
| 8 | 1 | 2684 | 1.1 | 1.1 | Topsoil (lateritic hardpan) | QH |
| 2 | 182 | 1.9 | 3 | Sandy clay | ||
| 3 | 94 | 4.5 | 7.4 | Weathered basement (Clayey) | ||
| 4 | 992 | - | - | Fresh basement | ||
| 9 | 1 | 1362 | 1.1 | 1.1 | Topsoil (lateritic hardpan) | QH |
| 2 | 281 | 2.6 | 3.7 | Sandy clay | ||
| 3 | 56 | 7.6 | 11.3 | Weathered basement (Clayey) | ||
| 4 | 1162 | - | - | Fresh basement | ||
| 10 | 1 | 1280 | 1.3 | 1.3 | Topsoil (lateritic hardpan) | H |
| 2 | 76 | 7 | 8.3 | Weathered basement (Clayey) | ||
| 3 | 1803 | - | - | Fresh basement | ||
| 11 | 1 | 2613 | 1.1 | 1.1 | Topsoil (lateritic hardpan) | H |
| 2 | 81 | 6.4 | 7.4 | Weathered basement (Clayey) | ||
| 3 | 1419 | - | - | Fresh basement | ||
| 12 | 1 | 1927 | 1.2 | 1.2 | Topsoil (lateritic hardpan) | QH |
| 2 | 200 | 1.6 | 2.8 | Sandy clay | ||
| 3 | 60 | 6.8 | 9.6 | Weathered basement (Clayey) | ||
| 4 | 558 | - | - | Fresh basement | ||
| 13 | 1 | 2541 | 1.3 | 1.3 | Topsoil (lateritic hardpan) | QH |
| 2 | 267 | 2 | 3.2 | Sandy clay | ||
| 3 | 69 | 7.8 | 11 | Weathered basement (Clayey) | ||
| 4 | 457 | - | - | Fractured basement | ||
| 14 | 1 | 2011 | 1.2 | 1.2 | Topsoil (lateritic hardpan) | QH |
| 2 | 133 | 2.1 | 3.3 | Sandy clay | ||
| 3 | 70 | 6.5 | 9.8 | Weathered basement (Clayey) | ||
| 4 | 607 | - | - | Fresh basement | ||
| 15 | 1 | 1294 | 0.8 | 0.8 | Topsoil (lateritic hardpan) | H |
| 2 | 87 | 14 | 14.8 | Weathered basement (Clayey) | ||
| 3 | 752 | - | - | Fresh basement | ||
| 16 | 1 | 2209 | 1 | 1 | Topsoil (lateritic hardpan) | QH |
| 2 | 165 | 1.6 | 2.6 | Sand clay | ||
| 3 | 20 | 7.8 | 10.3 | Weathered basement (Clayey) | ||
| 4 | 771 | - | - | Fresh basement | ||
| 17 | 1 | 269 | 0.7 | 0.7 | Topsoil | H |
| 2 | 25 | 8.4 | 9.2 | Weathered basement(Clayey) | ||
| 3 | 584 | - | - | Fresh basement | ||
| 18 | 1 | 436 | 0.8 | 0.8 | Topsoil | H |
| 2 | 29 | 9.4 | 10.2 | Weathered basement (Clayey) | ||
| 3 | 229 | - | - | Fractured basement | ||
| 19 | 1 | 1242 | 1.5 | 1.5 | Topsoil (lateritic hardpan) | H |
| 2 | 91 | 8.8 | 10.3 | Weathered basement (Clayey) | ||
| 3 | 397 | - | - | Fractured basement | ||
| 20 | 1 | 952 | 0.5 | 0.5 | Topsoil | HA |
| 2 | 51 | 1 | 1.6 | Weathered basement (Clayey) | ||
| 3 | 242 | 6.4 | 8 | Partly weathered basement | ||
| 4 | 777 | - | - | Fresh basement | ||
| 21 | 1 | 1860 | 1.1 | 1.1 | Topsoil (lateritic hardpan) | H |
| 2 | 35 | 4 | 5.1 | Weathered basement(Clayey) | ||
| 3 | 1934 | - | - | Fresh basement | ||
| 22 | 1 | 234 | 0.9 | 0.9 | Topsoil | H |
| 2 | 25 | 6.2 | 7.1 | Weathered basement (Clayey) | ||
| 3 | 1192 | - | - | Fresh basement | ||
| 23 | 1 | 10 | 2.1 | 2.1 | Topsoil (Water saturated) | A |
| 2 | 54 | 7.6 | 9.8 | Weathered basement (Clayey) | ||
| 3 | 561 | - | - | Fresh basement | ||
| 24 | 1 | 139 | 0.8 | 0.8 | Topsoil | HA |
| 2 | 12 | 2.1 | 2.9 | Weathered basement (Clayey) | ||
| 3 | 162 | 3.1 | 6.1 | Partly weathered basement | ||
| 4 | 1419 | - | - | Fresh basement | ||
| 25 | 1 | 119 | 0.7 | 0.7 | Topsoil | HA |
| 2 | 17 | 1.8 | 2.5 | Weathered basement (Clayey) | ||
| 3 | 158 | 3.1 | 5.6 | Partly weathered basement | ||
| 4 | 1474 | - | - | Fresh basement |
Table 1: Summary of the VES interpretation from the study area.
Electrical resistivity imaging results
2D Wenner data results were presented as an inverted model resistivity section representing the image of the subsurface along each established traverse line within the study area. This shows both lateral and vertical variations in resistivity of the subsurface material. The 2D inverted resistivity sections generated along NW-SE and NESW (Figure 5) respectively within the study area delineated three major subsurface layers which are; the topsoil, weathered basement and basement rock. The inverted resistivity model section delineated topsoil layer with high degree of variations in resistivity value ranging between 10 and 1000 Ωm and layer thickness of approximately 3.5 m. Some areas of the topsoil have high resistivity value and are presumed to be dominated by lateritic hardpan material (T3, T7 and T8). The topsoil is underlined by a conductive material characterized by ?100 Ωm resistivity which shows typically a clay-rich material and similar to the range established for similar geological provinces by Kearey et al. [16]. The thickness of the second layer ranges from 2-8 m, but could not be ascertained beneath some of the traverse lines as it forms depression into the basement. Such depressions were noticed beneath traverse line T3, T7, T8 and T10. The depressions are noticed at horizontal distance 35-45 m beneath traverse lines T3 and T7, between horizontal distance 35 and 60 m beneath T8 and at horizontal distance 40-55 m beneath T10. The weathered layer is underlined by basement rock with characteristic resistivity value of about 200 - 9036 Ωm. The depth to competent basement rock delineated by 2D inverted resistivity results within the area is approximately about 11 m, but could not be ascertained beneath regions where the weathered basement forms depression into the basement. Inverted resistivity section for traverse lines T3, T5, T7, T8 and T10 (Figure 5) generally show a continuous trend of depression into the basement which cut across the traverse lines.
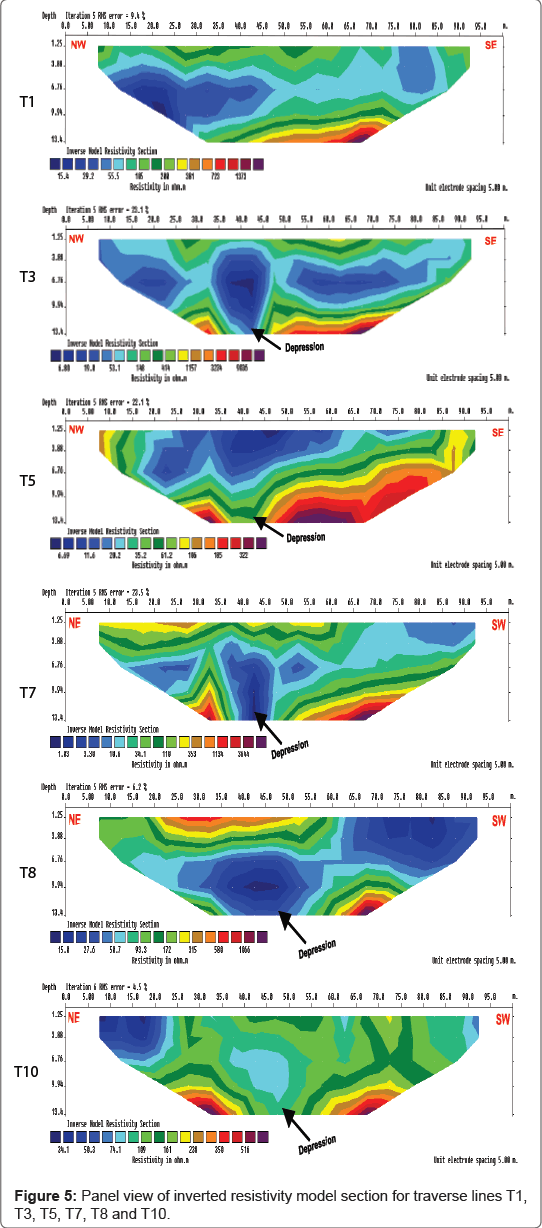
Figure 5: Panel view of inverted resistivity model section for traverse lines T1, T3, T5, T7, T8 and T10.
The data acquired along all the ten gridded traverse lines with 2D Wenner profile were combined to produce the slice depth and a collective 3D view of the inverted resistivity models (Figure 6) for all the traverse lines (T1 to T10). X and Y coordinates represent the NWSE and NE-SW directions respectively with slices been made along ZDirection to a maximum depth of 21.9 m. Layers 1 to 3 shows high degree of variations in resistivity distribution at shallow depth revealing formation consisting of highly resistive topsoil material (lateritic hardpan) at the eastern part with low resistivity (highly conductive) material concentrating at the south-western part of the study area. The high resistivity variations are attributable to the heterogeneity and unpredictable nature of the geology of a typical basement complex [17]. Material with characteristics blue to green color bands having resistivity value of ?100 Ωm is presumed to be weathered unit and is seen to be consistent across all the slices with an approximately NE-SW trend. Also, the underlain material within the area was presumed to be basement rock and was delineated by layers 4-6 with depth range of 8.68-21.9 m showing highly resistive material characterized by red to pink color bands towards the southern part of the area with resistivity values of ?200 Ωm. The resistivity value within this region increases with layer depth.
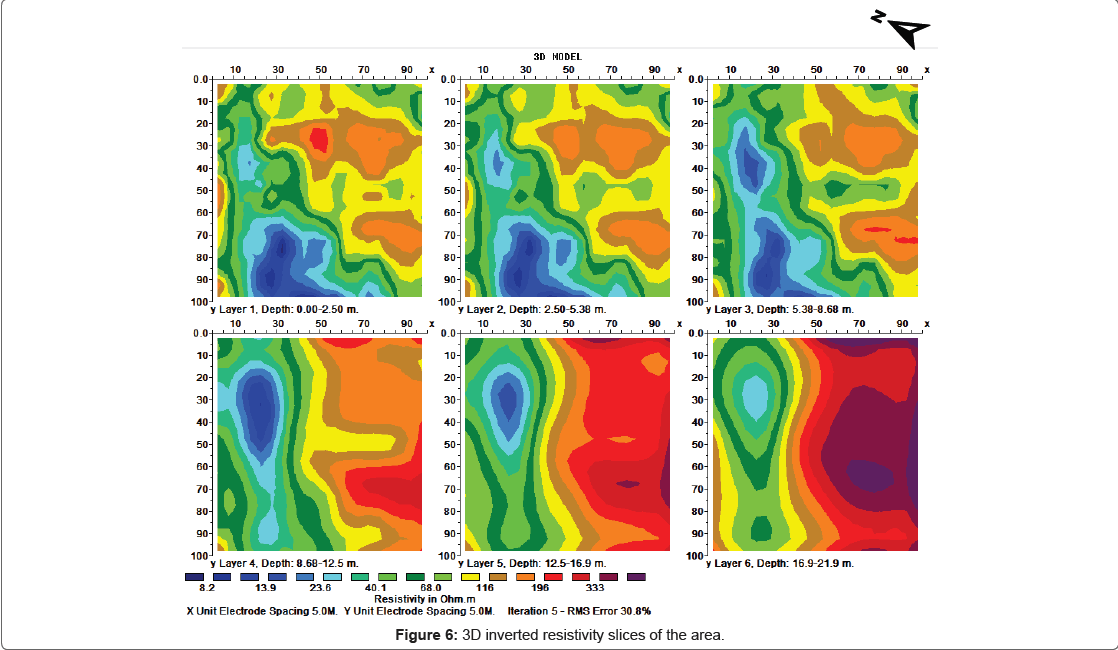
Figure 6: 3D inverted resistivity slices of the area.
Ground penetrating radar results
Radar section results for 250 MHz antenna frequency as represented by traverse line 2 (Figure 7) respectively was able to image up to 10 m depth within the study area. Four radar facies were recognized and correlated to their lithological equivalence in geolectric section and pit information within the study area. The upper layer (above the red dotted lines) shows high amplitude, parallel and horizontal reflections with good continuity and is interpreted as topsoil [18,19]. The thickness is approximately 0.7 m across the entire 250 MHz antenna frequency profiles. This is underlain by high amplitude, sub-parallel and chaotic with moderately continuous reflection characterized to be lateritic hardpan (between red and yellow dotted lines) across the 250 MHz antenna frequency profiles with thickness range between 0.3 m and 2 m except beneath traverse line 5 where the layer is absent. The third layer (between yellow and green dotted lines) depicts the weathered unit (clay/sandy clay) with low to moderate reflection amplitude, parallel and horizontal reflection with poor continuity and ranges in thickness between 4 m and about 8 m along the entire traverse lines. The weathered layer is underlain by fresh basement (from green dotted lines to infinity) consisting of low reflection amplitude with poor continuity and depth to fresh bedrock ranging from 6 m to 8.5 m across the traverse lines.
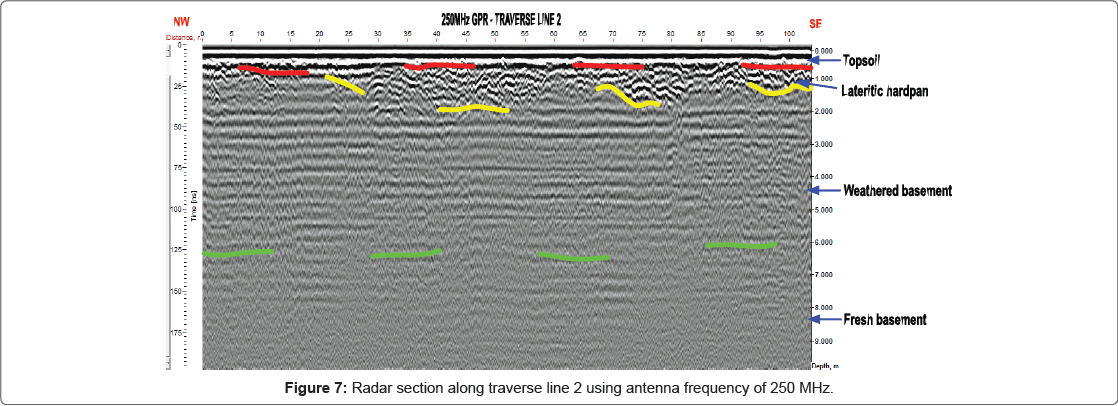
Figure 7: Radar section along traverse line 2 using antenna frequency of 250 MHz.
Figure 8, radar section for traverse line 8 shows a representative radar section result using 500 MHz antenna frequency. The antenna frequency generally delineated a maximum depth of 5 m. Three radar facies were recognized and correlated to the lithological equivalence from geoelectric section and pit information obtained within the study area. The high amplitude, parallel, horizontal and continuous reflections characterized by the upper layer (above red dotted lines) is interpreted as the topsoil with approximate depth of <0.5 m across the entire 500 MHz radar section traverse lines. The second layer (between red and yellow dotted lines) was interpreted as lateritic hardpan with high amplitude, chaotic reflectivity and moderate continuity with approximate thickness of 1.5 m except for traverse line 5 where lateritic hardpan was not delineated. The last layer (beneath yellow dotted lines) is characterized by low to moderate amplitude, parallel and horizontal reflection with moderate continuity and is interpreted within the area as weathered basement with depth at infinity.
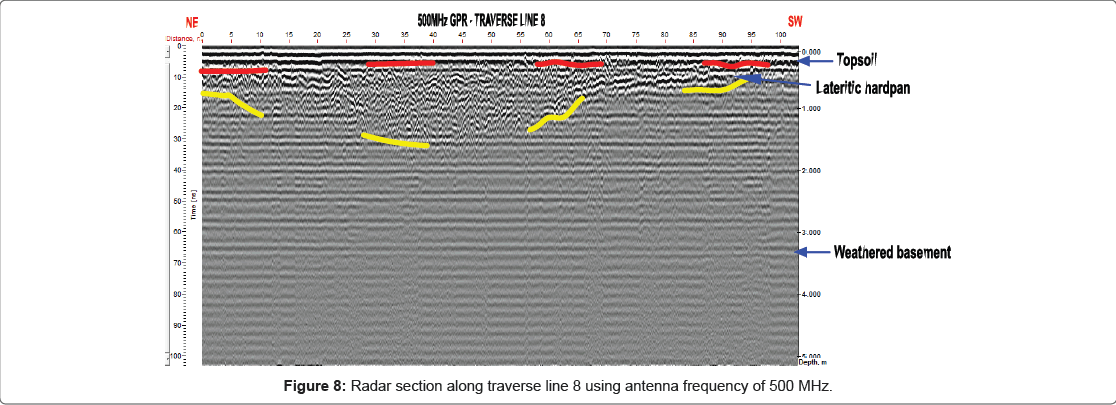
Figure 8: Radar section along traverse line 8 using antenna frequency of 500 MHz.
Figures 9 and 10 shows representative correlation of the geophysical results obtained within the study area. After careful examination of all the results, the 2D resistivity models and ground penetrating radar section results interpreted beneath the traverse lines show some similarity. The 2D inverted resistivity sections, geoelectric section and radar section correlates well based on the delineated lithological sequences, approximate layer depth and structures underlying the study area.
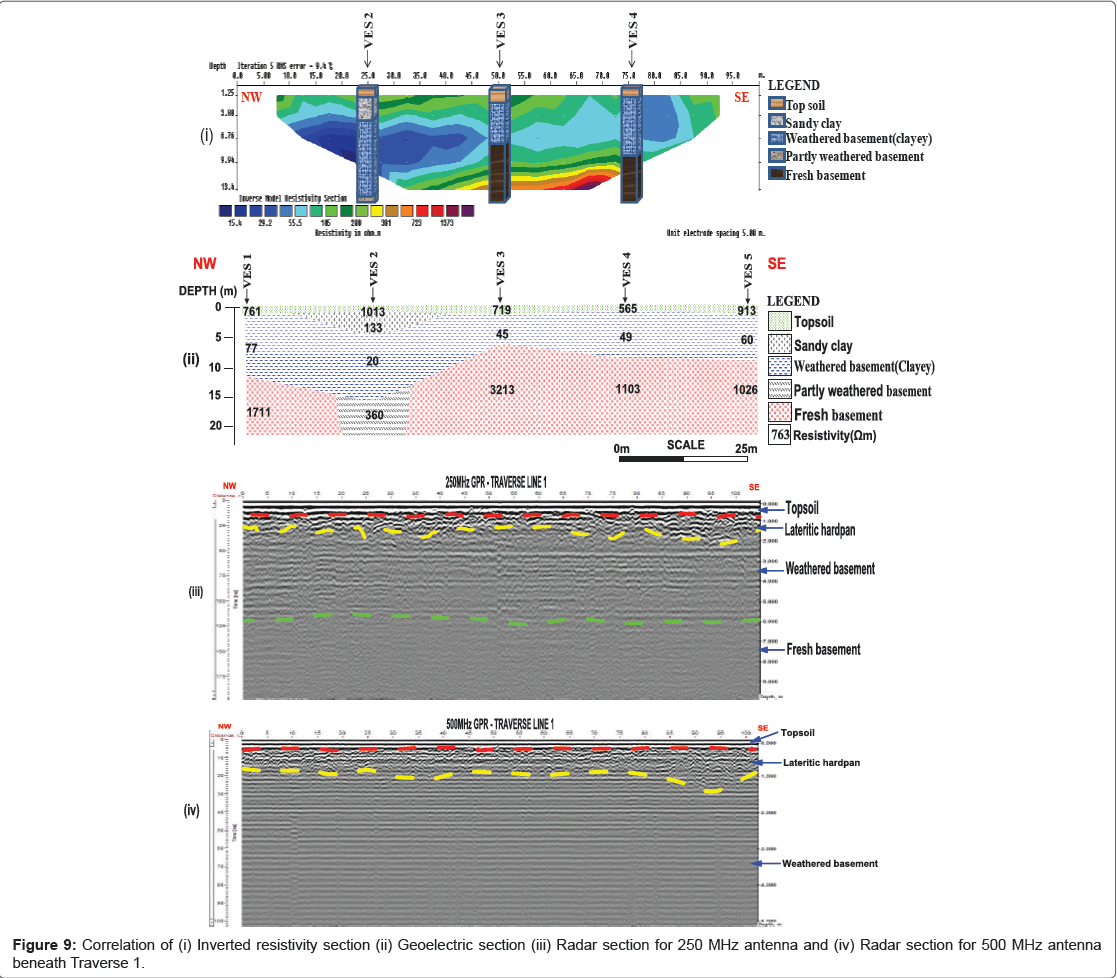
Figure 9: Correlation of (i) Inverted resistivity section (ii) Geoelectric section (iii) Radar section for 250 MHz antenna and (iv) Radar section for 500 MHz antenna beneath Traverse 1.
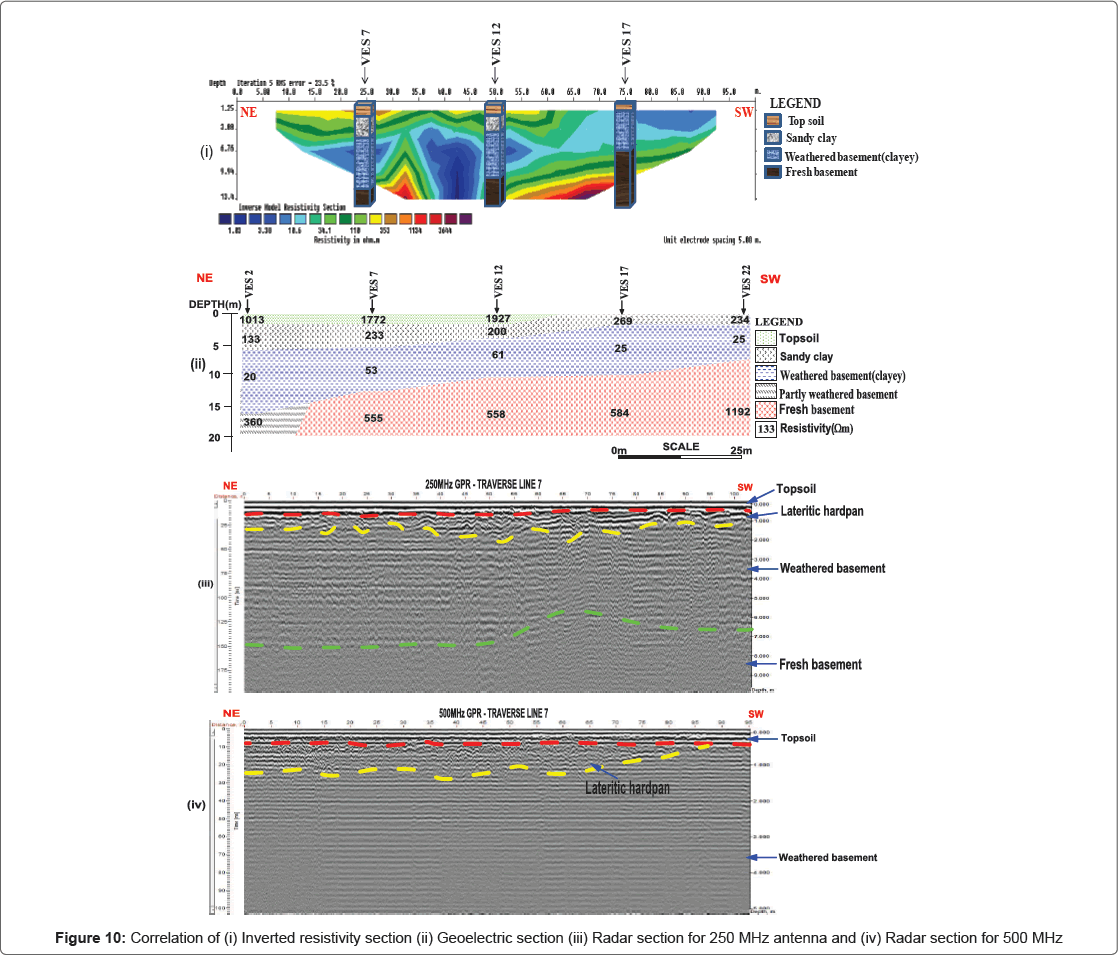
Figure 10: Correlation of (i) Inverted resistivity section (ii) Geoelectric section (iii) Radar section for 250 MHz antenna and (iv) Radar section for 500 MHz
Both techniques were able to delineate three to four geologic layers which include the topsoil/lateritic hardpan, weathered basement and fractured/fresh basement. The boundary between the weathered basement and fresh basement could not be effectively defined on the radar section, presumably due to the attenuation of radar signal by the conductive layer (clay-rich weathered basement) that overlies the fresh basement. The results of the 250 MHz antenna frequency was able to confirm the basement and it penetrates a depth of 10 m while the 500 MHz antenna frequency terminates within the weathered basement, as it penetrates a depth of 5 m. The 500 MHz antenna frequency gives better resolution of the subsurface information than the 250 MHz antenna frequency. Electrical resistivity results were able to map the lithological sequences within the area, the presumed depression into bedrock and the direction along which the depression is trending. GPR results were able to delineate only the lithological sequences and could not ascertain the structural information due to low radar signal strength that gets to the bedrock.
Integrated geophysical techniques involving Vertical Electrical Sounding, Electrical Resistivity Imaging and Ground Penetrating Radar have been adopted in this study around Ajibode, southwestern Nigeria. The result of the Electrical Resistivity (ER) investigation has effectively delineated the subsurface geological information and gives detailed description of lithological setting within the area.
It was observed from the ER surveys that depth to competent basement varies across the study area with shallow depth towards the south-southeastern direction and as deep as 22 m towards the northwestern direction where presumed depression into the basement are delineated on resistivity data.
Thus, the area under study can be categorized to have semicompetent to competent basement rock considering the resistivity distribution of the underlying bedrock and the pit information from the area. The nature of the overlying material (clay-rich material) and depression into the bedrock at some location could pose threat of differential settlement to engineering construction works. Therefore, it should be ensured that subsurface regions where depressions were noticed are avoided when sitting mega structures. Moreover for construction works within the area, foundation should be designed to sit comfortably on a competent bedrock or by employing suitable foundation method (such as piling) to ensure the stability of any proposed structure in the area in other to avoid foundation failure. Reliable information about the lithological characteristics of the study area has been deduced from the results of this research work. Thus, electrical resistivity methods and ground penetrating radar are versatile tools in shallow engineering site characterization and should therefore be incorporated in any pre-foundation or geotechnical investigation for better understanding of the subsurface geology.
We appreciate the CEO of Geoterrain Nigeria Limited and all the staff of the company for their contribution and assistance during this work by making the GPR equipment and processing software available for use and their assistance on data acquisition and processing. Our sincere thanks also goes to the management of Geo-sore Multi-transaction Limited, Nigeria for making the DC resistivity meter available for use in the course of this research work.