Journal of Geology & Geophysics
Open Access
ISSN: 2381-8719
ISSN: 2381-8719
Research Article - (2023)Volume 12, Issue 7
Kharita reservoir in Karam field is a prolific early Cretaceous reservoir located in Badr El Din concessions, Abu Gharadig basin, Western Desert, Egypt. This reservoir is characterized by lateral and vertical variations in facies type, reservoir quality, and connectivity, which in turn affect the efficiency of further exploitation in the Karam field. Herein, a 3D static reservoir model was conducted using multidisciplinary datasets (well logs, seismic, core, pressure, and production data) to provide a comprehensive understanding of Kharita reservoir characteristics helping optimize the strategies of hydrocarbon field development. The conducted well correlation reveals potentially multiple gas accumulations separated by mappable shales. Two types of reservoir quality were interpreted for the Kharita, good-quality active distributary channels, and poor tidal flat deposits. The different types of genetic facies have different property distribution and connectivity behaviours. Active distributary channels have higher connectivity than the tidally influenced channels and the tidal flat sands. The estimated initial gas in-place demonstrated that half of the gas volume is attributed to poor-quality sands. This work procedure will lead to a more precise prediction of reservoir performance, and select the optimum subsurface development plan, including the location and number of infills required to increase the ultimate gas recovery from the Kharita reservoir in Karam fields.
3D reservoir modelling; Reservoir characterization; Volumetric; Kharita; Karam field
Static reservoir modeling, which involves the computer-based construction of hydrocarbon reservoirs, has provided several benefits, such as enhanced reservoir estimation, insight into well placement, and a field development plan. In addition, it is also helpful in production prediction and better resource management [1]. Static reservoir modeling is the integration of varying types of data, such as log, core, and seismic, by means of a grid-based mathematical representation of the reservoir [2]. Stated that in order to achieve a better assessment of the hydrocarbon in-place volume, well design, uncertainty analysis, and flow simulation, the reservoir should be represented or visualized in 3D. Reservoir models are constructed for a wide range of purposes; however, common to all of them is the wish to demonstrate the subsurface. Geometrical, structural, and petro- physical features play a significant role in the production capacity of the reservoir. The reservoir model is useful to predict reservoir behavior because it incorporates all structural frameworks and stratigraphic layers. The 3D geological model also shows the properties distribution between the wells and the probability to describe the reservoir magnitude of heterogeneity that affects porosity, permeability, flow distribution, and subsurface flow. This technique allows the reservoir modeler to estimate reservoir properties between the wells from observed data points at well locations and attempt statistical expectation. In this work, five wells from the Karam have been selected to study the Kharita reservoir. The Karam field extends between latitudes 28° 00 and 28° 15 N and longitudes 29° 4 and 29° 25 E. It is situated in Badr El Din Concession, Western Desert of Egypt, 300 km west of Cairo, and it is shown in (Figure 1).
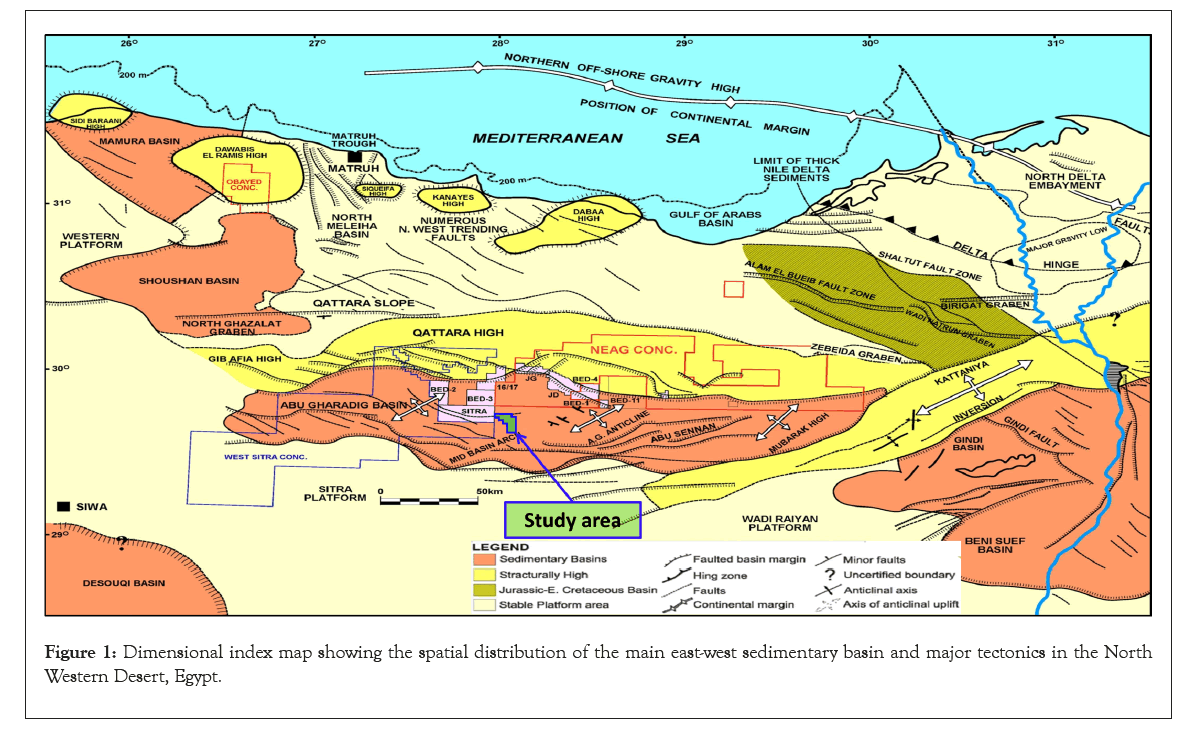
Figure 1: Dimensional index map showing the spatial distribution of the main east-west sedimentary basin and major tectonics in the North Western Desert, Egypt.
Geological setting
The subsurface of the Western Desert of Egypt is characterized by a complex system of Mesozoic rift basins that cover an area of around 200,000 km2 [3,4]. These basins form a series of numerous discrete E-W to ENE-WSW and NE-SW-oriented half-graben basins that originated in the Jurassic and sustained to subside over the Cretaceous, such as the Abu Gharadig, Alamein, Matruh, and Shoushan basins [5,6]. The Abu Gharadig basin, (Figure 1), is an E-W-oriented asymmetric graben and is characterized as one of the greatest productive basins in the northern part of the Western Desert. It covers about 300 km in length and 60 km in width. The sedimentary cover of this basin ranges in age from the Late Jurassic to the Miocene. The Sharib-Sheiba high constitutes the northern border of the basin; the Sitra platform is its southern limit; the Kattaniya-Abu Roash high lies to its East; and the Faghur-Siwa basin lies to its West [7,8]. The Karam field covers a 13 km × 5 km area and consists of a fault-bounded three-way dip-fault closure at top Kharita level.The stratigraphic succession of the Karam field follows the North Western Desert Regime (Figure 2). The Kharita formation, which is the key objective of this study, is conformably overlain by the Bahariya formation and is underlain by the Dahab formation. It is mainly composed of sandstone and shale. The Kharita formation in Karam field is about 1000 m thick and sub-divided into upper, intermediate, and lower units. The uppermost units are characterized by low net gross, the sands tend to become thinner and more discrete with increasing frequency of shales. The intermediate zones are characterized by medium to high net gross, despite sheet-like geometry, large variability in sand development can be seen in these units. The lower units are mainly shale with sand streaks. The upper and intermediate units are the focus of this study.
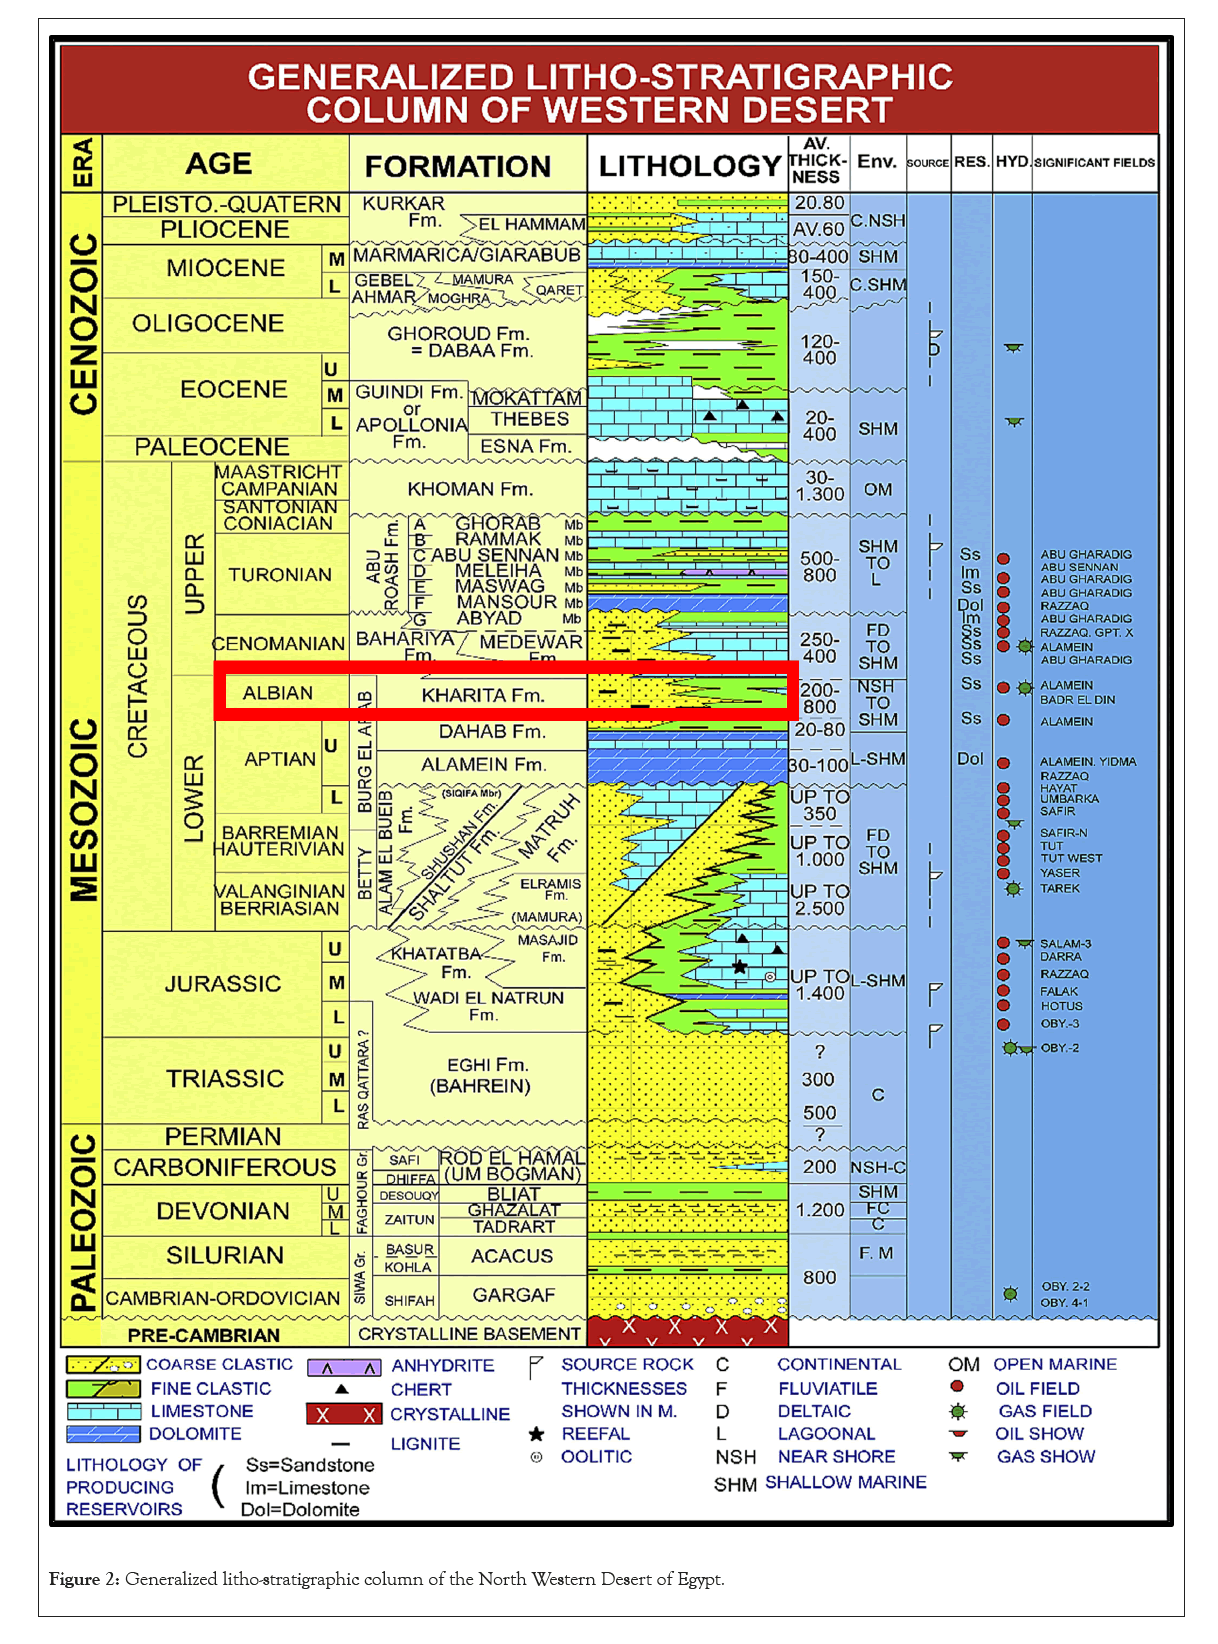
Figure 2: Generalized litho-stratigraphic column of the North Western Desert of Egypt.
The current work integrates various types of data (geological, geophysical, petrophysical and production data) provided by Badr El Din Petroleum Company (BAPETCO) and Egyptian General Petroleum Corporation (EGPC) for characterizing and modelling the Kharita reservoir in the Karam field. The workflow used to model the Kharita reservoir in the Karam field comprised 6 steps: Data import, stratigraphic modeling, structural modeling, facies modeling, petro-physical modeling, and ending with volume calculation (Figure 3).
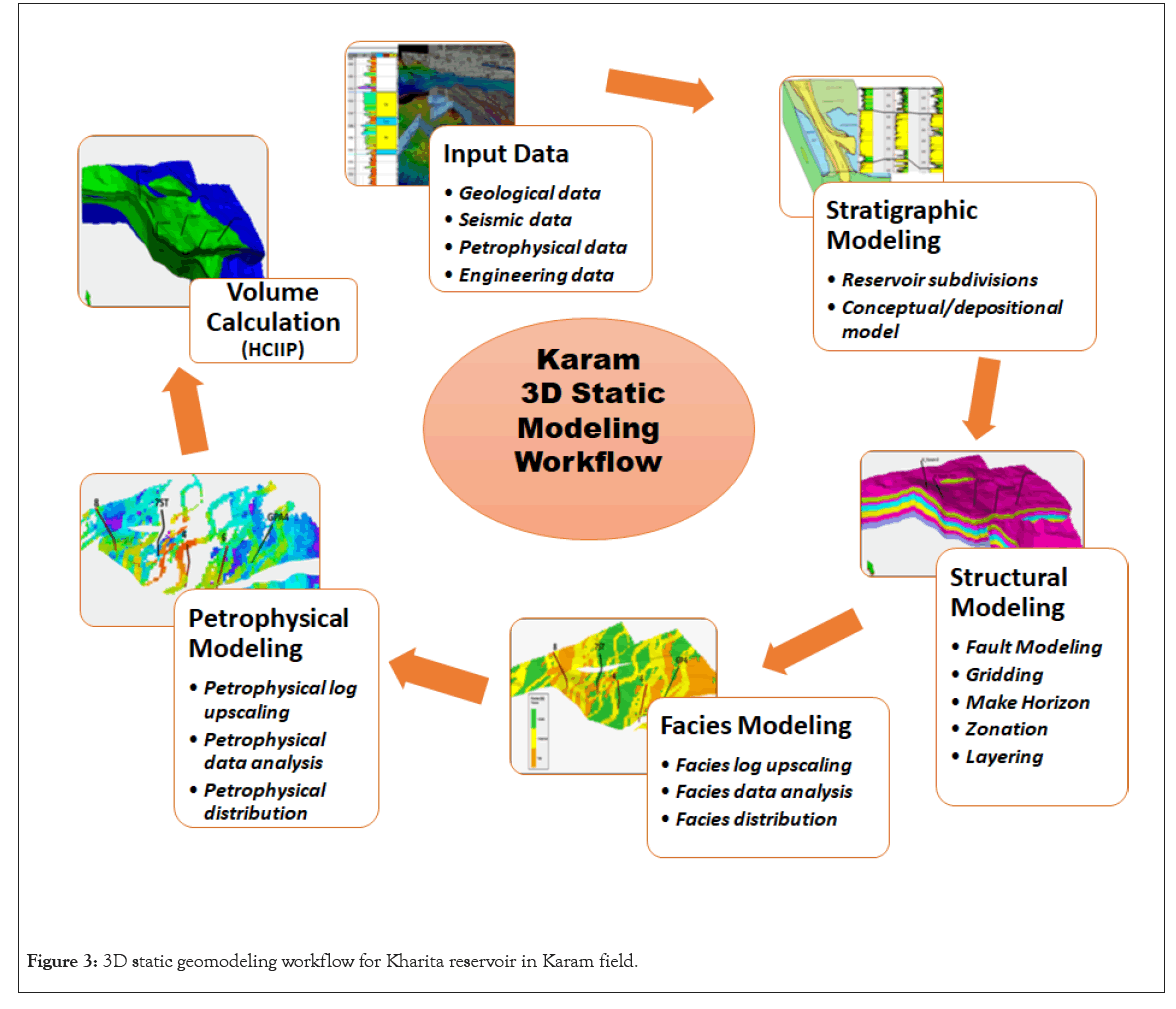
Figure 3: 3D static geomodeling workflow for Kharita reservoir in Karam field.
The well data from five wells in the Karam field were collected and imported into the static model of the Karam field, seismic marker at Intra Bahariya limestone, fault sticks and fault polygons, pressure measurement and production test results were integrated. The Well correlation followed the input data in order to understand the vertical and lateral variations in thickness and reservoir properties. The well logs utilized for well correlation include Gamma Ray, Neutron, Density, Resistivity, and Effective Porosity and Permeability. The followed structural geological model passed through three steps: Fault modeling, pillar gridding, and vertical layering, the objective is to develop a consistence reservoir framework that can be gridded for a 3D geological model.
To represent the discrete log (facies) and continuous (porosity and permeability) features in a grid, well logs must be scaled up from the small scale of the wells to the larger scale of the geogrids. Upscaling well logs entails transferring values from the wells to the 3D grid cells that the wells have visited. Log data is resampled, or "upscaled," to populate facies and petrophysical data amongst wells where data is absent. The histograms, cross plots and variogram analysis were used to understand data distribution by zone. Variogram analysis describes the data anisotropy range and orientation that will be used to characterize the spatial continuity in the variation of facies and petrophysical properties. Sequential Indicator Simulation (SIS) and object modeling algorithms were used to populate geocellular grids with discrete property values facies/rock types. Sequential Gaussian Simulation (SGS) is the stochastic method utilized for modelling continuous properties. The calculation of the gas in-place for Kharita reservoirs in the Karam field is the latest phase in the reservoir assessment.
The aim of this volumetric assessment is to quantitatively estimate the gas quantity in the Kharita reservoir in Karam field. These volumes represent the first sign of the economic likelihood of the field and can be used to define where the most encouraging place should be drilled.
Data import
The importing of mulita-disciplines data sets represents the initial phase in the static modeling workflow. Well data, seismic marker at Intra Bahariya limestone, fault sticks and fault polygons, core data, pressure measurements and production data were collected and imported into the static model of the Kharita reservoir in Karam field.
Stratigraphic model
The well correlation and reservoir subdivision represent the second and most important steps in the static modelilng workflow. This process leads to zonal attribution in the model and consequently should be simple, reflect the depositional setting, and elucidate the variation in the thickness between wells. The Kharita formation in Karam field is about 1000 m thick. Most of the Karam wells have been terminated within the first 500 m which is the main focus of this study; only one well that has penetrated the complete section of Kharita formation. The boundary between the lower Bahariya unit and the underlying Kharita-1 unit is not marked by a clear marker. In Karam and offset fields, the top Kharita is defined by isochoring downwards approximately 150 m from the Intra-Bahariya limestone marker. The upper part of the Kharita formation has been divided into 9. The subdivisions were based on the variation in lithology and pressure communication. The uppermost, Kharita-1 to Kharita-3 are characterized by low net to gross, the sands tend to become thinner, discrete, and reservoir connectivity is expected to be poor, (Figure 4). The lower units (Kharita-6 to Kharita-9) are characterized by medium to high net to gross; the sands seem to be best developed, thickest, and continuous. The upper and lower units are separated dynamically/pressure behavior by a very low net to gross sequence called Kharita-4. Despite the lower units are in pressure communication, the vertical connectivity is low because of the shale intervals that act as baffles to vertical flow (Figure 4).
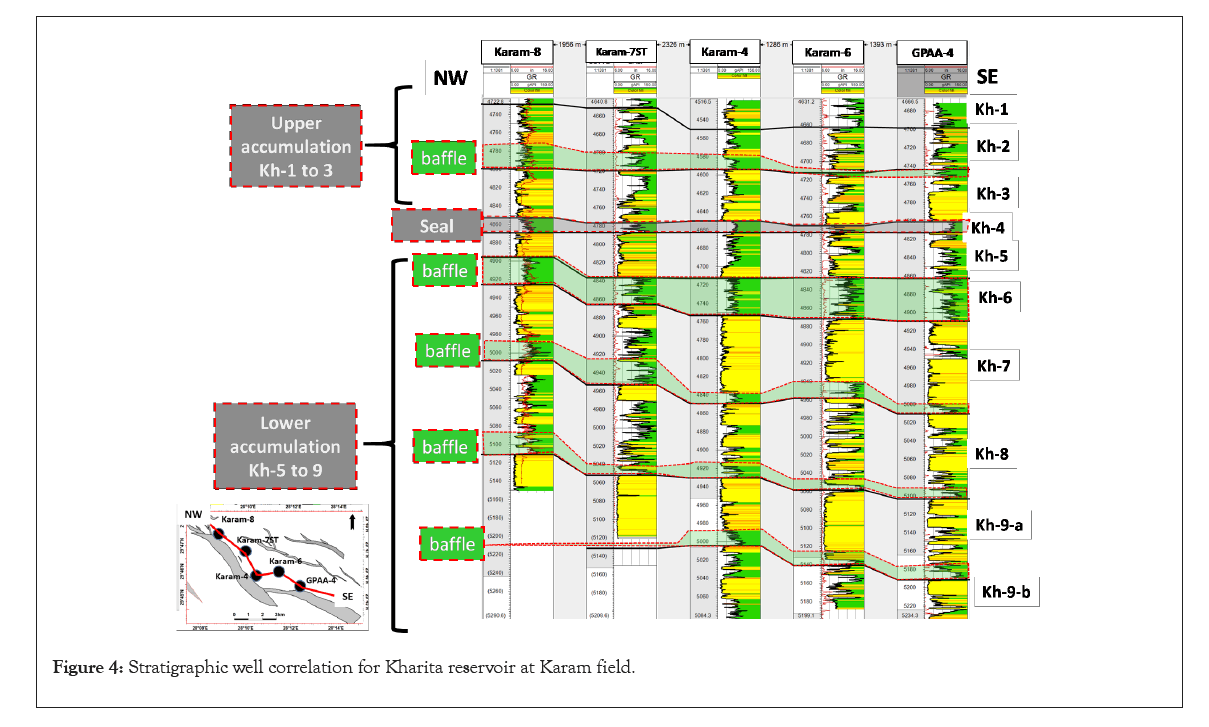
Figure 4: Stratigraphic well correlation for Kharita reservoir at Karam field.
Depositional environment: The early Cretaceous Kharita formation is extensively distributed in the Northern Western Desert as fluvial dominated sediments (sequence of channel sand and subordinate intercalated shales deposited in a lower coastal or delta plain depositional setting with the presence of a basin-wide embayment). These sequences pass upward into increasingly shaly deposits of the Bahariya formation, representing the transition from a coastal to a more marine environment as a result of the major Cenomanian transgression. The interpretation of cores, well log characters, and the biostratigraphic data all point to a lower delta plain tidally-influenced depositional system with strong fluvial input. Tidal influence is weak in the lowermost units (Kharita-7, to 9) and increases upward ((Kharita-4 to 1). The sedimentary structures seen from the cores in Figure 5 are consistent with this interpretation. The absence of key sedimentological features of the braided systems, such as pebbles or very coarse-grained, poorly sorted sediments, and the lack of exposure criteria characterized by braided settings such as paleosol or reddish shale, confirms this interpretation.
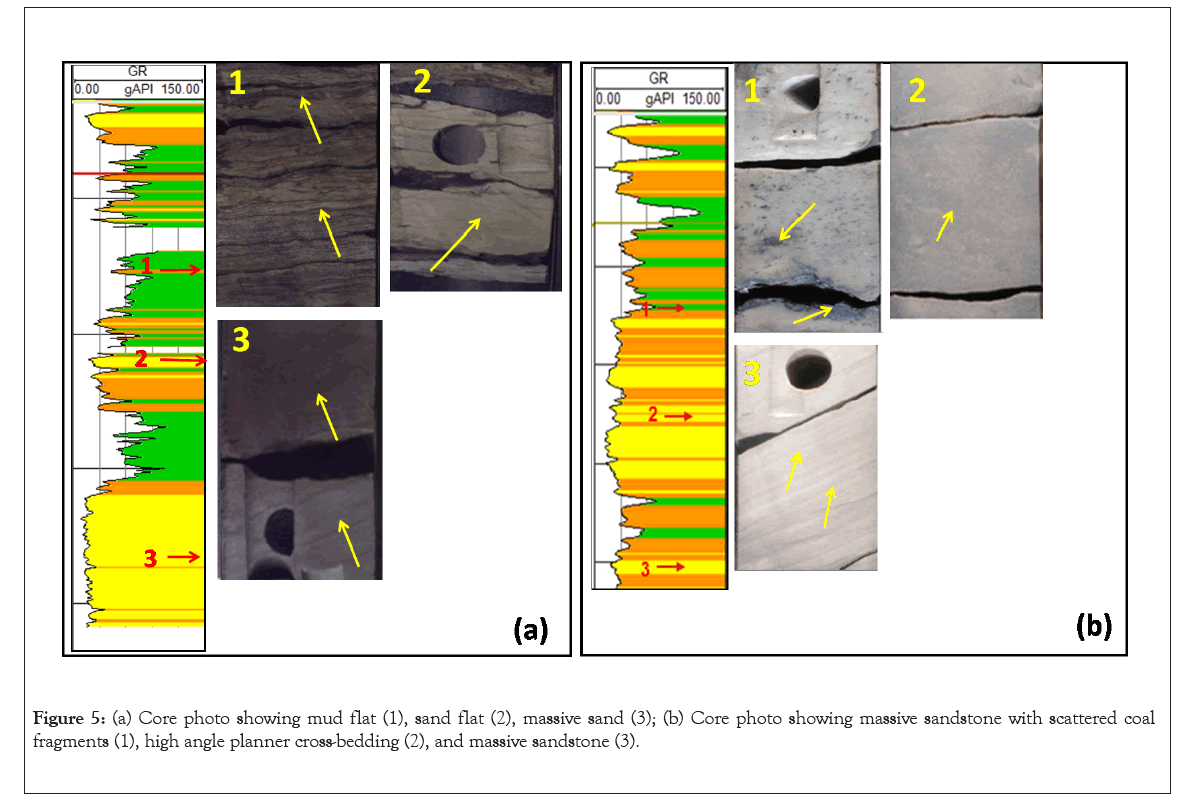
Figure 5: (a) Core photo showing mud flat (1), sand flat (2), massive sand (3); (b) Core photo showing massive sandstone with scattered coal fragments (1), high angle planner cross-bedding (2), and massive sandstone (3).
Two types of reservoir facies were interpreted for the Kharita in Karam field, good-quality active distributary channels and poor quality tidal deposits. The different types of genetic facies units have different porosity/permeability relationships. Active distributary channels have higher connectivity than the tidally influenced channels and the tidal flat sands. The overall connectivity of sands within (Kharita-7 to 9 is expected to be good (as the net sand is high, most sands are expected to be connected). The depositional model of Bartlesville sandstone (Greenwood Country, Kansas, "USA") in Figure 6 is believed to be a possible regional depositional analogue.
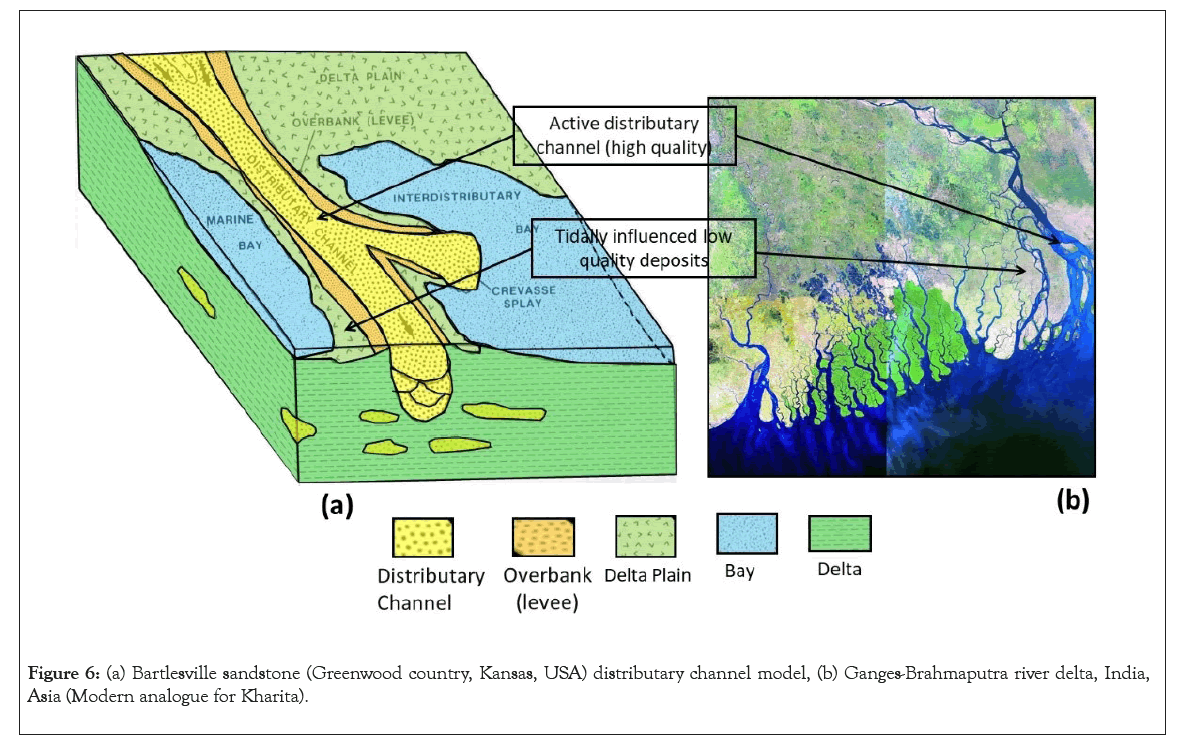
Figure 6: (a) Bartlesville sandstone (Greenwood country, Kansas, USA) distributary channel model, (b) Ganges-Brahmaputra river delta, India, Asia (Modern analogue for Kharita).
Structure model
The interpreted fault pattern and structural horizons are the key input for constructing a structural model [9,10]. The structural framework for the Karam field was derived from the depth-converted surface of Intra-Bahariya limestone, which is a 3D seismic marker (Figure 7a). The seismic surface was tied to the well tops using convergent gridding and with a 1000-meter radius of influence. All other surfaces were isochored from this control surface using their respective well tops and assuming structural conformity. Major faults and lineaments interpreted in the area were taken into Petrel as fault sticks. Initial fault interpretations were modified as appropriate to ensure proper modeling of fault planes, the creation of fault-controlled segments, and the matching of the seismic horizons with the fault positions. The faults in Karam field were modeled as lestric and sub-vertical faults (Figure 7a). The fault sticks have been used for the fault pillar construction (listric shape). All faults honor the data. The fault relationships, such as fault connections and bifurcations, were taken into consideration during the fault modeling process.
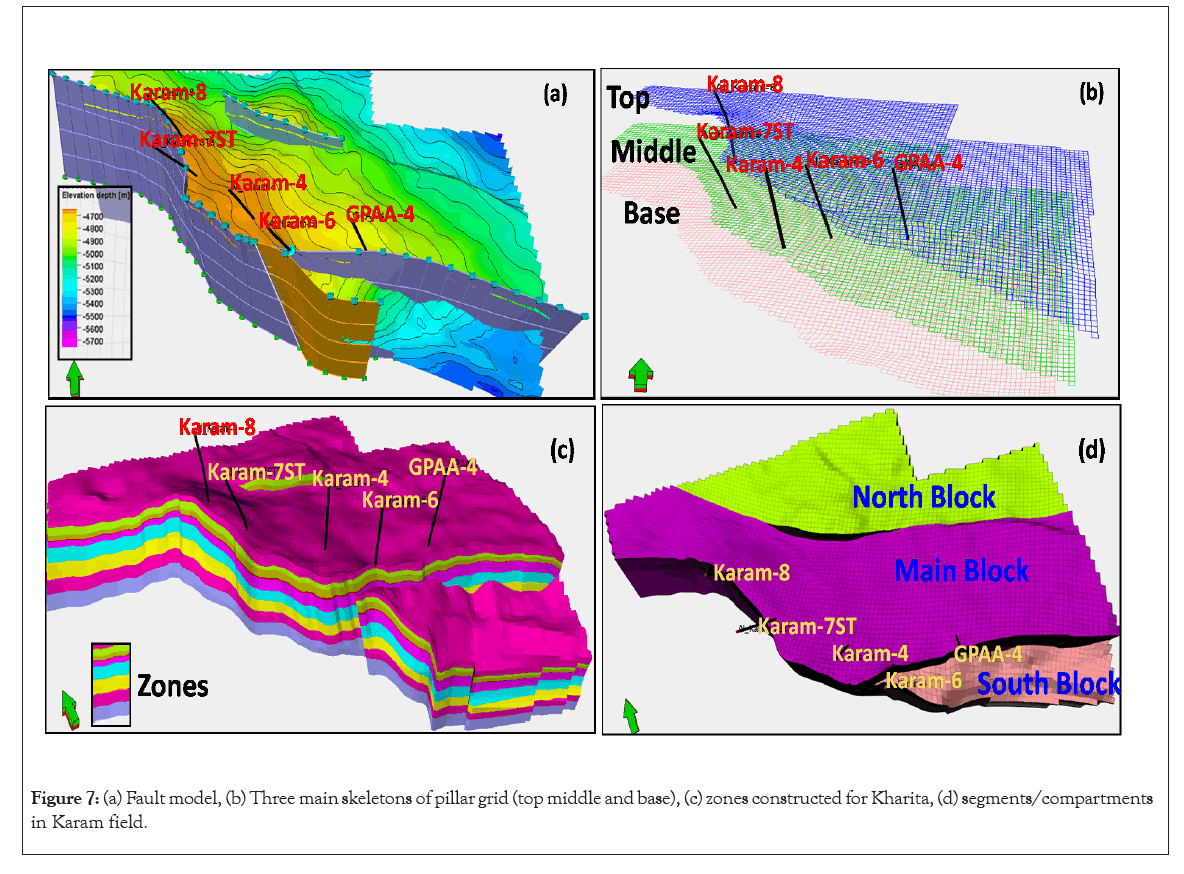
Figure 7: (a) Fault model, (b) Three main skeletons of pillar grid (top middle and base), (c) zones constructed for Kharita, (d) segments/compartments in Karam field.
The 3D grid creation was carried out as one of the phases in constructing a structure model, which represents a lattice of horizontal and vertical lines employed to visualize a three-dimensional (3D) geological model. The structure grid was sized at 13 km east-west and 4 km north-south with an irregular area of interest including a partial aquifer. A 3D grid basically divides the model into boxes. A single rock type, porosity value, permeability value, water saturation value, etc. will be assigned to each box or grid cell. The grid increment of 50 m × 50 m has been used, which allows modeling of the smallest geo-bodies expected in such a depositional setting while keeping within the limits of the dynamic simulator to achieve an acceptable simulation run time. The skeleton of this gridding comprises a top, mid, and base skeleton grid, as shown in (Figure 7b). The model was constructed with 10 zones, starting with the base Intra Bahariya limestone marker. The reservoir units were assigned an average of 1 m for each layer, non-reservoir intervals were assigned 1 layer, and for all the zones, a conformable proportional layering scheme was implemented. The resulting total number of modeled cells are 2,985,584, and the active cells are 835,095; this is acceptable for reservoir simulation without any upscaling and gives suitable modeling resolution (Figure 7c). The model contains three fault segments, which allowed for the assignment of separate Gas Initial In-Place (GIIP) regions: The main segment consisting of the proven block and two segments in the south-east and northern undrilled blocks (Figure 7d). This framework of the horizons, zonation, layering and fault surfaces defines the structural model of Kharita reservoirs and produces the geometrical input for 3D grid building in
The constructed 3D structural model of Kharita shows that Karam field is situated on a 3-way dip closure bounded by a large fault trending NW-SE with approximately a few other small-scale and low-throw NW-SE trending faults running parallel to the main bounding fault.
Facies model
The first step to modelling the facies is to create the facies logs for each well, three types of facies were defined for the Kharita reservoir in Karam field: Good-quality sand, poor-quality sand and shale (non-reservoir). The following step in facies modelling is to resample the facies log employed in the reservoir modelling process. The objective of well log blocking is to allocate well log values that penetrated by well to the 3D grid cells [11]. Each cell in the model can have only a single value, so the log data is averaged, or upscaled, to propagate the facies data between the wells where data is not present. A high- resolution layering scheme was required to preserve the thin shale facies (Figure 8a). Quality Control (QC) was done to make sure that the flow units and the barriers have been captured (Figure 8b). If the thickness of the layering is too high, then too much information has been lost, [12]. The histogram shape for the input and simulated result is shown in (Figure 8c). Facies data analysis was done in order to confirm the vertical distribution of facies and the thickness range of each facies. The vertical facies distribution within each unit has been analyzed and transferred into a vertical facies proportion curve, which is then used in the facies modeling step. The upscaled facies logs are used to predict and populate the facies between wells. The data analysis results and conceptual depositional model were integrated in order to produce a robust facies model, [12,13]. The well correlation, regional depositional setting, regional shoreline, in addition to reservoir production performance indicated that the dominant depositional trend direction is toward the NE. The pixel-based SIS (Sequential Indicator Simulation) algorithm was utilized to populate the poor-quality sand, while the good quality sand was distributed using the object modelling algorithm, these are the most preferred method that can be used to model the Karam deposition setting Figure 9.
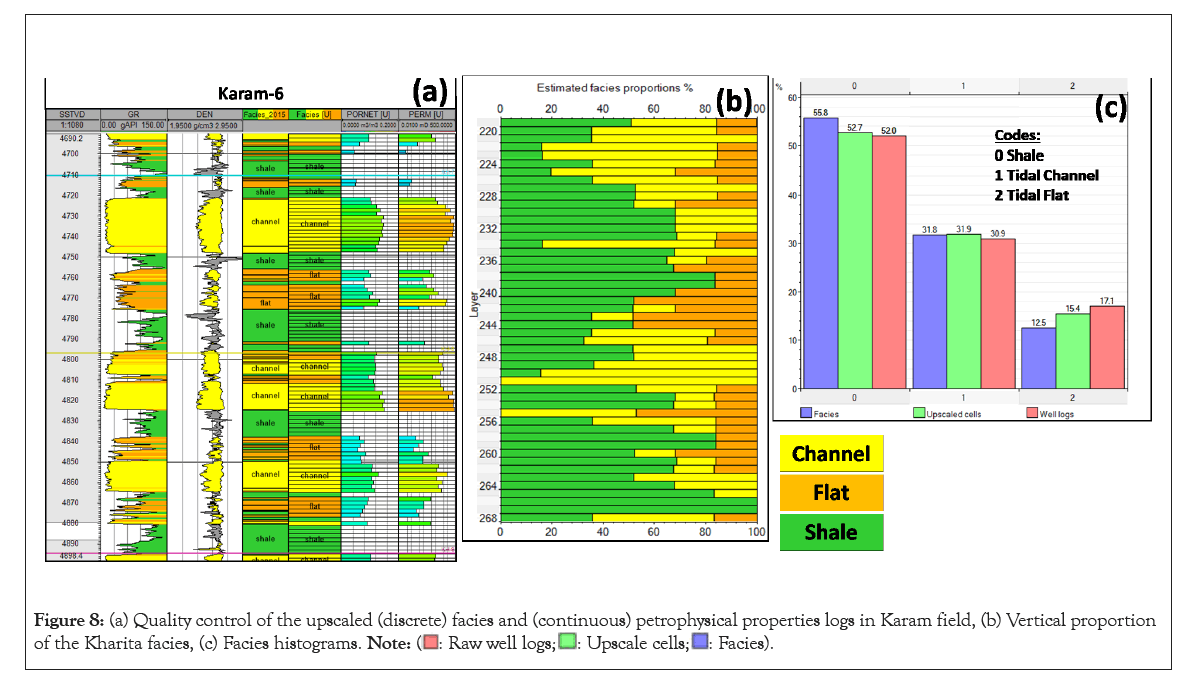
Figure 8: (a) Quality control of the upscaled (discrete) facies and (continuous) petrophysical properties logs in Karam field, (b) Vertical proportion of the Kharita facies, (c) Facies histograms. 
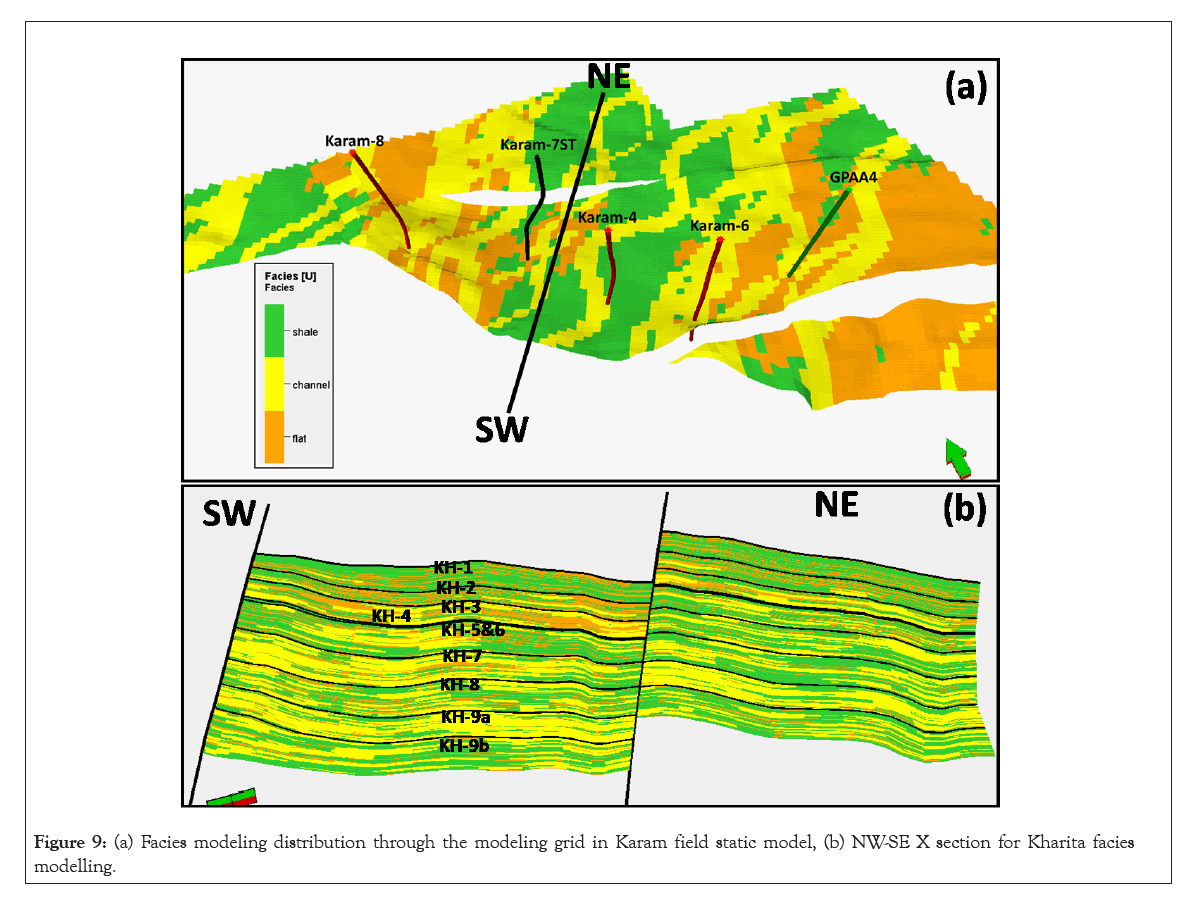
Figure 9: (a) Facies modeling distribution through the modeling grid in Karam field static model, (b) NW-SE X section for Kharita facies modelling.
Petrophysical model
The petrophysical model was created by populating the values of petrophysical properties (porosity and permeability, etc.) to each cell of the 3D grid. The purpose of the Petrophysical model is to yield a complete set of continuous reservoir parameters (i.e., porosity, permeability, net to gross, and water saturation) for each cell of the 3D grid. The pixel-based SGS (Sequential Gaussian Simulation) using the facies model as a basis was the preferable algorithm because it gave the best representation of the reservoir facies heterogeneity. The distributed petrophysical data showed a very good match with the facies genetic distribution, it is clear from the data histogram that the channel facies is the best reservoir quality, followed by the tidal flats (Figure 10b and 10c) [14-18].
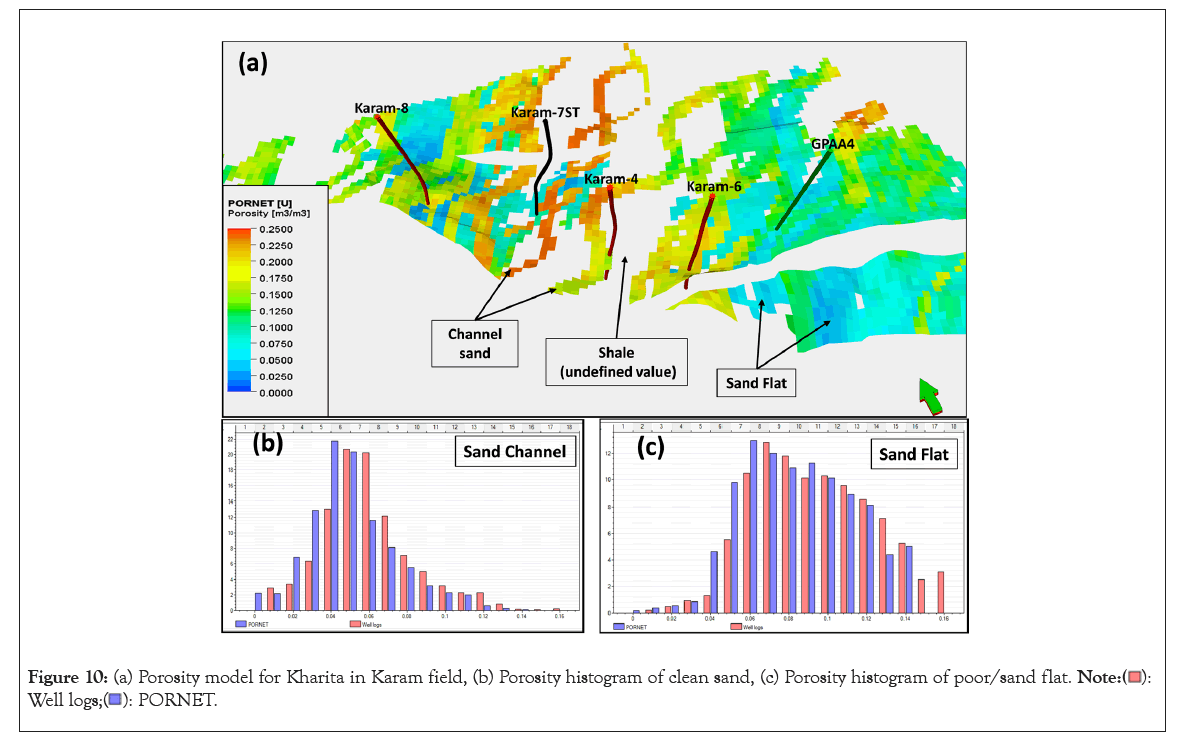
Figure 10: (a) Porosity model for Kharita in Karam field, (b) Porosity histogram of clean sand, (c) Porosity histogram of poor/sand flat.

The porosity model for the Kharita reservoir in Karam field exhibits various lateral and vertical variations in the porosity distribution that are directly linked to the facies variations (Figure 10a). The present structures could have an impact on the porosity distribution; the highest porosity value is preserved very close to the main bounding fault of Karam field [19-21].
In order to generate a permeability model, the relationship between porosity and permeability must be understood. Cross-plots are used for this task (Figure 11). Permeability data were analyzed per unit and per facies and modeled by co-kriging to porosity using the correlation coefficient seen in the core data (Figure 11).
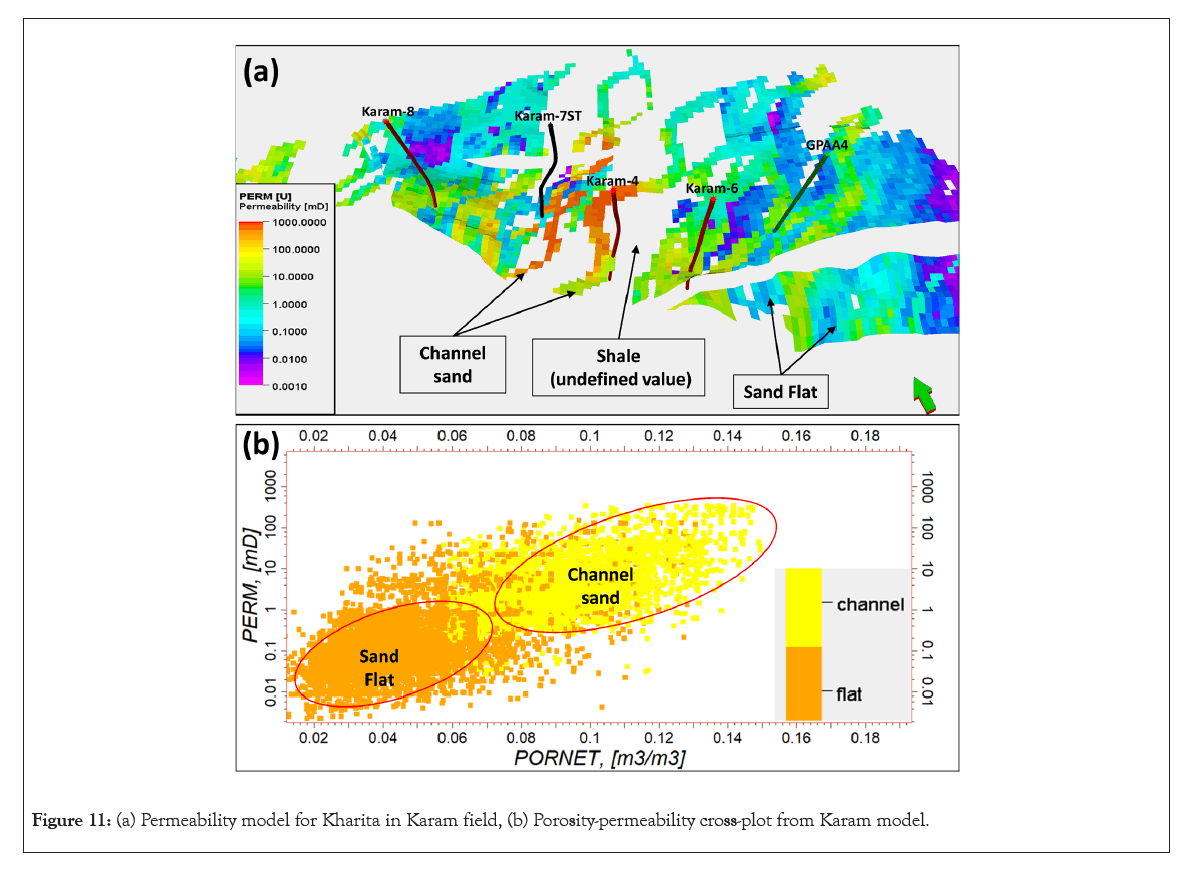
Figure 11: (a) Permeability model for Kharita in Karam field, (b) Porosity-permeability cross-plot from Karam model.
The net gross model was calculated by assigning a value of 1 to sand facies (poor and good), shale facies were kept undefined. Water saturation was calculated by assigning three values based on different permeability classes: Sw=0.24 for permeability less than 1 mD, Sw=0.19 for permeability from 1 to 10 mD, and Sw=0.14 for permeability more than 10 mD [22-26].
Reservoir volumetric
The last step of the static reservoir modeling is the calculation of the Hydrocarbon Initial In-Place (HCIIP), which represents the quantity of hydrocarbons existing in the reservoir at the time of exploration. The objective here is to assess the volume of gas and its distribution within the Kharita reservoir for upcoming field development [14-18]. After the static model was generated, the structural and petrophysical models were used to calculate the reserves in terms of Gas Initially in Place (GIIP), a fixed value of 235 for the formation volume factor (Eg scf/cf). Gas water contacts 4959 and 5060 were used for upper accumulation and lower accumulation respectively at the proven main block. The northern block is expected to have the same contacts as the upper accumulation of the main block. The southern (undrilled) block is expected to have the same contacts as the upper and lower accumulation of the main block based on the fault juxtaposition. It is uncertain whether this fault is sealing or not. The GIIP estimation for Kharita reservoir indicated that half of the estimated volume is attributed to poor-quality sands; appraisal drilling is required to unlock the estimated GIIP of the northern and southern blocks.
The present 3D static modelling work for Kharita reservoir in Karam field introduced a good understanding of the structure style, facies distribution and reservoir quality. The upper part of Kharita reservoir is characterized by low net to gross; the sand development tends to be isolated and the reservoir connectivity is expected to be poor. The intermediate and lower Kharita zones are characterized by medium to high net to gross, despite sheet-like geometry; large variability in sand development can be seen in these units. Two accumulations were identified within Kharita reservoir based on the pressure measurements. Two types of reservoir quality were interpreted for the Kharita reservoir, good-quality active distributary channels and poor tidal flat deposits. The different types of genetic facies have different property distribution and connectivity behaviours. Active distributary channels have higher connectivity than the tidally influenced channels and the tidal flat sands. The petro-physical model exhibits various lateral and vertical variations in the porosity distribution that are directly related to the facies changes. The GIIP estimation demonstrated that around 50% of gas volume in Kharita reservoir is attributed to non-productive (poor-quality) sands.
As a result of the facies and petrophysical characteristics: We concluded that the Kharita reservoir has developed at the eastern part of Karam field near the main bounding fault.
According to the obtained results, drilling of development wells is recommended near the main bounding fault toward the south-eastern part of the main block of Karam field. The southern and northern blocks have the potential for further drilling if the faults act as a seal. Horizontal or slanted wells with multi stage frac is recommended to unlock the in place gas of the poor quality sand.
The authors are grateful to the Geology department at Al-Azhar University, the Egyptian General Petroleum Corporation (EGPC), and the Badr El-Din Petroleum Company for providing the raw material and reports from their archives, all the digital logs to be used, and permission for publication. They are also grateful to the technical staff for the fruitful professional discussion.
Citation: Bakr A, Reda M, Fathy M (2023) Application of 3D Static Modeling and Reservoir Characterization for Optimal Field Development: A Case Study from the Kharita Formation, Karam Field, Western Desert, Egypt. J Geol Geophys. 12:1122.
Received: 24-Jul-2023, Manuscript No. JGG-23-25800; Editor assigned: 26-Jul-2023, Pre QC No. JGG-23-25800 (PQ); Reviewed: 09-Aug-2023, QC No. JGG-23-25800; Revised: 16-Aug-2023, Manuscript No. JGG-23-25800 (R); Published: 23-Aug-2023 , DOI: 10.35248/2381-8719.23.12.1122
Copyright: © 2023 Herisha AB, et al. This is an open-access article distributed under the terms of the Creative Commons Attribution License, which permits unrestricted use, distribution, and reproduction in any medium, provided the original author and source are credited.