Journal of Geology & Geophysics
Open Access
ISSN: 2381-8719
ISSN: 2381-8719
Research Article - (2017) Volume 6, Issue 1
Geophysical survey such as 2D resistivity imaging and seismic refraction tomography are non-destructive methods that widely used in subsurface exploration including archaeological study. The purpose of this survey is to identify the sediment deposition types of Sungai Batu area for Ancient River. Two study sites were chosen to conduct 2D resistivity imaging and seismic refraction tomography surveys. The 2D resistivity imaging survey was conducted using Poledipole array with 2.5 m minimum electrode spacing while seismic refraction tomography was performed using 5 kg sledgehammer as seismic source with 5 m geophone spacing. Roll along techniques are apply for the two methods in the study site 1 and 2. The study concludes that the subsurface of the study area comprise of 3 major soil types. The top soil (1st type) consists of loose and dry alluvium which indicated with resistivity value of >100 Ohm.m. The second type was saturated alluvium (clay and sand) with resistivity and velocity values of 10-50 Ohm.m and <1400 m/s respectively. When this type of soil change to moist condition, the resistivity value increase to <100 Ohm.m but velocity value remain. The 2D resistivity imaging and seismic refraction tomography detected the river bed with the value of >300 Ohm.m and >3600 m/s respectively. The correlation of 2D resistivity imaging and seismic refraction tomography show that the depositional environment for this survey is causes by land sediments deposit.
Keywords: 2D Resistivity imaging, Seismic refraction tomography, Sediments deposit
Sungai Batu was located in Sungai Merbok district, which is situated between Sungai Petani and Gunung Jerai. Archaeological evidences such as metal artifacts, remains of furnaces, iron ores, tuyeres and slags has been used since 3rd-5th CE as a famous international entrepot [1]. The evidence of ancient structure and iron smelting with supporting data from geophysical methods show that Sungai Batu is an oldest civilization that has been recorded in Southeast Asia [2].
Mid-south of Kedah was recorded as marine area in the 1st-2nd century. The changes of geomorphology due to rise in sea level in year 1400 changes the area become landed region [3]. Sediments including rocks, soil, and mineral from weathering process was transported from river and ocean to the lower area, and strongly influenced by the regional geology. The sea level fluctuations are about 2-3 m in 200 years or less based on the historical and geological evidence [4]. Regression of sea level during Late Holocene until present day changes the geomorphology for this area. The mechanism of sea level changes is complex and related to the earth’s rheology, eustasy and isostasy [5,6]. The sea level fall was recorded with the value of 0.7 and 0.5 mm/year for Peninsular Malaysia West and East coasts respectively in mid-Holecene to recent sea level trend [7]. Sungai Batu sedimentation process controls by the depositional process from Sungai Merbok and Malacca Strait. Sediments from Gunung Jerai was transported by Sungai Merbok to lower region with high of turbidity current until it settled down due to gravity factor. The hydrogenous sediments from Malacca Strait are transported due to long shore drift from the tidal current to formed range of landforms. There are several factors controlling the depositional environment in this area which is fluvial discharge including water volume, time variation, river mouth process and also tidal process. The sediments from the near shore or marine are well sorted with fine grained distribution due to current velocity and particle diameter [8].
Resistivity value of unconsolidated sediments from Bering Sea was identify with value of 29.1-71.0 Ohm.cm at 25°C and irregularly increase 11 Ohm.cm in the first meter below the sediment surface [9]. A combination of laboratory analysis and multi-electrode resistivity field experiment for marine sediments status confirms that the multielectrode resistivity method is relevant to estimate the degree and state of sediment consolidation in real-time and in-situ [10]. A geophysical surveys, 2D resistivity imaging and seismic refraction tomography were carried out to identify the sediment depositional origin of Sungai Batu.
Study area
The study location was situated near river and residential area. The geomorphology of this area was flat landed fill with oil palm and rubber trees including streams, rivers and swamps at the eastern part. Sungai Batu area is located at northwestern of Peninsular Malaysia and near to Gunung Jerai and Sungai Merbok. Sungai Merbok is underlain by Mahang formation especially in eastern and southern part [11]. The formation formed in Middle Ordovician to Early Devonian age [12]. The rock unit comprises shale, red slate, grey slate and black slate. Hot and humid climate during a year leads the high chemical weathering to occurs, which changes the shale to soil and laterite [13]. The main mineralogy of rocks is mica and chloride. Black slate contains an abundance of carbon and red slate, consists of high iron oxide [14]. Granitic intrusion causes the rocks of surroundings area become metamorphose to produce schist rocks [12]. Gunung Jerai located at the northern part of study area which recorded as highest mountain and consist of rock cockerel, made of schist rocks with a few layers of quartzite (Figure 1).
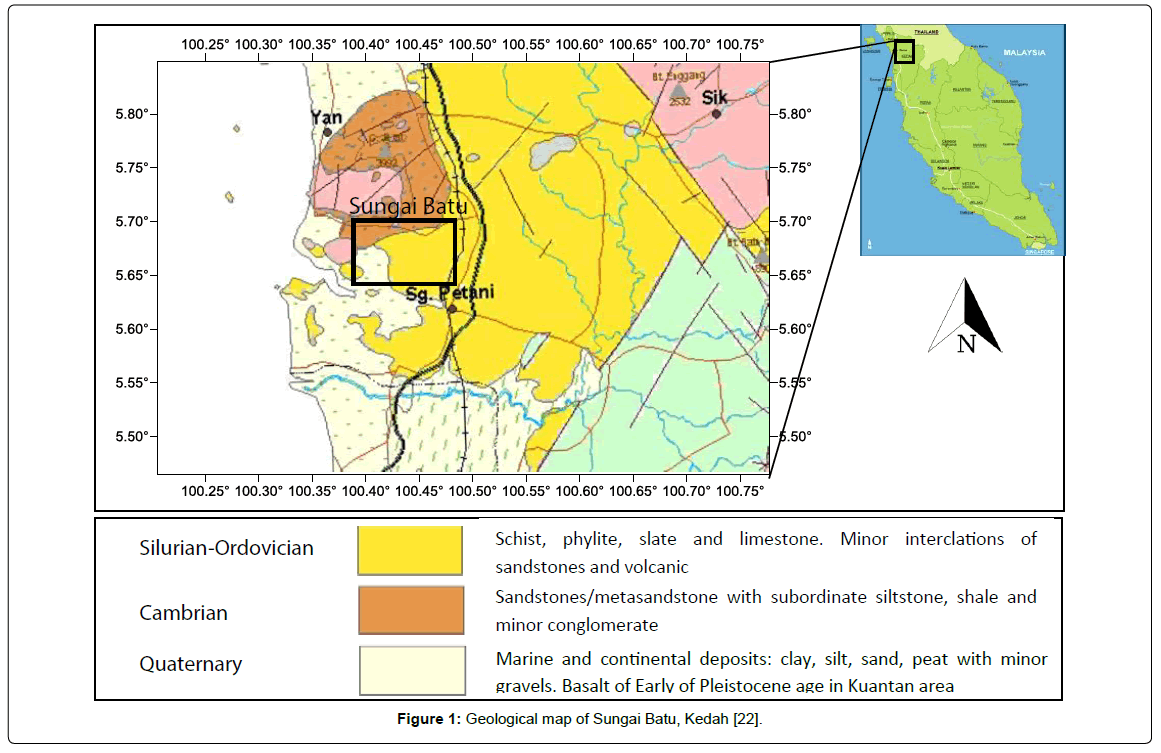
Figure 1: Geological map of Sungai Batu, Kedah [22].
Methodology
2D resistivity imaging method utilizes direct current to investigate electrical properties of subsurface by measuring resistivity distribution of the materials. Electrical resistivity of the materials depends on a combination of ohmic and dielectric effects related to lithology of subsurface [15]. The apparent resistivity, ρa are calculated based on Equation 1.
 (1)
(1)
Where;
V=voltage, I=current, k=geometric factor
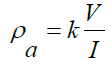
The depth of penetration is also depending on k value. For this survey, Pole-dipole array was used based on the deepest depth penetration beside provides a good resolution. Pole-dipole array is an asymmetrical arrangement which influence the anomalies by giving asymmetrical apparent resistivity. To eliminate the asymmetry affect, reverse measurement also taken (Figure 2).
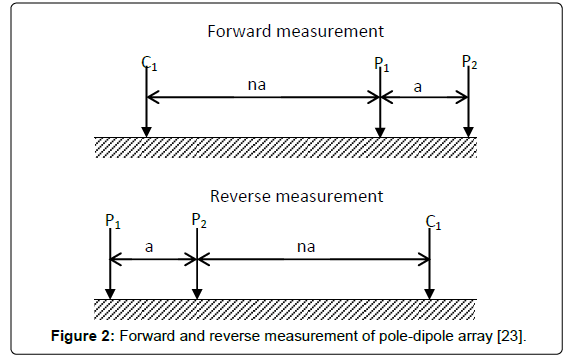
Figure 2: Forward and reverse measurement of pole-dipole array [23].
Rock types such as igneous and metamorphic; typically have high resistivity values depending on degree of fractures. Since water table in Malaysia is generally shallow, the fractures are commonly filled with ground water [16]. High fracturing of rocks will result a lower resistivity values. Table 1 shows the resistivity values of rocks and soil types [17].
| Material | Resistivity (?m) |
|---|---|
| Alluvium | 10-800 |
| Sand | 60-1000 |
| Clay | 1-100 |
| Groundwater (fresh) | 10-100 |
| Sandstone | 8-4 × 10³ |
| Shale | 20-2 × 10³ |
| Limestone | 50-4 × 10³ |
| Granite | 5 × 10³-1 × 10⁶ |
Table 1: Resistivity value of rocks and soil [17].
Seismic refraction tomography is based on determination of time interval that elapses between an initiation of a seismic waves at a certain shot point and the arrival of refracted waves at one or more seismic detector (Figure 3). Seismic refraction tomography uses a wave’s propagation in ground surface which is dependent on the velocity variation in difference medium [18]. The wave return to the surface as refracted waves which are sometimes called head waves [19].
Figure 3: Seismic ray path of direct wave, reflection, and refraction ray [21].
Seismic waves propagate with different velocity when travelling in different geological layer and refracted when they crosses a boundary between different type of geological layer. The thickness and velocity of material above and below an interface can be calculate by determining the arrival times for direct and refracted waves from seismic section. Table 2 shows seismic velocity value varies with mineral content, lithology, porosity, density and degree of compaction [20].
| Material | P-wave velocity (m/s) |
|---|---|
| Air | 332 |
| Water | 1400-1500 |
| Granite | 5500-5900 |
| Sandstone | 1400-4300 |
| Limestone | 5900-6100 |
| Sand (Unsaturated) | 200-1000 |
| Sand (Saturated) | 800-2200 |
| Clay | 1000-2500 |
Table 2: The P-wave velocities of various earth materials [21].
Geophysical survey conducted in this study was 2D resistivity imaging and seismic refraction tomography methods which apply in two study sites (Figure 4).
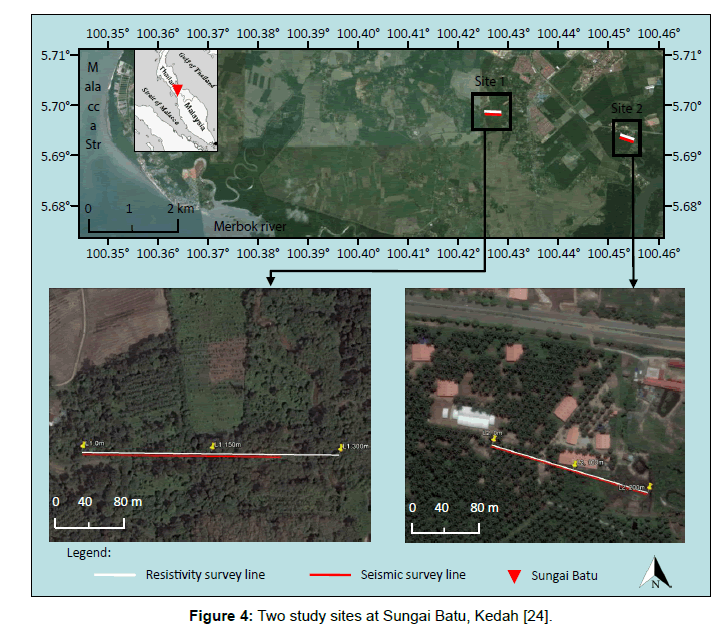
Figure 4: Two study sites at Sungai Batu, Kedah [24].
The 2D resistivity survey used ABEM SAS4000 Terrameter including ES10-64C electrode selector, smart cables, 41 stainless steel electrodes and jumpers. The survey lines are designed in such a way to fulfill study objectives. Line L1 at study site 1 was design with 2.5 m electrode spacing which make the total length of the spread is 100 m. Roll-up techniques was apply on line L1 with 4 times rolling-up with 50 m roll-up interval to make the total length of line L1 is 300 m. Line L2 at study site 2 was design using the same as line L1 of site 1 but applying 2 times rolling-up with 50 m roll-up interval to make the total length of line L2 is 200 m (Figure 5). The survey was performed using Pole-dipole array with remote electrode at 500 m away from each survey line and perpendicular to it. Table 3 shows ABEM SAS4000 Terrameter data acquisition setting used for all survey lines.
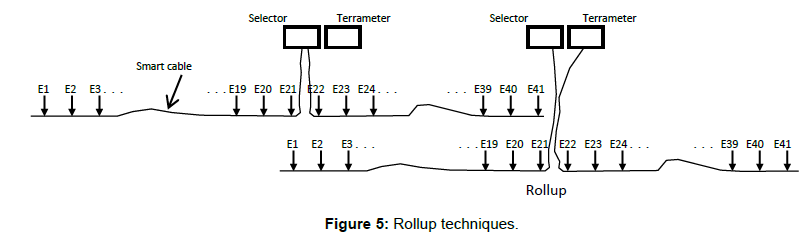
Figure 5: Rollup techniques.
| Function | Setting | Value |
|---|---|---|
| Current | Maximum | 50 mA |
| Minimum | 1 mA | |
| Mode | Auto | - |
| Acquisition delay | - | 0.3 sec |
| Acquisition time | - | 0.3 sec |
| Total cycle time | - | 3 sec |
| Stack | Maximum | 3 |
| Minimum | 1 | |
| Power line frequency | - | 50 Hz |
Table 3: ABEM SAS4000 Terrameter data acquisition setting.
Seismic refraction tomography survey used one unit of ABEM MK8 seismograph, seismic cable with 24 take-out and 24 units of 28 Hz vertical geophones which planted on the ground at 5 m constant geophone spacing. Seismograph setting for data acquisition for line L1 and L2 on site 1 and 2 are the same (Table 4).
| Function | Setting | Value |
|---|---|---|
| View mode | Auto | |
| Scale factor | - | 1 |
| Trace clip | - | 1 |
| Remove DC | On | - |
| Sampling interval (ms) | - | 100 |
| No. of samples | - | 2048 |
| Stack mode | Preview | - |
| Re-arm mode | Manual | - |
Table 4: ABEM MK8 seismograph data acquisition setting.
Line L1 of site 1 is 230 m long and consists of two spreads. The first geophones of spread 1 located at 0 m and the 24th geophone at 115 m; while the first geophone of spread 2 located at 115 m and the 24th geophone at 230 m. Line L2 of site 2 is 200 m long and consists of two spreads. First geophone of spread 1 located at 0 m and 24th geophone at 115 m; while first geophone of spread 2 located at 85 m and 24th geophone at 200 m. Spread 2 was 30 m overlapped with spread 1. Seismic source used for both site was 5 kg sledgehammer with 7 shot points for each spread except spread 2 of line 2 for site 2 (Table 5).
| Site 1 | Site 2 | ||||
|---|---|---|---|---|---|
| Line | Spread | Shot location (m) | Line | Spread | Shot location (m) |
| L1 | 1 | -20 | L2 | 1 | -30 |
| - | - | 2.5 | - | - | 2.5 |
| - | - | 27.5 | - | - | 27.5 |
| - | - | 57.5 | - | - | 57.5 |
| - | - | 87.5 | - | - | 87.5 |
| - | - | 112.5 | - | - | 112.5 |
| - | - | 135 | - | - | 145 |
| - | 2 | 95 | - | 2 | 55 |
| - | - | 117.5 | - | - | 87.5 |
| - | - | 142.5 | - | - | 112.5 |
| - | - | 172.5 | - | - | 142.5 |
| - | - | 202.5 | - | - | 172.5 |
| - | - | 227.5 | - | - | 197.5 |
| - | - | 250 | - | - | - |
Table 5: Seismic shot point location of line L1 and L2.
2D resistivity data were processed using Res2Dinv. ver. 3.56.70 and Surfer8 software while seismic data was processed using FirstPix and Gremix15 (Interpex Limited) software for picking first arrival time, plotting travel time curve and velocity analysis. SeisOpt@2D. ver. 3.5 was used to produce 2D seismic profile tomography cross section. The processed results were plotted in Surfer8 software for correlation and interpretation.
Figure 6 shows 2D resistivity section and seismic refraction profile of line L1 at study site 1. The resistivity profile shows that exploration depth is 25 m with resistivity value of 1-2000 Ohm.m (Figure 6A). A region with resistivity value of >100 Ohm.m indicate a top soil with depth of <5 m. A river bed identified with resistivity value of >300 Ohm.m at depth of 7-25 m. Low resistivity values of 10-50 Ohm.m is interpreted as saturated alluvium (clay and sand) which transported from land. Seismic refraction profile shows the investigation depth is 25 m with velocity value of 300-5600 m/s (Figure 6B). A region with velocity of >3600 m/s at depth of >15 m is interpreted as river bed. Low velocity value of <1400 m/s interpreted as moist/saturated alluvium zone which consist of clay and sand.
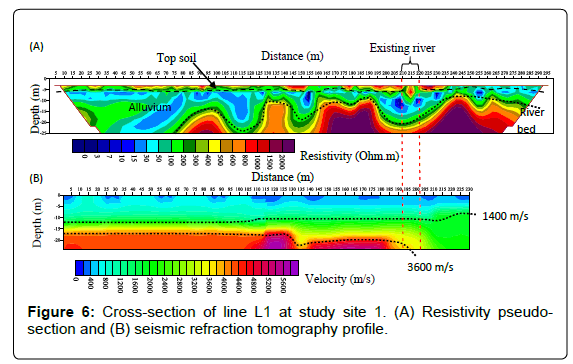
Figure 6: Cross-section of line L1 at study site 1. (A) Resistivity pseudosection and (B) seismic refraction tomography profile.
Figure 7 shows 2D resistivity section and seismic refraction profile of line L2 at study site 2. The resistivity profile (Figure 7A) with resistivity value >300 Ohm.m indicated a river bed at depth of 7-25 m. A region with low resistivity value of 10-50 Ohm.m indicated the presence of saturated alluvium (clay and sand) which transported from land while moist zone was identified with resistivity value of <100 Ohm.m. From seismic profile (Figure 7B), the river bed was identified at velocity of >3600 m/s at depth >10 m while velocity value of <1400 m/s interpreted as moist/saturated alluvium zone which consist of clay and sand.
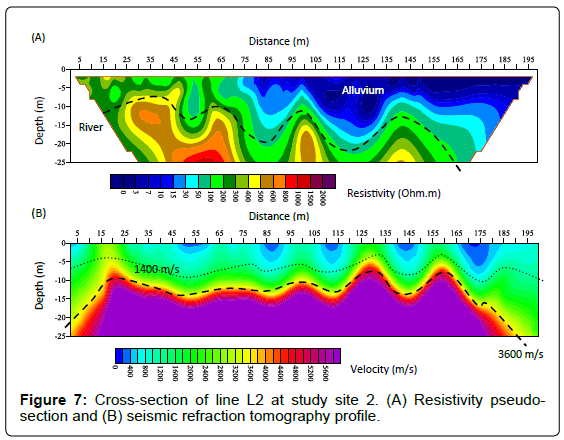
Figure 7: Cross-section of line L2 at study site 2. (A) Resistivity pseudosection and (B) seismic refraction tomography profile.
Top soil of the study areas indicated by resistivity value of >100 Ohm.m is interpreted as loose and dry alluvium. The resistivity value of 10-50 Ohm.m and velocity value of <1400 m/s is interpreted as saturated alluvium (clay and sand) which transported from land and part of it is moist which indicated with resistivity value of <100 Ohm.m. The river bed identified by 2D resistivity imaging and seismic refraction tomography with the value of >300 Ohm.m and >3600 m/s respectively. The correlation of 2D resistivity imaging and seismic refraction tomography show that the depositional environment for this survey is causes by land sediments deposit.
The authors thank the technical staffs of the geophysics laboratory and all geophysics postgraduate students, School of Physics, Universiti Sains Malaysia for their assistance during the data acquisition, and the Centre of Global Archaeological Research (CGAR) Universiti Sains Malaysia for sponsoring the project (1002/ PARKEO/910328).