International Journal of Advancements in Technology
Open Access
ISSN: 0976-4860
ISSN: 0976-4860
Research Article - (2022)Volume 13, Issue 5
Purpose: This paperwork assesses GT application practices problems in XYZ in order to identify the challenges and put the methods to improve GT application practices.
Methods: After the data is collected from the production process through primary and secondary data methods such as questionnaires, interviews, and review of previous research works, analysis has been carried out.
Results: The finding of the paper was grouping the parts into part families by using Rank order clustering (Kings’ Algorithm) and similarity coefficient algorithm and the arrangement of the machines into machine cells, where each machine specializes in one part family.
A unique contribution to theory, practice, and policy: This study will enable to help the management of the company to identify the challenges of GT application practices that exist in the company and how to solve these ineffective practices GT application at XYZ Plc.
Group Technology (GT); GT-application; Production; Production process improvement
The manufacturing activity has become far more competitive than ever almost in all markets [1]. Due to the fastidiousness of customers and technological advancement, manufacturers are forced to rapidly change and develop their manufacturing capabilities to take a major share in the markets competition; this had been made possible through transforming the production system from mass production to the production of a large product mix [2].
Moreover, this rapid advancement in technology tends to render products obsolete far more quickly than before. As a result of this, companies came to realize that developing advanced methodologies for modeling, design, analysis, and performance evaluation, scheduling, and control of these systems is vital for increasing the capacity of producing many small-volume batches consisting of complex parts in a short production period [3].
Resort to this new approach is not as simple as it appears at the first blush, for it brings a host of challenges that not only render the management’s task more cumbersome, but also invite unwanted consequences such as an increase in production cost, and a decrease in efficiency of the mass production systems [4]. One approach which has been proved to be most effective in solving these problems is the adoption of manufacturing philosophy which is known as Group Technology (GT) [5].
GT is generally considered as a manufacturing philosophy or concept based on which certain manufacturing efficiency can easily be improved when part types are identified and collected into groups (known as part families) based on their similarities in design or manufacturing attributes and machines that are required to process the part family into machine-cell [6]. This results in an organization of the production system into self-contained and self- regulated groups of machines such that each group of machines undertakes a maximum production of a family of parts [7].
Such decomposition of the plant operation into subsystems leads to reduced material handling activities, reduction of production lead time and work-in-process inventory, reduction of setup time, reduction of order time delivery, reduction of unnecessary paperwork, and better supervisory control [8].
The implementation of GT practices has long been discussed and many organizations are becoming familiar with the practice and implementation of GT in manufacturing sectors. There are several studies dealing with the implementation of GT [9]. However, there is no emphasis or attention to the implementation of GT application practices in XYZ. In this case, the company can lose time, profit, and dissatisfaction with their customers. Therefore, there are different methods for solving part family grouping (visual inspection, parts classification, coding, and production flow analysis) [10]. Among these methods, the researchers propose Production Flow Analysis (PFA) for the case study to show how to group parts and form parts families. After part families have been identified two common techniques were illustrated which were rank order clustering and direct clustering, these techniques are used to group the machines into cells. Generally, this paper represents an effort toward the successful implementation of the combination of GT with PFA clustering techniques into XYZ.
Group technology is an approach to production system organization that has existed for many decades. The approach results in the cellular organization of machines in production systems. This approach gave many benefits to solving problems like long lead times, large setup times and increased work-inprogress inventories, large inventories of finished goods, poor part quality, and high unit costs [9].
This method is hardly practical as the part number grows and finding the same processing technology steps that are shared by parts. Parts that have the same technological operations can be grouped and include an analysis of material flow in the production system, to reduce the setup time [11]. The biggest obstacle in changing over to group technology from a traditional production shop is the problem of grouping parts and machines into families XYZ [12].
Production Flow Analysis (PFA) is a method for identifying part families and associated machine groupings that use the information contained on production route sheets rather than on part drawings [13]. Work parts with identical or similar routings are classified into part families. These families can then be used to form logical machine cells in a group technology layout. Since PFA uses manufacturing data rather than design data to identify part families, it can overcome two possible anomalies that can occur in parts classification and coding [14].
PFA is a structured technique developed for analyzing the sequence of operations (routings) that parts go through during manufacture. Parts that go through common operations are grouped into part families. Similarly, the machines used to perform these common operations may be grouped as a cell; consequently, this technique can be used in facility layout. Initially, a machine component chart must be formed [9].
This is an M x N matrix, where-
M=Number of machines.
N=Number of parts.
x=1 if part j has an operation on machine i; 0 otherwise.
According to the advantage of using production flow analysis compared to a coding and classification system is that part families can be formed with much less effort [15]. If the coding and classification technique is used, parts are examined and codes are assigned to each part based on the attributes of the parts. These codes can be sorted so that parts with similar codes are grouped as a part family.
Clustering is achieved by the manipulation of matrices depicting the process plans of all the parts that have been produced in the shop. Moreover, it helps to decide which parts have a similar OP code sequence [2]. Some of the most popular clustering methods are:
• Rank-order clustering,
• Direct clustering
• Single–linkage clustering algorithm.
Several studies have reported various improved GT application practices in the manufacturing industry through different algorithms; like rank-order clustering [16-18] ergonomics cellular manufacturing [19], direct clustering [20], single–linkage clustering [21], string diagram algorithm [8], etc. to improve the practical application of GT in the manufacturing sectors.
However, identifying the challenges and putting the methods to improve GT application practices by using Rank order clustering (Kings’ Algorithm) and similarity coefficient algorithm have not been emphasized by the existing literature. As the result, it is difficult for many industries to optimize their grouping of parts into part families and arrangement of machines into machine cells, where each machine specializes in one part family [22] (Table 1).
| SN | Type of the machine | Grades |
|---|---|---|
| 1 | Labeling | A |
| 2 | Milling machine | B |
| 3 | Mixer | C |
| 4 | Disperser | D |
| 5 | Bead mills reactors | E |
| 6 | Packing | F |
Table 1: Type of the machine.
Assessed the implementation of GT application in Ethiopian metal and engineering corporation and identified that the performance of the company is low when compared with best practices due to, material, method, and process productivity factors [23,24]. It is noted that none of the previous research works have addressed GT application practices problems specific to paint companies on a broader scale to provide appropriate solutions. Hence, there is a need to make an in-depth study to identify the GT application associated problems in the sector (Table 2).
| SN | Major products of the company |
|---|---|
| 1 | Primer paints |
| 2 | Emulsion paints |
| 3 | Flat finish |
| 4 | Varnish and shellac |
| 5 | Wood stain |
| 6 | Roof coating |
| 7 | Road marking paints |
| 8 | Pearl (satin) finish |
| 9 | Semi-gloss finish |
| 10 | High gloss finish |
| 11 | Enamel paint |
| 12 | Anti-climb paint |
| 13 | Anti-fouling paint |
| 14 | Insulating paint |
Table 2: Major products of the company.
There has been tremendous work done by various researchers on cell formation techniques. The majority of the published works on group technology (GT) pay very little attention to manufacturing activities of cellular manufacturing. Many current GT applications are running in a non-optimal environment and their performance could be improved by optimizing the parameters. But this paper gives some details about the advantages of group technology in the process of making a product (Table 3).
| SN | Major products of the company | Machines | |||||
|---|---|---|---|---|---|---|---|
| A | B | C | D | E | F | ||
| 1. | Primer paints | 1 | 1 | 1 | |||
| 2. | Emulsion paints | 1 | 1 | 1 | |||
| 3. | Flat finish | 1 | 1 | 1 | |||
| 4. | Varnish and shellac | 1 | 1 | 1 | 1 | 1 | 1 |
| 5. | Wood stain | 1 | 1 | 1 | |||
| 6. | Roof coating | 1 | 1 | 1 | |||
| 7. | Road marking paints | 1 | 1 | 1 | |||
| 8. | Pearl (satin) finish | 1 | 1 | 1 | 1 | ||
| 9. | Semi-gloss finish | 1 | 1 | 1 | |||
| 10. | High gloss finish | 1 | 1 | 1 | |||
| 11. | Enamel paint | 1 | 1 | 1 | 1 | 1 | |
| 12. | Anti-climb paint | 1 | 1 | 1 | 1 | 1 | 1 |
| 13. | Anti-fouling paint | 1 | 1 | 1 | 1 | 1 | 1 |
| 14. | Insulating paint | 1 | 1 | 1 | 1 | 1 | |
Table 3: Manufactured products and grouping of machines.
In order to identify the problems of the GT application practices in manufacturing sectors [22], identified that the productivity and competitiveness of the Ethiopian culture clothes companies are not satisfactory in the global and international market due to poor quality of raw materials, backward technology, and lack of skilled personnel. Assessed the implementation of GT application in Ethiopian metal and engineering corporation and identified that the performance of the company is low when compared with best practices due to, material, method, and process productivity factors. It is noted that none of the previous research works have addressed GT application practices problems specific to paint companies on a broader scale to provide appropriate solutions. Hence, there is a need to make an in-depth study to identify the GT application associated problems in the sector (Table 4). Therefore, this paper focuses on the minimization of GT application challenges and problems due to the implementation of GT application in any paint sector by using different methods (Table 5).
| SN | Machines | ||||||||
|---|---|---|---|---|---|---|---|---|---|
| Binary values | 25 | 24 | 23 | 22 | 21 | 20 | Dec. equivalent. | Rank | |
| Major products | A | B | C | D | E | F | |||
| 1. | Primer paints | 1 | 1 | 1 | 41 | 7 | |||
| 2. | Emulsion paints | 1 | 1 | 1 | 41 | 8 | |||
| 3. | Flat finish | 1 | 1 | 1 | 41 | 9 | |||
| 4. | Varnish and shellac | 1 | 1 | 1 | 1 | 1 | 1 | 63 | 1 |
| 5. | Wood stain | 1 | 1 | 1 | 41 | 10 | |||
| 6. | Roof coating | 1 | 1 | 1 | 41 | 11 | |||
| 7. | Road marking paints | 1 | 1 | 1 | 41 | 12 | |||
| 8. | Pearl (satin) finish | 1 | 1 | 1 | 1 | 43 | 6 | ||
| 9. | Semi-gloss finish | 1 | 1 | 1 | 41 | 13 | |||
| 10. | High gloss finish | 1 | 1 | 1 | 41 | 14 | |||
| 11. | Enamel paint | 1 | 1 | 1 | 1 | 1 | 47 | 5 | |
| 12. | Anti-climb paint | 1 | 1 | 1 | 1 | 1 | 1 | 63 | 2 |
| 13. | Anti-fouling paint | 1 | 1 | 1 | 1 | 1 | 1 | 63 | 3 |
| 14. | Insulating paint | 1 | 1 | 1 | 1 | 1 | 59 | 4 | |
Table 4: Weight of row calculation and ranking.
| SN | Machines | ||||||||
|---|---|---|---|---|---|---|---|---|---|
| Binary values | 25 | 24 | 23 | 22 | 21 | 20 | Dec. equivalent. | Rank | |
| Major products | A | B | C | D | E | F | |||
| 1. | Varnish and shellac | 1 | 1 | 1 | 1 | 1 | 1 | 63 | 1 |
| 2. | Anti-climb paint | 1 | 1 | 1 | 1 | 1 | 1 | 63 | 2 |
| 3. | Anti-fouling paint | 1 | 1 | 1 | 1 | 1 | 1 | 63 | 3 |
| 4. | Insulating paint | 1 | 1 | 1 | 1 | 1 | 59 | 4 | |
| 5. | Enamel paint | 1 | 1 | 1 | 1 | 1 | 47 | 5 | |
| 6. | Pearl (satin) finish | 1 | 1 | 1 | 1 | 43 | 6 | ||
| 7. | Primer paints | 1 | 1 | 1 | 41 | 7 | |||
| 8. | Emulsion paints | 1 | 1 | 1 | 41 | 8 | |||
| 9. | Flat finish | 1 | 1 | 1 | 41 | 9 | |||
| 10. | Wood stain | 1 | 1 | 1 | 41 | 10 | |||
| 11. | Roof coating | 1 | 1 | 1 | 41 | 11 | |||
| 12. | Road marking paints | 1 | 1 | 1 | 41 | 12 | |||
| 13. | Semi-gloss finish | 1 | 1 | 1 | 41 | 13 | |||
| 14. | High gloss finish | 1 | 1 | 1 | 41 | 14 | |||
Table 5: Put in descending order relying on the weight of row.
To accomplish this paper different data collection techniques were used i.e. primary and secondary data collection methods; such as questionnaires, interviews, personal observations, and review of companies’ daily records were used to assess the application of GT-related problems of the company. Finally, the collected data was interpreted through a descriptive method of data analysis using Ms–excel, rank order clustering (Kings’ Algorithm), and similarity coefficient algorithm.
As we perceive from the respondent rate, there are no more practices of GT application in the company and there is a gap in awareness of GT purpose in manufacturing company. Depending on this information we will try to solve the problems that happen to the lack of GT application practices in the company by using the rank ordering clustering algorithm (kings’ algorithm). In this section, the rank ordering of factories’ parts and machines are presented. Based on the process of the parts through machines, first, the part machine matrix is developed and then other steps of the rank-ordering algorithm are followed as (Table 6).
| SN | Major products | Machines | B.V | |||||
|---|---|---|---|---|---|---|---|---|
| A | C | F | E | D | B | |||
| 1. | Primer paints | 1 | 1 | 1 | 213 | |||
| 2. | Emulsion paints | 1 | 1 | 1 | 212 | |||
| 3. | Flat finish | 1 | 1 | 1 | 211 | |||
| 4. | Varnish and shellac | 1 | 1 | 1 | 1 | 1 | 1 | 210 |
| 5. | Wood stain | 1 | 1 | 1 | 29 | |||
| 6. | Roof coating | 1 | 1 | 1 | 28 | |||
| 7. | Road marking paints | 1 | 1 | 1 | 27 | |||
| 8. | Pearl (satin) finish | 1 | 1 | 1 | 1 | 26 | ||
| 9. | Semi-gloss finish | 1 | 1 | 1 | 25 | |||
| 10. | High gloss finish | 1 | 1 | 1 | 24 | |||
| 11. | Enamel paint | 1 | 1 | 1 | 1 | 1 | 23 | |
| 12. | Anti-climb paint | 1 | 1 | 1 | 1 | 1 | 1 | 22 |
| 13. | Anti-fouling paint | 1 | 1 | 1 | 1 | 1 | 1 | 21 |
| 14. | Insulating paint | 1 | 1 | 1 | 1 | 1 | 20 | |
| Dec. equivalent. | 16383 | 16383 | 16383 | 1103 | 1038 | 1031 | ||
| Rank | 1 | 2 | 3 | 4 | 5 | 6 | ||
Table 6: Weight of column calculation and ranking.
To apply the group technology approach, the first step is to identify parts and group the parts into part families. There are different methods and algorithms used to group the parts into part families, but for this study, we select Rank-Order clustering, and Single–Linkage Clustering Algorithms. The reasons that we select this approach are; the approach uses manufacturing data, which fits the data that we collect from factories which is processrelated, the process of the parts to pre-arranged machines, the other reason is it uses the information contained on production route sheets rather than on part drawings. Clustering is achieved by the manipulation of matrices depicting the process plans of all the parts that have been produced in the shop. Some of the most popular clustering methods are [13] (Table 7).
| SN | Major products | Machines | B.V | |||||
|---|---|---|---|---|---|---|---|---|
| A | C | F | E | D | B | |||
| 1. | Primer paints | 1 | 1 | 1 | 213 | |||
| 2. | Emulsion paints | 1 | 1 | 1 | 212 | |||
| 3. | Flat finish | 1 | 1 | 1 | 211 | |||
| 4. | Varnish and shellac | 1 | 1 | 1 | 1 | 1 | 1 | 210 |
| 5. | Wood stain | 1 | 1 | 1 | 29 | |||
| 6. | Roof coating | 1 | 1 | 1 | 28 | |||
| 7. | Road marking paints | 1 | 1 | 1 | 27 | |||
| 8. | Pearl (satin) finish | 1 | 1 | 1 | 1 | 26 | ||
| 9. | Semi-gloss finish | 1 | 1 | 1 | 25 | |||
| 10. | High gloss finish | 1 | 1 | 1 | 24 | |||
| 11. | Enamel paint | 1 | 1 | 1 | 1 | 1 | 23 | |
| 12. | Anti-climb paint | 1 | 1 | 1 | 1 | 1 | 1 | 22 |
| 13. | Anti-fouling paint | 1 | 1 | 1 | 1 | 1 | 1 | 21 |
| 14. | Insulating paint | 1 | 1 | 1 | 1 | 1 | 20 | |
| Dec. equivalent. | 16383 | 16383 | 16383 | 1103 | 1038 | 1031 | ||
| Rank | 1 | 2 | 3 | 4 | 5 | 6 | ||
Table 7: Descending order relies on the weight of the column.
• Rank-order clustering
• Single–linkage clustering algorithm
Rank-order clustering method
The Rank-Order Clustering (ROC) technique is specifically applicable in production flow analysis. It is an efficient and easyto- use algorithm for grouping machines into cells (Table 8).
| SN | Major products Activities | Machines | ||||||
|---|---|---|---|---|---|---|---|---|
| Group 1 | A | C | F | E | D | B | ||
| 1. | Varnish and shellac | 1 | 1 | 1 | 1 | 1 | 1 | |
| 2. | Anti-climb paint | 1 | 1 | 1 | 1 | 1 | 1 | |
| 3. | Anti-fouling paint | 1 | 1 | 1 | 1 | 1 | 1 | |
| 4. | Insulating paint | 1 | 1 | 1 | 1 | 1 | 1 | |
| 5. | Enamel paint | 1 | 1 | 1 | 1 | 1 | ||
| 6. | Pearl (satin) finish | 1 | 1 | 1 | 1 | |||
| 7. | Primer paints | 1 | 1 | 1 | Group 2 | |||
| 8. | Emulsion paints | 1 | 1 | 1 | ||||
| 9. | Flat finish | 1 | 1 | 1 | ||||
| 10. | Wood stain | 1 | 1 | 1 | ||||
| 11. | Roof coating | 1 | 1 | 1 | ||||
| 12. | Road marking paints | 1 | 1 | 1 | ||||
| 13. | Semi-gloss finish | 1 | 1 | 1 | ||||
| 14. | High gloss finish | 1 | 1 | |||||
Table 8: Relation matrix after weight of column and row.
The steps required for developing the rank order clustering algorism are:
Step: 1. Calculate the total weight of each column, 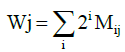
Step: 2. Arrange columns by ascending weight,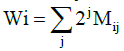
Step: 3. Calculate the total weight of each row,
Step: 4. If rows are in ascending order by weight, stop. Else arrange rows by ascending weight, go to step 1.
There are different types of machines used in manufacturing paints in XYZ.
Single-linkage clustering (similarity coefficient) algorithm
A similarity coefficient is calculated for each pair of machines to determine how “alike” two machines are in terms of:
• The number of parts that visit both machines.
• The number of parts that visit each machine.
Similarity coefficient
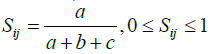
Sij=similarity coefficient between machine i and j.
Where: a=part visits both machines.
b=part visits machine j, but not i.
c=part visits machine j, but not i.
d=part does not visit either machine j or machine i.
This is the similarity coefficient matrix among the machines or 6 rows by 6 rows machines represent. A similarity coefficient indicates the degree of similarity between the machine pairs (Table 9). As per the result of the above rank order clustering, the following machine cells and part families are organized for the selected products and the available functional machine tools in factories (Figures 1-3). The result obtained from the data analyzed is displayed below the sequence of cell machines by using the kings’ algorithm (Table 10). And when we indicate the overall sequence of machines mentioned above. Results of similarity coefficient or Single-Linkage Cluster Algorithm (SLCA) (Figure 4).
| SN | Major products of the company | Machines | |||||
|---|---|---|---|---|---|---|---|
| A | B | C | D | E | F | ||
| 1 | Primer paints | 1 | 1 | 1 | |||
| 2 | Emulsion paints | 1 | 1 | 1 | |||
| 3 | Flat finish | 1 | 1 | 1 | |||
| 4 | Varnish and shellac | 1 | 1 | 1 | 1 | 1 | 1 |
| 5 | Wood stain | 1 | 1 | 1 | |||
| 6 | Roof coating | 1 | 1 | 1 | |||
| 7 | Road marking paints | 1 | 1 | 1 | |||
| 8 | Pearl (satin) finish | 1 | 1 | 1 | 1 | ||
| 9 | Semi-gloss finish | 1 | 1 | 1 | |||
| 10 | High gloss finish | 1 | 1 | 1 | |||
| 11 | Enamel paint | 1 | 1 | 1 | 1 | 1 | |
| 12 | Anti-climb paint | 1 | 1 | 1 | 1 | 1 | 1 |
| 13 | Anti-fouling paint | 1 | 1 | 1 | 1 | 1 | 1 |
| 14 | Insulating paint | 1 | 1 | 1 | 1 | 1 | |
Table 9: Coefficient analysis of machines among manufactured products.
| A | B | C | D | E | F | |
| A | ---- | 0.29 | 1 | 0 | 0 | 1 |
| B | ---- | 0 | 1 | 1 | 0 | |
| C | ---- | 0 | 0 | 1 | ||
| D | ---- | 0 | 0 | |||
| E | ---- | 0 | ||||
| F | ---- |
Note: As per the result of the above Rank Order Clustering (ROC), the following machine cells.
Table 10: Similarity matrix of machines.

Figure 1: Group-one clustering cell.

Figure 2: Group-two clustering cells.

Figure 3: Group-three clustering cell.

Figure 4: Dendrogram.
Note: Results of similarity coefficient or Single-Linkage Cluster
Algorithm (SLCA).
As we perceive from the similarity coefficient value of the above table, the sc of ACF- the cell machine was one, therefore the similarity of these machines is high regarding the operation sequence of products. And for others is the same fashion as these clustering (Table 11). In addition, a successful group technolo gy program provides many benefits that are difficult to quantify, such as simplification of the manufacturing environment, improvement of the work environment, better quality, improved product designs, and also reducing the manufacturing lead or setup time.
| Clustering | Machines | High similarity coefficient value |
|---|---|---|
| 1 | AC | 1 |
| 2 | AF | 1 |
| 3 | CF | 1 |
| 4 | BE | 0.67 |
| 5 | EF | 0.43 |
| 6 | DE | 0.33 |
Table 11: Similarity matrix of machines.
Group Technology (GT) is a manufacturing philosophy in which parts having similar (geometry or manufacturing process) are grouped to achieve a higher level of integration between the design and manufacturing functions of a firm. GT achieves advantages based on these similarities. Similar parts are arranged into part families. Each family possesses similar design and manufacturing characteristics. Efficiencies result from reduced setup times, lower in-process inventories, better scheduling, improved quality, improved tool control, and the use of standardized process plans.
For instance, XYZ is one of the early established local manufacturing industries, which is in great difficulty settling with the competition, due to its high production cost, delayed delivery, low product quality, etc. However, as per the result of this study, if this factory properly implements the application of GT practices based on parts coding and clustering, the product manufacturing time will be reduced, the material handling cost also reduced and the setup time, as well as throughput time, will be reduced.
Generally from the overall contents of the literature survey and the results of the case study, we can conclude that introducing and implementing a GT-based manufacturing system in local manufacturing industries, will bring an extensive improvement to their manufacturing cost, product quality, and delivery time.
Citation: Temesgen W, Dugassa E, Lemma N (2022) Application Assessment of Group Technology Practices in the Manufacturing Industry. Int J Adv Technol.13:190.
Received: 26-May-2022, Manuscript No. IJOAT-22-17640; Editor assigned: 01-Jun-2022, Pre QC No. IJOAT-22-17640 (PQ); Reviewed: 15-Jun-2022, QC No. IJOAT-22-17640; Revised: 22-Jun-2022, Manuscript No. IJOAT-22-17640 (R); Published: 29-Jun-2022 , DOI: 10.35248/0976-4860.22.13.190
Copyright: © 2022 Temesgen W, et al. This is an open-access article distributed under the terms of the Creative commons attribution license, which permits unrestricted use, distribution, and reproduction in any medium, provided the original author and source are credited