Biochemistry & Pharmacology: Open Access
Open Access
ISSN: 2167-0501
ISSN: 2167-0501
Research Article - (2014) Volume 3, Issue 4
STAMP genes STAMP1/STEAP2 and STAMP2/STEAP4 are expressed in androgen receptor positive-prostate cancer cell line LNCaP, and this regulation was reported, previously. The androgen induction was done at LNCaP cells. STAMP2/STEAP4 was silenced for 1, 2 and 5 days. Using real-time RT-PCR, an apoptosis panel including proapoptotic and/or apoptotic genes was investigated for gene expression alterations in STAMP expressing LNCaP cells in comparison to P53-null PC3 cells in which STAMP2 gene was transfected. In addition, promoter region of the STAMP2 gene was analyzed and putative p53 and androgen receptor (AR) response elements were identified. Thus, p53 gene was silenced using siRNA approach and was induced by hydrogen peroxide. Taken together, prostate-specific STAMP2 gene and its regulation with the p53- and caspase-related pathway was characterized. These results will shed light on understanding the control of proliferation in neoplastic transformation in prostate cancer.
<Keywords: PC3 Cells, Cell Lysis, Cell culture, STAMP2 silencing
AR= androgen receptor, H2O2: hydrogen peroxide, STEAP4/ STAMP2/TIARP= six-transmembrane epithelial antigen of prostate 4/ six-transmembrane protein of prostate 2/tumor necrosisalpha induced adipose-related protein
The effect of androgens are mediated by AR in prostate, therefore, most of the studies focus on identification of AR regulated (target) genes that might be highly expressed in the prostate tissue and its cancer. STAMP genes STAMP1/STEAP2 [1] and STAMP2/STEAP4 are expressed in androgen receptor positive-prostate cancer cell line LNCaP and their androgen receptor-mediated regulation was reported previously [2]. Their role in metabolic disease and essential position of STAMP2 for prevention of excessive inflammation were also reported in mice studies [3]. STAMP2/ TIARP expression induction with interleukin-1-beta was also demonstrated for the first time especially in human adipocyte cell model [4]. Another member of the STAMP family includes pHyde, a rat protein that has been implicated kin apoptosis of prostate cancer cells [5]. Its human homologue TSAP6/ STEAP3 is a p53-inducible gene, which was involved in apoptosis and the cell cycle in prostate cancer and in HeLa cells [6]. Studies reported that STAMP family members have metalloreductase activities associated with iron and copper uptake into HEK293T cells [7], though mentioned activities have not been shown for prostate cells, yet.
Well-known example of six transmembrane domain containing protein studies such as MDR proteins interfere with the treatment of various cancers [8].
Activation of extracellular signal-regulated kinase (ERK), which had previously been implicated in prostate cancer progression, was downregulated with STAMP1 knockdown in LNCaP cells [9].
In our study, growth kinetics of PC3 cells were determined using Trypan blue exclusion assay after transient STAMP1-3 expressions in comparison to controls. Furthermore, using real-time RT-PCR, an apoptosis panel was investigated for gene expression alterations in STAMP expressing LNCaP cells in comparison to cells in which STAMP genes were silenced using siRNA approach.
In addition, promoter region of the STAMP genes were analyzed and putative androgen receptor (AR) and p53 response elements were identified at the promoter region of STAMP2 gene.
Taken together, prostate-specific STAMP2 gene and its regulatory role on the caspase-related pathways were characterized.
Cell culture
Cell lines were cultured in DMEM (GIBCO, USA) or RPMI 1640 (GIBCO) with 5% and 10% fetal bovine serum for PC3 and LNCaP cells, respectively. 1% L-glutamine and 1U/ml of each penicillin/ streptomycin was used. Cells were incubated at 37°C and 5% CO2 in a humidified atmosphere.
Primer Design, Plasmid Constructs and Transfections
Full-length open reading frame of STAMP2 was amplified by primers (10 pmol of each), designed using Light Cycler Probe Design Software 2 (Roche, Germany). The PCR product was cloned into pcDNA4-HisMax-TOPO (Invitrogen, USA) vector according to the manufacturer’s recommendations. Inserts were verified by PCR amplifications. All transfections including siRNA were performed using FuGENE HD (Roche, Germany) transfection reagent according to the manufacturer’s recommendations. Briefly, cells were seeded in 6-well plates one day prior to transfection. Next day, the transfection solution was prepared in a 1.5 ml tube by using 100 μl of prewarmed DMEM or RPMI without antibiotics and 1 μg of pcDNA4-HisMax plasmid DNA was added to incubate at RT for 5 min. When 3 μl of FuGENE HD transfection reagent was added into the mixture, transfection mix was added on cells drop-wise after incubating for 15 min at room temperature.
siRNA mediated knockdown of STAMP2
LNCaP cells were transfected with scrambled-control, STAMP2 or specific siRNA, purchased from Santa Cruz Biotechnology Inc. (Bergheimer, Germany). The sequences were provided by the manufacturer, labeled as below sc-37007 for control, sc-29435 for (h), sc-89820 for STAMP2 siRNA(h) 100 pmol of siRNA (final conc. 50nM) was used to transfect cells with 10 μl Fugene HD (Roche, Germany) and incubated for 1,2 and 4 days for and 5 days for STAMP2, respectively according to the manufacturer’s recommendations.
Apoptosis panel primer couples for real-time RT-PCR were given in Table 1.
| GeneBank/ Symbol | Description | Gen Name | Primers | |
|---|---|---|---|---|
| NM_004322 | BCL2-antagonist of cell death | BBC2/BCL2L8 | Forward | AGGATCCGTGCTGTCTCCTTTG |
| BAD | Reverse | CAAAACTTCCGATGGGACCAAG | ||
| NM_001188 | BCL2-antagonist /killer 1 | BAK/BCL2L7 | Forward | GGGTGTAGATGGGGGAACTGTG |
| BAK1 | Reverse | AAGACCCTAGGCTGTGCCCAAT | ||
| NM_138578 | BCL2-like 1 | BCL-X/BCL-XL | Forward | GTGTGAGGAGCTGCTGGCTTG |
| BCL2L1 | Reverse | AGCATCAGGCCGTCCAATCTC | ||
| NM_001205 | BCL2/adenovirus E1B 19kDa interacting protein 1 | NIP1/TRG-8 | Forward | CAGGTTGGATGGAACACAGTGC |
| BNIP1 | Reverse | ATCCCAATGCCAGACCTTCCTC | ||
| NM_032982 | Caspase 2, apoptosis-related cysteine protease | CASP-2/ICH-1L | Forward | TCTCCCATGGTCCCTAGCAAAA |
| CASP2 | Reverse | AAGGCTCACAAACCACCCAAAC | ||
| NM_001227 | Caspase 7, apoptosis-related cysteine protease | CMH-1/ICE-LAP3 | Forward | AAGTGAGGAAGAGTTTATGGCAAA |
| CASP7 | Reverse | CCATCTTGAAAACAAAGTGCCAAA | ||
| NM_001229 | Caspase 9, apoptosis-related cysteine protease | APAF-3/APAF3 | Forward | TCCTGAGTGGTGCCAAACAAAA |
| CASP9 | Reverse | AGTGGTTGTCAGGCGAGGAAAG | ||
| NM_005157 | V-abl Abelson murine leukemia viral oncogene homolog 1 | ABL/C-ABL | Forward | GGCCTTGAAGACAGAGCAAAGC |
| ABL1 | Reverse | GGAAGGGACCAGTACCTCATGG | ||
| NM_005163 | V-akt murine thymoma viral oncogene homolog 1 | PKB/PRKBA | Forward | TCCCCCTCAGATGATCTCTCCA |
| AKT1 | Reverse | CGGAAAGGTTAAGCGTCGAAAA | ||
| NM_005427 | Tumor protein p73 | P73 | Forward | AGCAGCCCATCAAGGAGGAGTT |
| TP73 | Reverse | TCCTGAGGCAGTTTTGGACACA | ||
| NM_000546 | Tumor protein p53 (Li-Fraumeni syndrome) | CYS51STOP/P53 | Forward | AGATGGGGTCTCACAGTGTTGC |
| TP53 | Reverse | ATGTTGACCCTTCCAGCTCCAC | ||
| NM_078467 | Homo sapiens cyclin-dependent kinase inhibitor 1A | CDKN1A | Forward | GGCAGACCAGCATGACAGATT |
| P21 | Reverse | GCGGCCAGGGTATGTACATGA | ||
| NM_002392 | Homo sapiens Mdm2, transformed 3T3 cell double minute 2 | HDMX/MGC71221 | Forward | GGGTTCGCACCATTCTCCTG |
| MDM2 | Reverse | GGCAGATGACTGTAGGCCAAGC | ||
| NM_016335 | Homo sapiens proline dehydrogenase (oxidase) 1 | PIG6/HSPOX2 | Forward | TTTTTCACCCCACACTTGCAGA |
| PRODH | Reverse | TGTCCCAGGCAGGTATCAGGTT | ||
| NM_001101 | Homo sapiens actin, beta | PS1TP5BP1, beta-actin | Forward | CAATGTGGCCGAGGACTTTGAT |
| ACTB | Reverse | AGTGGGGTGGCTTTTAGGATGG | ||
| NM_002046 | Homo sapiens glyceraldehyde 3-phosphate dehydrogenase | G3PD, GAPD | Forward | CATTGCCCTCAACGACCACTTT |
| GAPDH | Reverse | GGTGGTCCAGGGGTCTTACTCC | ||
Table 1: Gene List and Primers of Apoptosis Panel Taken to Real-Time PCR (LC480, Roche) this table lists the names of genes with GenBank reference sequences from National Center for Biotechnology Information (RefSeq) accession numbers and forward and reverse primers used in the quantitative RT-PCR assay.
Real-time PCR was carried out using a Light Cycler® 480 (Roche Diagnostics, USA) instrument and Light Cycler 480 SYBR Green 1 Master (Roche Diagnostics, USA) kit. Briefly, reactions were performed in a 20-μl volume with 5 pmol of each primer and 1 μl of cDNA template derived from reverse-transcribed RNA of untreated ethanol (control) and hydrogen peroxide treated cells. Homo sapiens glyceraldehyde 3-phosphate dehydrogenase (GAPDH) housekeeping gene was used as endogenous control and reference gene for relative quantifications. The same thermal profile was optimized for all primers: a preincubation for 5 min at 95°C 1 cycle, followed by 40 amplification cycles of denaturation at 95°C for 10 sec, primer annealing at 64°C 20 sec, and primer extension at 72°C for 10 sec. H2O was included as a no-template control. Melting curves were derived after 40 cycles by a denaturation step at 95°C for 10 sec, followed by annealing at 65°C for 15 sec, and a temperature rise to 95°C with a heating rate of 0.1°C/s and continuous fluorescence measurement. Final cooling was performed at 37°C for 30 s. Melting curve analyses of each sample were done using Light Cycler 480 Software version LCS480 (Roche Diagnostics, USA). The analysis step of relative quantification is a fully automated process done by the software, with the efficiency set at 2 and the cDNA of untreated cells defined as the calibrator. All experiments were done in triplicates.
Cell Lysis, Protein Extraction and Chromatin Immunoprecipitation (ChIP)
For protein extraction, cells were grown on 60 mm culture dishes (Orange, Italy) and washed once with PBS prior to cell lysis. Cells were resuspended in 250 μl of modified RIPA lysis buffer [10 mM Tris-Cl (pH:8.0), 1% Triton X-100, 0,1% SDS, 0,1% Na deoxycholate, 1mM EDTA, 1mM EGTA, 140mM NaCl] containing protease and phosphatase inhibitors. Cells were collected from culture plates using a cell scraper and transferred to Eppendorf tubes. Cleared lysates were collected after incubation on ice and mixing every 10 min. for 1 hr as well as centrifugation at 13000 g for 30 min. The protein concentration was determined using a Q-BIT quantitation assay (Invitrogen) where appropriate. SDS–PAGE and western blots were performed under standard conditions using 20 μg of lysate per lane. Proteins were separated on a 10% gel and transferred to a PVDF membrane (Amersham, UK) by a semidry transfer blotter (VWR). The PVDF membrane was blocked with 5% dry milk in PBS-T (phosphatebuffered saline solution containing 0.1% Tween 20) for 1hr. Primary and secondary antibody incubations were performed overnight at 4°C using PBS-T containing 0.5% dry milk. The membranes were developed using the ECL plus reagent (Amersham, UK) for 5min and photographed with a chemiluminesence FX7 dark room camera (Vilbert L11ourmat, France). The primary antibodies were purchased from Sigma (Germany) and Santa Cruz Biotechnology Inc. (Bergheimer, Germany), respectively. We adapted a methodology involving formaldehyde-induced protein-DNA crosslinking and chromatin immunoprecipitation to LNCaP cells. Briefly, cells were fixed with formaldehyde and lysed, and chromatin was fragmented by sonication (Bandelin Electronic, Berlin, Germany) 3 times for 10 sec at 45% power to generate DNA with approximate lengths of 500-1000 bp. Chromatin immunoprecipitations were performed using 2 ug protein samples with the mouse antibody (sc-81168) rotating at 4°C O.N., and the immunocomplexes were collected by ChIP-Grade Protein A/G PLUS Agarose Beads (sc-2003). After the reversal of the protein-DNA crosslinks, the DNA is purified using DNA purification spin columns (ZymoResearch, Irvine, USA) to allow for an easy and efficient recovery of DNA and removal of protein contaminants without the need for phenol/chloroform extraction and ethanol precipitations. The enrichment of particular DNA sequences during immunoprecipitation was analyzed by Advanced GC-Rich sequence PCR amplifications (Clontech, CA, USA) using specific primers to binding sites at STAMP2 promoter region.
PC3 cells transfected with STAMP constructs (STAMP1, 2 and 3 versus HisMax-vector)
STAMP/STEAP genes transfection caused gradual growth in bone metastasis of prostate cancer cell line-PC3 cells. Following the day of the transfection done with FuGene HD transfection reagent, cells were taken to 12-well plates as 104 cells per well and dead cells were counted by trypan-blue exclusion assay beginning at day 2 until 12. Six time points were taken that assayed as n=7 per point and growth kinetics were drawn (Figure 1). It was shown that STAMP3 transfection caused relatively lower growth increase compare to control group in the transfected cell group.
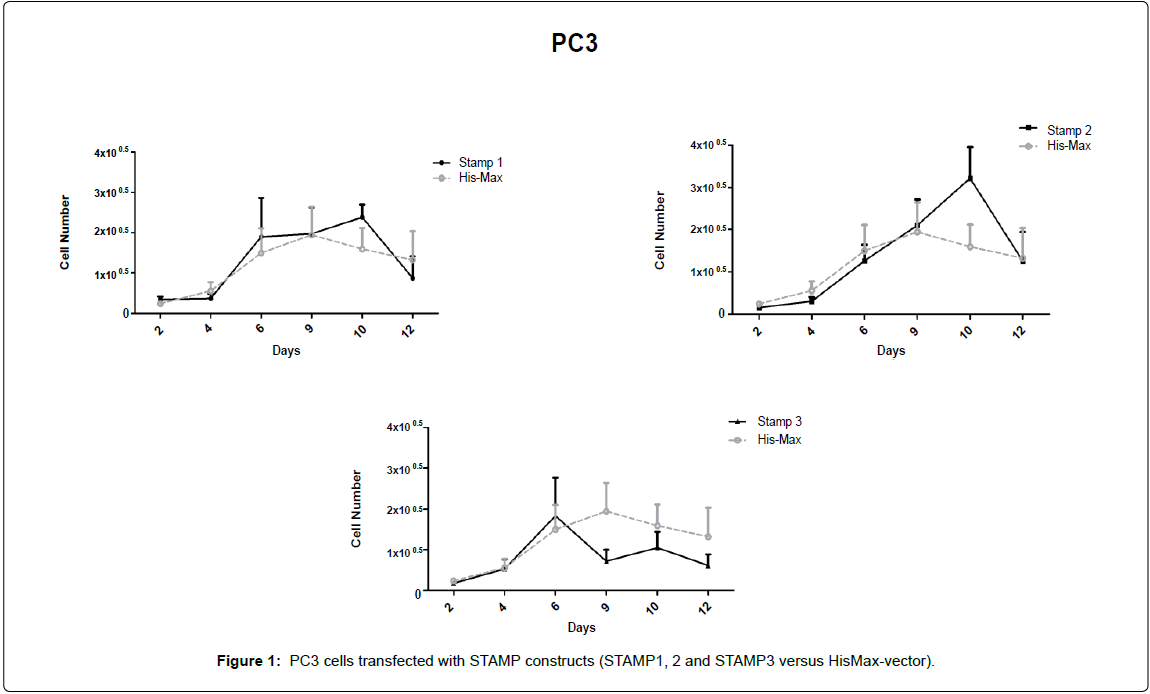
Figure 1: PC3 cells transfected with STAMP constructs (STAMP1, 2 and STAMP3 versus HisMax-vector).
STAMP2 transfection caused gradual increase in cell number at day 10, confirming the antiapoptotic character described, previously [3,9] (Figure 1).
PC3 cells transfected with STAMP2 versus vector
PC3 cells transfected with STAMP2 versus vector increase of apoptotic caspase 9 was shown at apoptotic panel amplifications. Realtime PCR amplifications were done with apoptotic and/or antiapoptotic gene primers (Table 1) at vector and STAMP2 transfected PC3 cell groups without any induction. A statistically significant increase at caspase 9 was seen that was seen with si transfection at LNCaP cells (Figure 2).
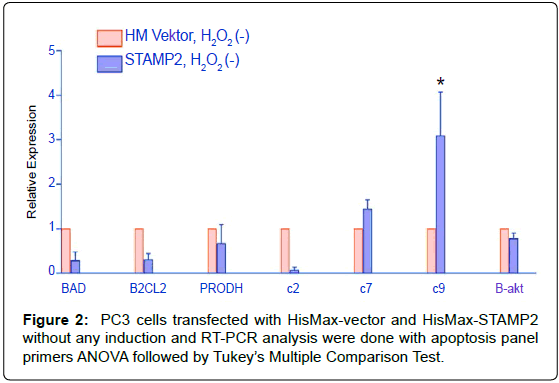
Figure 2: PC3 cells transfected with HisMax-vector and HisMax-STAMP2 without any induction and RT-PCR analysis were done with apoptosis panel primers ANOVA followed by Tukey’s Multiple Comparison Test.
LNCaP cells were induced by synthetic androgen –R1881
STAMP2 mRNA increase was shown by real-time RT-PCR primers specific to STAMP2 in order to show native inducible character of the gene at the cell line as control (Figure 3a).
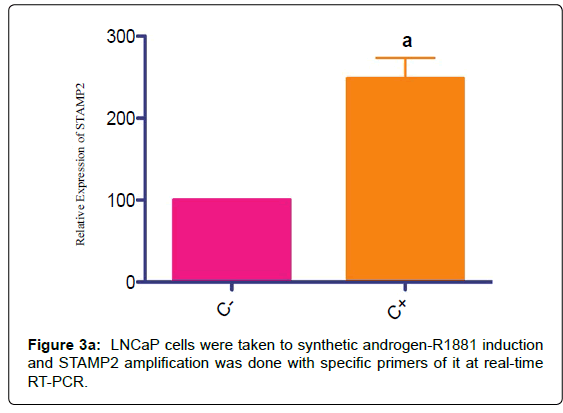
Figure 3a: LNCaP cells were taken to synthetic androgen-R1881 induction and STAMP2 amplification was done with specific primers of it at real-time RT-PCR.
Real-time PCR amplifications were done with apoptotic and/or antiapoptotic gene primers at control and R1881 induced group that amplification showed a significant decrease (Figure 3b).
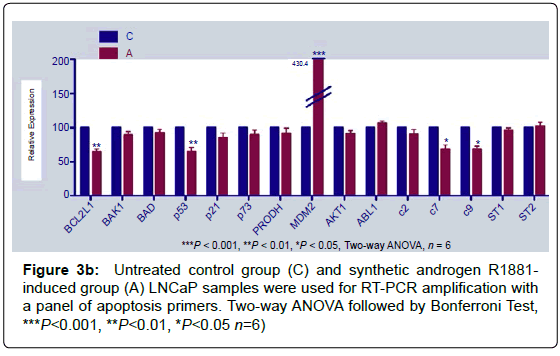
Figure 3b: Untreated control group (C) and synthetic androgen R1881- induced group (A) LNCaP samples were used for RT-PCR amplification with a panel of apoptosis primers. Two-way ANOVA followed by Bonferroni Test, ***P<0.001, **P<0.01, *P<0.05 n=6)
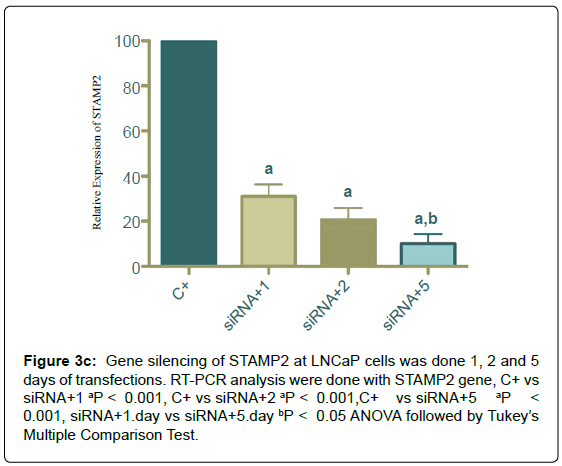
Figure 3c: Gene silencing of STAMP2 at LNCaP cells was done 1, 2 and 5 days of transfections. RT-PCR analysis were done with STAMP2 gene, C+ vs siRNA+1 aP < 0.001, C+ vs siRNA+2 aP < 0.001,C+ vs siRNA+5 aP < 0.001, siRNA+1.day vs siRNA+5.day bP < 0.05 ANOVA followed by Tukey’s Multiple Comparison Test.
STAMP2 silencing
Silencing of STAMP2 for 1, 2 and 5 days was done STAMP2 mRNA decrease was shown by real-time RT-PCR primers specific to STAMP2 (Figure 4).
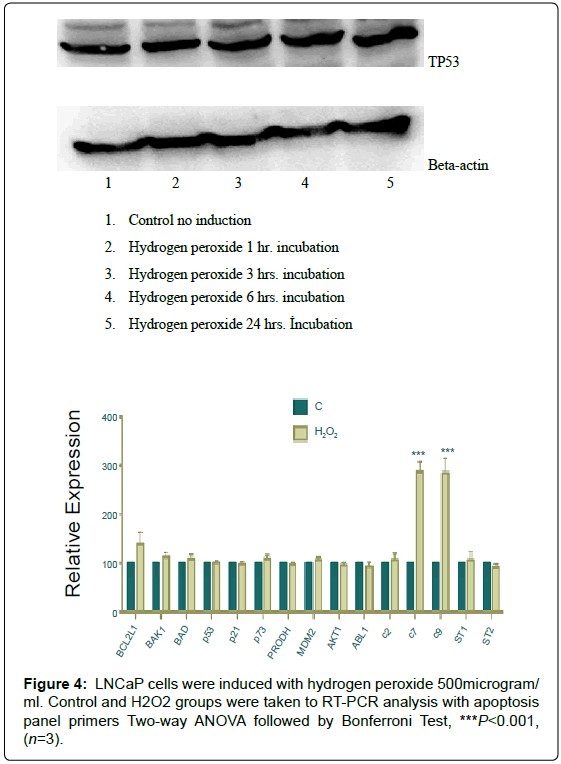
Figure 4: LNCaP cells were induced with hydrogen peroxide 500microgram/ ml. Control and H2O2 groups were taken to RT-PCR analysis with apoptosis panel primers Two-way ANOVA followed by Bonferroni Test, ***P<0.001, (n=3).
LNCaP cells were induced with Hydrogen Peroxide
A time-course of 500 microgram/ml hydrogen peroxide had been performed and constant expression was shown at each point ( 5).
LNCaP cells were induced with 500 microgram/ml hydrogen peroxide for six hours and real-time PCR amplifications were done with apoptotic and/or antiapoptotic gene primers. As a result, Caspase 7 and 9 showed a significant increase (Figure 5).
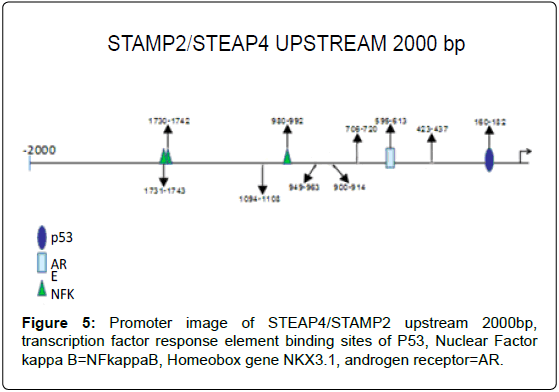
Figure 5: Promoter image of STEAP4/STAMP2 upstream 2000bp, transcription factor response element binding sites of P53, Nuclear Factor kappa B=NFkappaB, Homeobox gene NKX3.1, androgen receptor=AR.
Analysis of STAMP2 Promoter Region
Upstream 2000 basepairs of STAMP2 genomic DNA sequence were analyzed and between -160 and -162, a putative response element and between -696 and -612, a putative androgen receptor response element was identified with the Genomatix system, free- online program [10] (Figure 6).
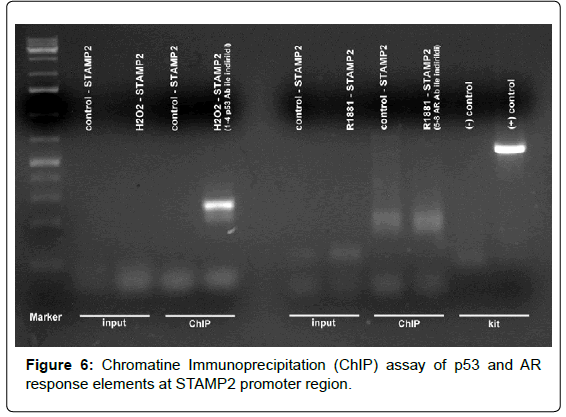
Figure 6: Chromatine Immunoprecipitation (ChIP) assay of p53 and AR response elements at STAMP2 promoter region.
Chromatin Immunoprecipitation (ChIP)
Study at LNCaP cells were performed with ChIP specific and androgen receptor (AR) antibody and hormone response elements were confirmed at STAMP2 promoter region sequences.
Silencing
Silencing of for 1,2 and 4 days was done for comparison with -null PC3 cell line (Figure 7a).
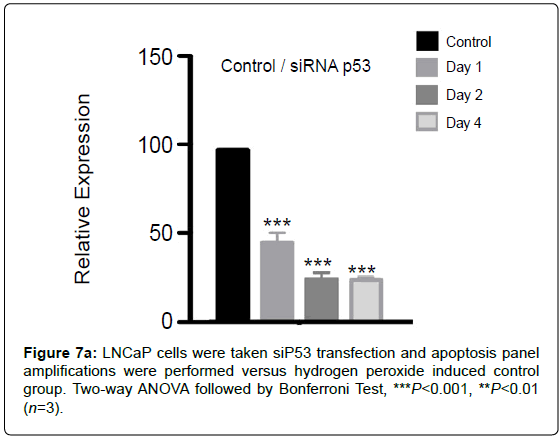
Figure 7a: LNCaP cells were taken siP53 transfection and apoptosis panel amplifications were performed versus hydrogen peroxide induced control group. Two-way ANOVA followed by Bonferroni Test, ***P<0.001, **P<0.01 (n=3)
LNCaP cells were taken si transfection and apoptosis panel amplifications were performed versus hydrogen peroxide induced control group.
Since silencing was performed its ubiquitinase MDM2 showed a significant increase with hydrogen peroxide induction, and as a confirmative result caspase 9 amplification decreased, statistically (Figure 7b).
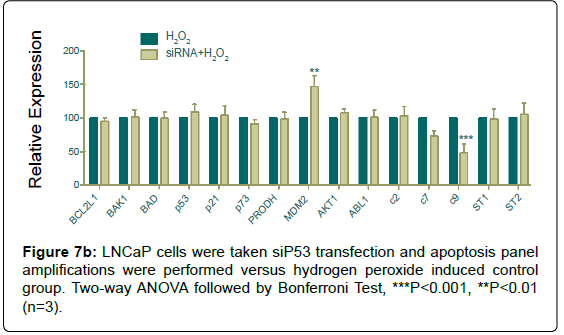
Figure 7b: LNCaP cells were taken siP53 hydrogen-peroxide and apoptosis panel amplifications were performed versus hydrogen peroxide induced control group. Two-way ANOVA followed by Bonferroni Test, ***P<0.001, **P<0.01 (n=3).
LNCaP cells were taken si transfection and apoptosis panel amplifications were performed versus si hydrogen peroxide induced group.
Even if, silencing of decreased apoptotic signals, hydrogen peroxide induction caused a significant increase in both caspases 7 and 9 (Figure 7c).
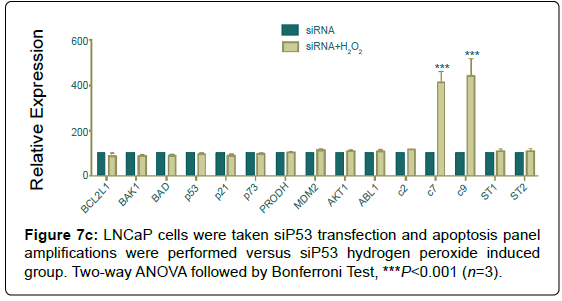
Figure 7c: LNCaP cells were taken siP53 transfection and apoptosis panel amplifications were performed versus siP53 hydrogen peroxide induced group. Two-way ANOVA followed by Bonferroni Test, ***P<0.001 (n=3).
Carcinogenesis is a multistage process, involving in oncogene activation and tumor suppressor gene inactivation as well as complex interactions between tumor and host tissues, leading ultimately to an aggressive metastatic phenotype. Among many genetic lesions, mutational inactivation of tumor suppressor, the “guardian of the genome,” is the most frequent event found in 50% of human cancers [11]. Many of the roles played by the tumor suppressor in restraining cancer initiation and progression are well established. These include the ability of to induce cell-cycle arrest, DNA repair, senescence and apoptosis [12]. One of the hallmarks of human cancers is the intrinsic or acquired resistance to apoptosis. Evasion of apoptosis can be part of a cellular stress response to ensure the cell’s survival upon exposure to stress stimuli. There are two major apoptosis signaling pathways, that is, the dead receptor (extrinsic) pathway and the mitochondrial (intrinsic) pathway [13]. Under most circumstances, activation of either pathway eventually leads to proteolytic cleavage and thus activation of caspases, a family of cysteine proteases that act as common dead effector molecules. Accordingly, caspases are responsible for many of the biochemical and morphological hallmarks of apoptotic cell dead by cleaving a range of substrates in the cytoplasm or nucleus [14]. Cytochrome c has been implicated in the redox regulation of apoptosis. Once cytochrome c is released from mitochondria into the cytosol, it triggers the formation of the cytochrome c/Apaf-1/Caspase-9-containing apoptosome, which in turn lead to activation of caspase-9 and downstream effector caspases [15]. There is recent evidence that also the redox state of cytochrome c is involved in the regulation of apoptosis. To this end, the oxidized form of cytochrome c (Fe(3+)) has been reported to induce caspase activation via the apoptosome, while the reduced form of cytochrome c (Fe(2+)) is unable to do so [16,17]. ChIP assay let us identify the promoter region of STAMP2 gene and confirm the response elements of AR and with the inductions [18]. Hydrogen peroxide long-term induction caused apoptotic response in order to control cell fate [19]. Androgen receptor (AR) is a member of steroid receptor superfamily and a transcription factor. Response elements of prostate specific antigen (PSA) and NFkB are located at AR promoter region [20], and suggest that NFkB may affect AR expression.
This work was granted by The Scientific and Technological Research Council of Turkey (TUBITAK) to CGK [Grant no: 106S295]; The Turkish Academy of Sciences (TUBA) to CGK [GEBIP-2007].
Note: Ceren Gonen-Korkmaz, Gulnur Sevin have equally contributed to the study.