Organic Chemistry: Current Research
Open Access
ISSN: 2161-0401
ISSN: 2161-0401
Research Article - (2018) Volume 7, Issue 1
A Quantative-Structure-Activity Relationship (QSAR) study is performed on monoterpene-containing substituted coumarins, A number of highly descriptive and predictive QSAR models for these compounds were obtained by Using physicochemical parameters using stepwise-multiple linear regressions methods. Model validation is performed by incorporating training and test sets approach and calculating R2 which is equal to 0.9943 and also Regression analysis data has indicated that activity can be best modeled in multi-parametric regression.
Keywords: Substituted coumarins, QSAR, Molar volume, Molar refractivity, Parachore, Density, Refractive index, Surface tension, Polarizability
The term influenza refers to illness caused by influenza virus. This is commonly called the flu, but many different illnesses cause flu like symptoms such as fever, chills aches and pains, and cough [1]. Influenza causes different illness patterns, ranging from mild common cold symptoms, to typical flu, to life-threatening pneumonia, bacterial infection and other complications. This virus consists of major surface glycoprotein (HEF, hemagglutinin-esterase-fusion protein) and a minor surface glycoprotein (CM2). These surface glycoproteins form ordered hexagonal arrays [2-6].
There are a number of drugs approved by FDA for the treatment and prevention of influenza. Yearly vaccination is the primary means of preventing and controlling influenza.
Antibiotics are used to treat illnesses caused by bacteria. Examples of illnesses caused by bacteria include strep throat, tuberculosis and many types of pneumonia. Antibiotics do not treat viral illnesses like flu, cold, and most viral infections.
Coumarin and other benzopyrones, such as 5, 6-benzopyrone, 1, 2-benzopyrone, diosmin, others are known to stimulate macrophages to degrade extracellular albumin, allowing faster resorption of edematous fluids [7,8]. Other biological activities that may lead to other medical uses have been suggested, with varying degrees of evidence. Coumarin is also used as a gain medium in some dye lasers [9-11] and as a sensitizer in older photovoltaic technologies [12].
The QSAR methods, with simple molecular indexes, are a promising shortcut to resolve the cost and time issue. The QSAR method enables the calculation of numerous quantitative descriptors on the basis of molecular structural information and is very useful to optimize important aspects such as antiinflunza activity. In this paper we are modeling the Anti-influenza activity of monoterpene-containing substituted coumarins Using physicochemical parameters.
The water/octanol partition coefficient (Log P)) is often considered to be an important molecular descriptor as it is linked to toxicity issues and oral bioavailability. it is Calculated using the ACD/LogP ChemSketch 12 software.
Antiviral activity and cytotoxicity of compounds
Against influenza virus A/California/07/09(H1N1)pdm09 in MDCK cells [13].
Parameters used
We have following physicochemical parameters for modeling of which were calculated by using ACD labs software Chemsketch [14].
Molecular volume (MV)
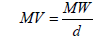 (1)
(1)
Molecular refractivity (MR)
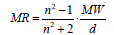 (2)
(2)
Parachor (P)
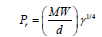 (3)
(3)
Density (d)
 (4)
(4)
Refractive Index (n)
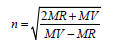 (5)
(5)
Surface tension (γ)
 (6)
(6)
Polarizability (α)
Polarizability=0.3964308.MR
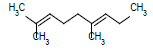
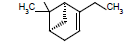
The compounds used in the present study with their values are reported in Table 1. The values of various parameters obtained are reported in Table 2.
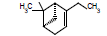
| Compd. No. | Parent compound | R | clogP |
|---|---|---|---|
| 1 |  |
 |
5.69 |
| 2 |  |
5.04 | |
| 3 |  |
5.04 | |
| 4 | 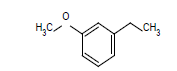 |
5.52 | |
| 5 | 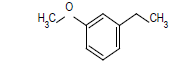 |
3.35 | |
| 6 | 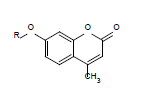 |
 |
6.28 |
| 7 |  |
5.63 | |
| 8 | 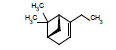 |
5.63 | |
| 9 | 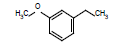 |
3.94 | |
| 10 | 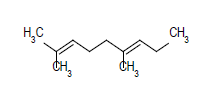 |
 |
6.75 |
| 11 | 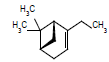 |
6.09 | |
| 12 | 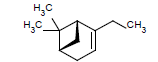 |
6.09 | |
| 13 | 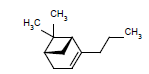 |
6.57 | |
| 14 | 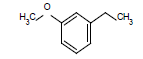 |
4.40 | |
| 15 | 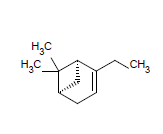 |
 |
7.31 |
| 16 | 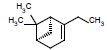 |
6.66 | |
| 17 | 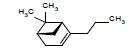 |
6.66 | |
| 18 |  |
7.14 | |
| 19 |  |
4.97 |
Table 1: Structural details along with their clogP values.
| S No. | MW | MR | MV | PC | IR | ST | D | POL |
|---|---|---|---|---|---|---|---|---|
| 1 | 298.38 | 87.94 | 276.40 | 692.60 | 1.55 | 39.30 | 1.08 | 34.86 |
| 2 | 296.36 | 83.71 | 252.00 | 642.00 | 1.58 | 42.10 | 1.18 | 33.18 |
| 3 | 296.36 | 83.71 | 252.00 | 642.00 | 1.58 | 42.10 | 1.18 | 33.18 |
| 4 | 310.38 | 88.34 | 268.50 | 682.00 | 1.57 | 41.60 | 1.15 | 35.02 |
| 5 | 282.29 | 77.61 | 225.80 | 596.70 | 1.60 | 48.70 | 1.25 | 30.76 |
| 6 | 312.40 | 92.64 | 294.40 | 728.90 | 1.54 | 37.50 | 1.06 | 36.72 |
| 7 | 310.39 | 88.41 | 270.00 | 678.30 | 1.57 | 39.80 | 1.15 | 35.05 |
| 8 | 310.39 | 88.41 | 270.00 | 678.30 | 1.57 | 39.80 | 1.15 | 35.05 |
| 9 | 296.32 | 82.31 | 243.70 | 630.00 | 1.59 | 45.40 | 1.22 | 32.63 |
| 10 | 338.44 | 99.15 | 301.80 | 775.90 | 1.57 | 43.60 | 1.12 | 39.30 |
| 11 | 336.42 | 95.35 | 272.70 | 725.20 | 1.62 | 50.00 | 1.23 | 37.80 |
| 12 | 336.42 | 95.35 | 272.70 | 725.20 | 1.62 | 50.00 | 1.23 | 37.80 |
| 13 | 350.45 | 99.98 | 288.80 | 765.30 | 1.60 | 49.20 | 1.21 | 39.63 |
| 14 | 322.35 | 89.19 | 250.50 | 679.90 | 1.63 | 54.50 | 1.28 | 35.36 |
| 15 | 352.46 | 103.79 | 318.00 | 815.90 | 1.56 | 43.30 | 1.10 | 41.14 |
| 16 | 350.45 | 99.98 | 288.80 | 765.30 | 1.61 | 49.20 | 1.21 | 39.63 |
| 17 | 350.45 | 99.98 | 288.80 | 765.30 | 1.61 | 49.20 | 1.21 | 39.63 |
| 18 | 364.48 | 104.62 | 305.00 | 805.40 | 1.60 | 48.60 | 1.19 | 41.47 |
| 19 | 336.38 | 93.82 | 266.70 | 720.00 | 1.62 | 53.10 | 1.26 | 37.19 |
Table 2: Value of the calculated physicochemical parameters used in the present study.
A close look of Table 3 reveals that:
| Model No. | Parameter Used | Ai=(1-6) | B | Se | R2 | R2A | F |
|---|---|---|---|---|---|---|---|
| 1 | MV | 0.0446 (± 0.0031) | -6.5072 | 0.0531 | 0.9244 | 0.9199 | 207.7740 |
| 2 | PC | 0.0162 (± 0.0016) | -5.8312 | 0.0736 | 0.8547 | 0.8462 | 100.0100 |
| 3 | MR | 0.1267 (± 0.0142) | -5.9719 | 0.0808 | 0.8246 | 0.8143 | 79.9160 |
| 4 | POL | 0.3196 (± 0.0358) | -5.9731 | 0.0809 | 0.8245 | 0.8142 | 79.8690 |
| 5 | MW | 0.0356 (± 0.0064) | -5.7931 | 0.1148 | 0.6463 | 0.6255 | 31.0650 |
| 6 | D | -7.9445 (± 3.7838) | 15.1155 | 0.1720 | 0.2059 | 0.1592 | 4.4090 |
| 7 | IR | -7.4157 (± 9.8492) | 17.5074 | 0.1899 | 0.0323 | 0.0000 | 0.5670 |
| 8 | ST | -0.0231 (± 0.0515) | 6.7776 | 0.1919 | 0.0117 | 0.0000 | 0.2010 |
| 9 | MR ST |
0.1417 (± 0.0068) -0.0832 (± 0.0105) |
-3.5630 | 0.0375 | 0.9644 | 0.9599 | 216.6560 |
| 10 | ST POL |
-0.0832 (± 0.0105) 0.3575 (± 0.0173) |
-3.5642 | 0.0375 | 0.9644 | 0.9599 | 216.6180 |
| 11 | MW ST |
0.0487 (± 0.0027) -0.1345 (± 0.0131) |
-3.9193 | 0.0429 | 0.9535 | 0.9476 | 163.8790 |
| 12 | MW D |
0.0382 (± 0.0027) -9.5626 (± 1.0671) |
4.6723 | 0.0482 | 0.9412 | 0.9339 | 128.1460 |
| 13 | D POL |
-6.0208 (± 1.0729) 0.3042 (± 0.0216) |
1.7074 | 0.0484 | 0.9409 | 0.9335 | 127.2950 |
| 14 | MR D |
0.1206 (± 0.0086) -6.0181 (± 1.0733) |
1.7057 | 0.0484 | 0.9408 | 0.9334 | 127.2320 |
| 15 | PC ST |
0.0172 (± 0.0011) -0.0619 (± 0.0138) |
-3.6783 | 0.0505 | 0.9357 | 0.9276 | 116.3230 |
| 16 | MW POL |
-0.0610 (± 0.0121) 0.7909 (± 0.0964) |
-3.4721 | 0.0518 | 0.9321 | 0.9236 | 109.8030 |
| 17 | MW MR |
-0.0609 (± 0.0121) 0.3131 (± 0.0382) |
-3.4726 | 0.0519 | 0.9319 | 0.9234 | 109.5510 |
| 18 | MV IR |
0.03458 (± 0.0032) 3.6696 (± 2.8035) |
-12.6461 | 0.0520 | 0.9317 | 0.9231 | 109.1030 |
| 19 | MR PC D |
0.5203 (± 0.0660) -0.0516 (± 0.0085) -11.9344 (± 1.1423) |
8.4751 | 0.0269 | 0.9829 | 0.9795 | 287.2480 |
| 20 | PC D POL |
-0.0509 (± 0.0086) -11.8727 (± 1.1561) 1.3002 (± 0.1681) |
8.3999 | 0.0273 | 0.9824 | 0.9788 | 278.5110 |
| 21 | PC IR ST |
0.0191 (± 0.0007) 31.7224 (± 5.2849) -0.2224 (± 0.02784) |
-48.1435 | 0.0283 | 0.9811 | 0.9773 | 259.3340 |
| 22 | MW MR PC |
-0.1361 (± 0.0143) 1.0187 (± 0.1197) -0.060 (± 0.0101) |
-1.2969 | 0.0291 | 0.9799 | 0.9759 | 244.3760 |
| 23 | MR IR ST |
0.1489 (± 0.0057) 17.6780 (± 5.2477) -0.1732 (± 0.0279) |
-28.2069 | 0.0293 | 0.9797 | 0.9757 | 241.6390 |
| 24 | IR ST POL |
17.6099 (± 5.2621) -0.1729 (± 0.0280) 0.3756 (± 0.0145) |
-28.1126 | 0.0293 | 0.9796 | 0.9755 | 240.2040 |
| 25 | MW PC POL |
-0.1352 (± 0.0144) -0.0594 (± 0.0102) 2.5437 (± 0.3046) |
-1.3335 | 0.0296 | 0.9793 | 0.9752 | 236.6480 |
| 26 | MR MV ST |
0.2811 (± 0.0474) -0.0453 (± 0.0153) -0.1703 (± 0.0306) |
-0.0420 | 0.0308 | 0.9775 | 0.9731 | 217.6600 |
| 27 | MV ST POL |
-0.0449 (± 0.0153) -0.1697 (± 0.0306) 0.7066 (± 0.1196) |
-0.0711 | 0.0309 | 0.9774 | 0.9729 | 216.2450 |
| 28 | MV IR ST |
0.0504 (± 0.0021) 34.2318 (± 5.9016) -0.1604 (± 0.0297) |
-55.1749 | 0.0313 | 0.9768 | 0.9722 | 210.6810 |
| 29 | MW MR MV ST |
-0.0886 (± 0.0138) 0.7436 (± 0.0763) -0.1131 (± 0.013) -0.2059 (± 0.0169) |
6.1159 | 0.0161 | 0.9943 | 0.9927 | 609.9460 |
| 30 | MW MV ST POL |
-0.0887 (± 0.0141) -0.1125 (± 0.0135) -0.2048 (± 0.0172) 1.8727 (± 0.1960) |
6.0661 | 0.0164 | 0.9941 | 0.9924 | 588.4540 |
| 31 | MR MV ST D |
0.5894 (± 0.0613) -0.1666 (± 0.0233) -0.1585 (± 0.0177) -20.3032 (± 3.6204) |
28.1866 | 0.0177 | 0.9931 | 0.9911 | 502.4890 |
Table 3: Regression parameters and quality of correlation when physicochemical parameters are used.
1) Out of Eight mono-parametric model, MV shows the highest regression value for the best model.
2) Out of ten bi-parametric model, MR and ST together shows the highest regression value for the best model.
3) Out of ten tri-parametric model, MR, PC and D together shows the highest regression value for the best model.
4) Out of three tetra-parametric model, MW, MR, MV and D together shows the highest regression value for the best model.
Cross validated parameter for the best obtained model (clogP) are reported in Table 4.
| Compd. No. | (clogP) Model-29 | ||
|---|---|---|---|
| Actual | Predicted | Residual | |
| 1 | 5.69 | 5.74 | -0.05 |
| 2 | 5.04 | 4.96 | 0.08 |
| 3 | 5.04 | 4.96 | 0.08 |
| 4 | 5.52 | 5.40 | 0.12 |
| 5 | 3.35 | 3.27 | 0.08 |
| 6 | 6.28 | 6.33 | -0.05 |
| 7 | 5.63 | 5.65 | -0.02 |
| 8 | 5.63 | 5.65 | -0.02 |
| 9 | 3.94 | 4.18 | -0.24 |
| 10 | 6.75 | 6.77 | -0.02 |
| 11 | 6.09 | 6.10 | -0.01 |
| 12 | 6.09 | 6.10 | -0.01 |
| 13 | 6.57 | 6.64 | -0.07 |
| 14 | 4.40 | 4.35 | 0.05 |
| 15 | 7.31 | 7.21 | 0.09 |
| 16 | 6.66 | 6.64 | 0.02 |
| 17 | 6.66 | 6.64 | 0.02 |
| 18 | 7.14 | 7.14 | -0.004 |
| 19 | 4.97 | 5.01 | -0.04 |
Table 4: Actual and predicted clogP values Using Model no-29.
In recent work they have used different electronic properties along with the topo-chemical analysis for modeling. In the present work we have used data from the work of Khomenko et al. [13] for modeling of Anti-influenza activity of Monoterpene-containing substituted coumarins.
It may be inferred that no mono-variate correlation yield excellent results. The only parameters showing correlation with clogP is.
Mono-parametric model
clogP=0.0446 (± 0.0031) MV-6.5072 (7)
N=19, R2=0.9244, R2A=0.9199, F=207.7740, Se=0.0531
When MR and ST were taken together a bi-parametric model has been obtained with improved statistics here R2 comes out to be 0.9644.
Bi-parametric model
clogP=0.1417 (± 0.0068) MR-0.0832 (± 0.0105) ST-3.5630 (8)
N=19, R2=0.9644, R2A=0.9599, F=216.6560, Se=0.0375
tri-parametric model has been obtained when MR, PC and D were taken together. In this model the R2 shows significant Improvement.
Tri-parametric model
clogP=0.5203(± 0.0660) MR-0.0516 (± 0.0085) PC-11.9344(± 1.1423) D+8.4751 (9)
N=19, R2=0.9829, R2A=0.9795, F=285.2480, Se=0.0269
However, very small improvement is observed in a tetra-parametric model when MW, MR, MV and ST have been taken as correlating parameter. This model has been found to be excellent for modelling (clogP) activity of the compound of the present study.
Tetra-parametric model
clogP=-0.0886(± 0.0318) MW+0.7436 (± 0.0763) MR-0.1131(± 0.013) MV-0.2059(± 0.0169) ST+6.1159 (10)
N=19, R2=0.9943, R2A=0.9927, F=609.9460, Se=0.0161
We have estimated clogP values using Model-29. The predictive power of best Model has been obtained by plotting graph between actual and predicted clogP values demonstrated in Figure 1.
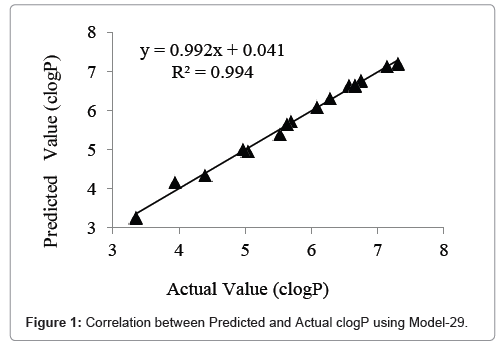
Figure 1: Correlation between Predicted and Actual clogP using Model-29.
This clearly indicates that this is best model for estimating predicting clogP values of the compounds in the present study, the small residue value and R2pred confirms the above statement.
The residual plot for Model-29 is demonstrated in Figure 2, on the basis of Table 5 which contains actual and predicted clogP values using this model. The residual points distributed evenly about the line y=0 indicates there is no systemic error in the model.
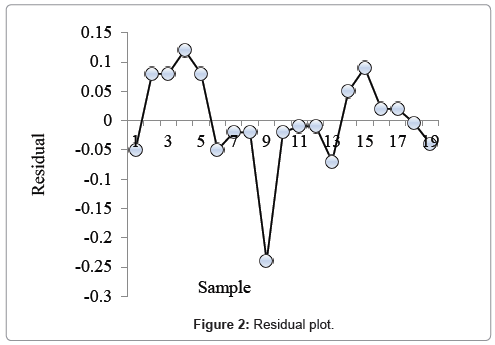
Figure 2: Residual plot.
| Model No. | Parameter used | PRESS/SSY | R2CV | Spress | PSE |
|---|---|---|---|---|---|
| 1 | MV | 0.0818 | 0.9182 | 0.0737 | 0.0659 |
| 9 | MR ST |
0.0369 | 0.9631 | 0.0537 | 0.0452 |
| 19 | MR PC D |
0.0174 | 0.9826 | 0.0397 | 0.0314 |
| 29 | MW MR MV ST |
0.0057 | 0.9943 | 0.0246 | 0.0191 |
Table 5: Cross validated parameters for the best obtained models.
Physicochemical parameters can be successfully used for modelling the Anti-influenza activity of Monoterpene-containing substituted coumarins, and Molecular weight, Molar refractivity, molar volume are the best parameters for modelling such activities.