Journal of Ergonomics
Open Access
ISSN: 2165-7556
ISSN: 2165-7556
Research Paper - (2019)Volume 9, Issue 1
Background: The number of people over 60 years of age is rapidly growing worldwide. The ageing of population increases the need for new public health policies and products. In this context, it is primordial to have access to the anthropometric characterisation of the elderly population.
Objective: This investigation describes the somatotype components of a representative sample of elderly from Chile.
Methods: In a cross-sectional anthropometric study, we assessed 200 older adults (60 to 80 years old). The study was conducted using the Heath-Carter anthropometric method, and Principal Component Analysis (PCA) to redefine and optimise the cluster definition. Statistical differences were established for male and female among the somatotype categories (endomorph, mesomorph and ectomorph) using t-test. For the analysis of the progression of a variable among the different age bins were used ANOVA and Tukey has a post hoc test.
Results: the somatotype of the male and female showed a higher frequency of mesomorph-endomorph biotype (77.5% and 52.4% respectively) follow by mesomorph-endomorph in males and an endo-mesomorph in females (10.8% and 29.8% respectively). The sample differs significantly by gender with a higher endomorphic component in females from 60-80 years old. The somatochart show displacement in men and female trough the endomorphic component. The PCA and hierarchical clustering identify four main new clusters.
Conclusions: These results provide evidence of an increase in gender difference regarding anthropometric parameters, also redefine the most frequent somatotype assignation in elderly adults. This information is essential for new public health policies and the design of new products..
Ageing; Anthropometric; Older adults; Somatotype
One of the major and most important changes that have experimented modern society correspond to the increase of life expectancy and consequent ageing of the population [1]. This important change impacts all the aspect of society [1]. Accordingly, in Chilean population, the life expectancies have increased 16 years in the last 45 years and currently correspond to 80.5 at birth and 24.4 years at 60 years old [2]. Probably one of the main issues regarding the progressive ageing of the population is public health. Many evidence indicates that despite the increase in life expectancy, some of the population during the additional years of life, lack good health in many cases. The general health status of an individual is the consequence of the cumulative effects of the improvements and impacts during the complete people life span [1]. Additionally, the World Health Organization (WHO) state that there are severe inequities in the general state of health during ageing. In this context, it is imperative that the general environment could generate improvements that overcome, rather than reinforce, these inequities [3]. This general aim represented both challenges and opportunities. In this context the WHO established in 2015 the 2030 AGENDA for continued development, aiming for the decade 2020 to 2030 to be the decade of the healthy ageing [4]. One of the main instructions of the WHO indicate that the government should invest in the development of environmental improvements that potentiate an adequate Healthy Ageing.
According to the WHO organisation, Healthy ageing corresponds to the maintaining of the functional ability that enables wellbeing in older ages [1]. The functional ability is related to the functional capabilities to meet their basics needs, to learn and make decisions, to build and maintain relationships, to contribute to society and maintain mobility. To achieve this objective and completely achieve the objective of having a population with healthy ageing the WHO commission establish a series of actions that should be implemented. Among the most important priorities established are collecting better data regarding healthy ageing and promoting the research that could address the future needs of older people. In summary, there is an important need for new products and innovations in public health policies that could support the growing ageing population. Particularly important is the development of new products, specifically oriented to maintain the functional capabilities of the elderly population [4]. In this context, for the development of new products one of the main adversities to overcome is the lack of specifying anthropometric characterisation. An adequated anthropometric characterisation is essential for the development of higher quality products. Particularly it has been supported that the newer industrials organisations that want to overcome the new special needs of the population would extremely require more quality, time and better cost. Anthropometric studies are essential for this objective [5-8].
In this context, it is important to highlight that the global markets require better products that could satisfy the needs of a more diverse and ageing society [9]. Additionally, the globalisation and the subsequent electronic commerce has increased this necessity to specify anthropometric studies from different regions and countries. The process of the incorporation of the antroprometyc information in the design of new products it is related to boost usability, durability and higher productivity and lowering negative effect in the users [10]. This kind of approach has been already performed for infant and childhood products, an anthropometric study was funding by the European Union and established the parameters and recommendations for the specific industry (Euro-hand feet) [11]. Interestingly nowadays no detailed studies or database characterise the anthropometric status of the elderly population. Another study has measured some anthropometric parameter and co-relate with equations for the prediction of the weight and weight progression in younger and older adults (<60 and >60) [12]. Additionally, anthropometric validation has been used for prediction of the bioelectrical resistance as an assessment of the nutritional status [13]. In another study were develop theory equations, based on anthropometric measures, predict the body fat index [14]. Interestingly the Body fat index it is associated to the onset of several important pathologies and syndromes in the elderly like Alzheimer and cognitive failure [15,16]. In summary the exact measure of antrophrometryc variables in the elderly population it is essential for adequate development of health policies, health services and products design [17]. In our study, we assess several anthropometric variables to characterise a population of elderly adults ranging from 60 to 80 years of age. During the development of the anthropometric characterisation process, It was evident the poor performance of the original somatotype classification. To further optimise the somatotype assignation in elderly patients, it was performed a methodology of Principal Component Analisis (PCA) and further hierarchical cluster for the definition of a somatotype-cluster. Interestingly with this analysis, we define a new set of variables that are a better predictor of the clustering process.
Participants
The population submitted to the study included older adults ranging from 60 to 80 years old. The older adults that participate in the study were members of public ageing clubs located in the city of Talca in the Region of Maule, Chile. The following selection criteria were applied to the members of public’s geriatric clubs. It is essential to clarify that the old clubs and centres in the Maule regions correspond to public and integrative social communities, organised by the self-community and are representative of the average 60 to 80 years old population. For this study were excluded the elderly that are not capable of performing daily activities without help or those that present pathologies in the locomotor or vestibular apparatus, that involve any compromise of self-functioning.
Definition of the anthropometric sample
The sample corresponds to senior men and women between 60 and 80 years old. The sample size was calculated with the Formann methodology [18]. It is suggested that the minimum number of the sample should not be lower than two ^k has a sample size (k=number of variables), even preferable 5*2^k. In our study, we assess the following variables: Waist width, hip width, the circumference of the Thigh, Leg length, Leg circumference, popliteal height. Also, was measure the following variables height, body mass, four skinfolds four skinfolds (triceps, subscapular, supraspinal, and medial calf); two bone breadths (bi-epicondylar humeral and femoral); and two limb girths (arm flexed and maximum tensed (at maximum) and maximum perimeter of the calf) [17].
Additionally was calculated a percentage of loss using the following equation (n=(n/1-R) (2)), n corresponding to the size of the sample and R to the percentage of loss. It has been reported in some exercises program that the loss, with elderly adults, is approx 10%. In this context, it is estimated to evaluate a sample of 75 women and 75 men. All the recruited elderly adults are associated to, at least, one program of the national service for the elderly Adults (SENAMA), and are currently participating in at least one geriatric clubs in the region of Maule, Chile.
Anthropometric study and definition of the somatotype
For the characterisation of the somatotype, the anthropometric variables of the patients previously measure were used, following the Heath and Carter methodology [19]. During the performance of the anthropometric study was strictly follows the recommendation of the International Society for the Advanced of Kinanthropometry [20]. The evaluation was performed with the older adults in bare feet and wearing light clothes. All measures were performed by the first author at least three times, and the median of the three individual measures was calculated. The study was performed in several sessions in the old clubs and centres in the Maule region, Chile. After the performance of the anthropometric study were stored in an electronic file, and submitted to analysis. For the determination of percentile (5-95-SD) and the characterisation of the somatotype. During all the performance of the anthropometric study were present two health workers specialised in ergonomy and one geriatric physician. The definition of the somatotype was presented according to the variation of 3 component:
• Mesomorphic: Associated with the robustness or the musculoskeletal strength.
• Ectomorphic: Associated with the skin shape.
• Endomorphic: Associated to the relative adiposity.
Sheldon previously published the methodology utilised for the quantification of the somatotype and later modify by Heath and Carter [19]. After performing the Heath and Carter characterisation, the population was characterised according to Carter Heath in 1990 using the somatochart (Figure 1). According to the mentioned methodology several categories were defined including: Endomorphic balanced (4-2-2), Meso-Endomorphic (4-3-2), Mesomorphic Endomorphic (4-4-2), Endo-Mesomorphic (3-4-2), Mesomorph Balanced (2-4-2), Ecto-Mesomorphic (2-4- 3), Mesomorphic Ectomorphyc (2-4-4), Meso-Ectomorphyc (2- 3-4), Ectomorph Balanced (2-2-4), Endo-Ectomorphyc (3-2-4), Endomorphic Ectomorphyc (4-2-4), Ecto-Endomorphic (4-2-3) and Central (4-4-4).
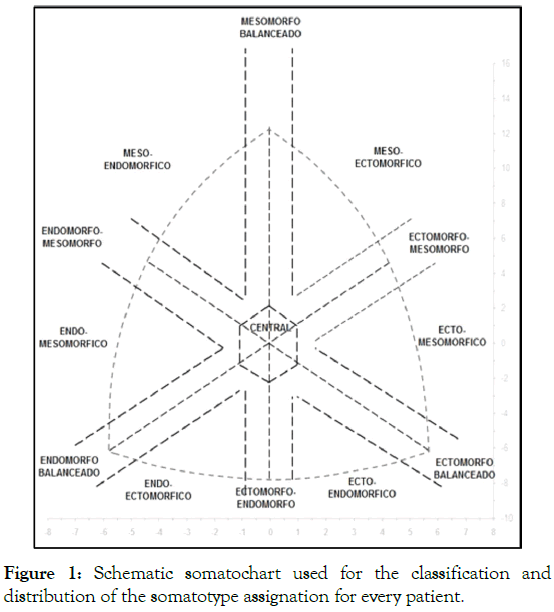
Figure 1: Schematic somatochart used for the classification and distribution of the somatotype assignation for every patient.
Table 1: Summarises the number of patients associated with every category after the assignation of the somatotype characterisation. The numbers correspond to the absolute number and the percentage of every gender analysed.
| Total | Male | Female | Total |
|---|---|---|---|
| Endomorphic Balanced (4-2-2) | 1/0.9% | 1/1.2% | 2 |
| Meso-Endomorfic (4-3-2) | 86/77.5% | 44/52.4% | 130 |
| Mesomorfo Endomorfo (4-4-2) | 12/10.8% | 12/14.3% | 24 |
| Endo-Mesomorfo (3-4-2) | 12/10.8% | 25/29.8% | 37 |
| Mesomorfo Balanceado (2-4-2) | 0 | 0 | 0 |
| Ecto-Mesomorfo (2-4-3) | 0 | 0 | 0 |
| Mesomorfo Ectomorfo (2-4-4) | 0 | 0 | 0 |
| Meso-Ectomorfo (2-3-4) | 0 | 0 | 0 |
| Ectomorfo Balanceado (2-2-4) | 0 | 0 | 0 |
| Endo-Ectomorfo (3-2-4) | 0 | 1/1.2% | 1 |
| Endomorfo Ectomorfo (4-2-4) | 0 | 0 | 0 |
| Ecto-Endomorfo (4-2-3) | 0 | 0 | 0 |
| Central (4-4-4) | 0 | 1/1.2% | 1 |
| Total | 111 | 84 | 195 |
Principal component analysis and hierarchical cluster
After the performance of the PCA analysis of every individual subject, it was evident that ten variables were more representative of a good clustering. Later using these ten variables (Figure 2), it was performed the hierarchical clustering analysis. The variables used correspond to Mesomorph, Y component, Lean Mass, S3 fold, Endomorph, Ectomorph, HWR, Density and X component ("Densidad", "MasaMagra", "MasaGrasa", "S3PLIEG", "HWR", "ENDO", "MESO", "ECTO", "X" and "Y"). The mentioned variables correspond to a group of parameters calculated for the representation of the somatotype in the somatochart. More detail description of methodology as previously been previously published by Heath and Carter [19].
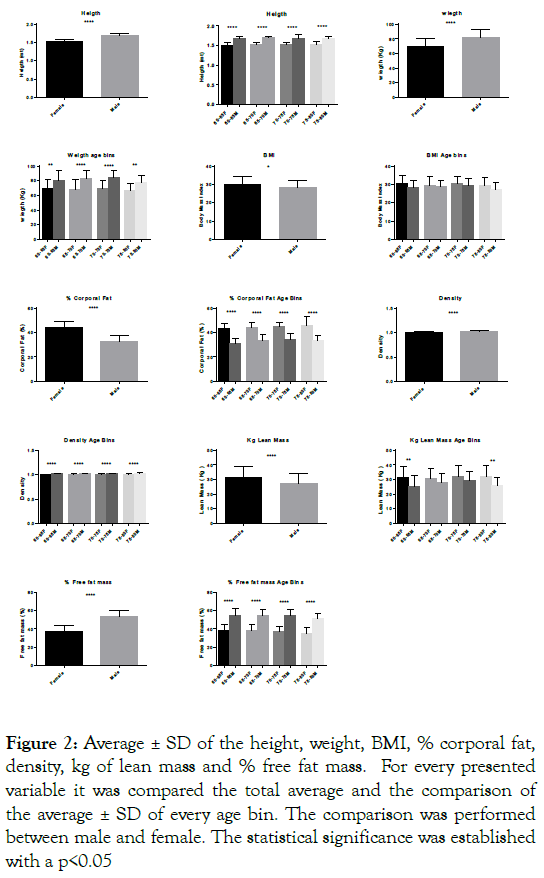
Figure 2: Average ± SD of the height, weight, BMI, % corporal fat, density, kg of lean mass and % free fat mass. For every presented variable it was compared the total average and the comparison of the average ± SD of every age bin. The comparison was performed between male and female. The statistical significance was established with a p<0.05
Ethics
All the procedure presents in this work were submitted to the approval and supervision of the bioethical committee of the Universidad de Talca. All the patients submitted to the evaluation were asked to sign a human subject consent form previously approved by the institutional Scientific and Ethics committee, and they could withdraw from the evaluation at any moment they want.
Statistical analysis
Statistical analyses were performed using GraphPad Prism software, version 6. The differences in female and male subjects were calculated among the age bins. Age bins correspond to the aggrupation of the elderly in every 5 years range, 60-65, 66-70, 71- 75, 76-80. The number of subjects in every age bin is presented in the (Supplementary Table 1). When appropriated the comparison among the two groups was performed using a T-test. When three or more groups were compared with a One-way Analysis of Variance (ANOVA) with Tukey’s test as a post-hoc comparison of means was performed. The confidence levels of all analyses were set at 95%, and values with p ≤ 0.05 were considered statistically significant, and all data shown are mean ± Standard Deviation (SE). To provide a global overview of somatotypes Principal Component Analyses (PCA) and hierarchical clustering analysis were performed.
After the performance of the different measures, it was analysed the differences between male and female groups and through the different age bin in each experimental group. It was evident a higher value for the height, weight, density and Free fat mass in Male group conserved through the different age bins (Figure 3). On the other hand, it was found that the percentage of body fat and Kg of lean mass was higher in females but only in the Male group present conserved differences in the complete age bin series (Figure 3). Also was identify a higher Body Mass Index (BMI) in female but this difference was not present in the specified age bins analysed (Figure 3). Additionally when compared the differences among the age bins inside each group (female and male) was accurately identify an increase in the density of the Female group among age bins (Figure 3). Also, the total body fat show distribution but no differences among all specific groups were not significant (Figure 3). All the other parameter measure did not show any significant difference when compared among age bins (Supplementary Tables 1-3).
Additionally, it was measure several diameters (arm, hip, tight and leg). This parameter when compared between female and male it was evidenced that male presented a higher Waist diameter that was conserved in the age bins analysed (Figure 4). Also, the diameter of the waist was higher in male against female, but the difference was conserved only in the 66-70 and the 71-75 age bins. The Hip diameter was higher in females than male in the total average, but through the age-bin comparison was found a significant difference in the 60-65 bin. The tight diameter was higher in Female against male (total average), and when analysed the age bins it was found higher values in female only in the 60-65 and 66-70 age bins. The diameter Leg was higher in male than females (total average), and when analysed the difference through the age bins the value was higher in males only in the 71-75 age bin. It was not found any difference in the total average and the age bins values (Figure 5). Also associated to the calculation of the somatotype several fat folds were measured, it was evidenced that all the fat folds had higher values in females than males (total average), despite this when compared through the age bins the supraspinal and suprailiac show statistical higher values in female against the male in every age bins compared. The calf fold and tricipital, for females, show statistical higher values in every age bins, except the 75-80 age range. The Bicipital and the Subscapular folds show higher female values, only in the 60-65 and 65-70 age bins (Figure 5). It was found that in the male group the diameter of thigh decreases with the age and statistical significance was evidenced in comparison among the age bins (Figure 4). Also was found a statistical difference in the ANOVA analysis for the diameter waist in males but no significant differences were established among the age bins (Supplementary Table 2).
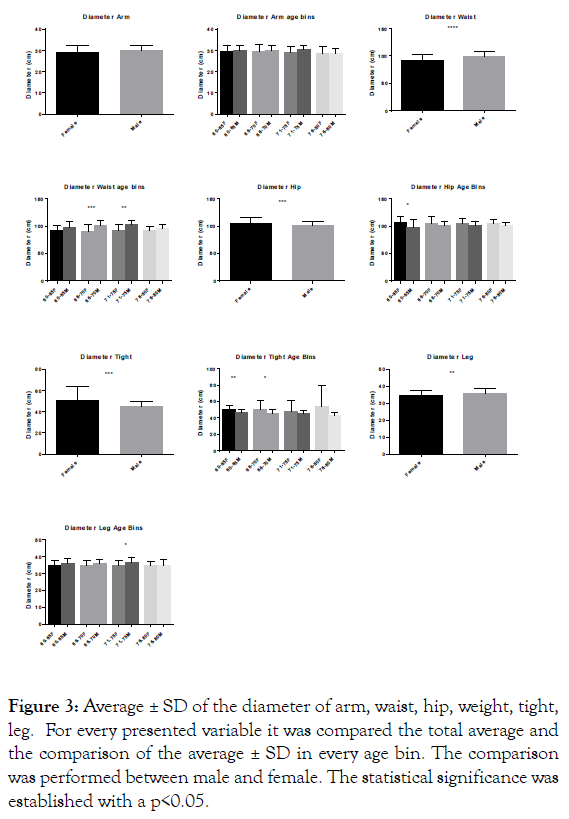
Figure 3: Average ± SD of the diameter of arm, waist, hip, weight, tight, leg. For every presented variable it was compared the total average and the comparison of the average ± SD in every age bin. The comparison was performed between male and female. The statistical significance was established with a p<0.05.
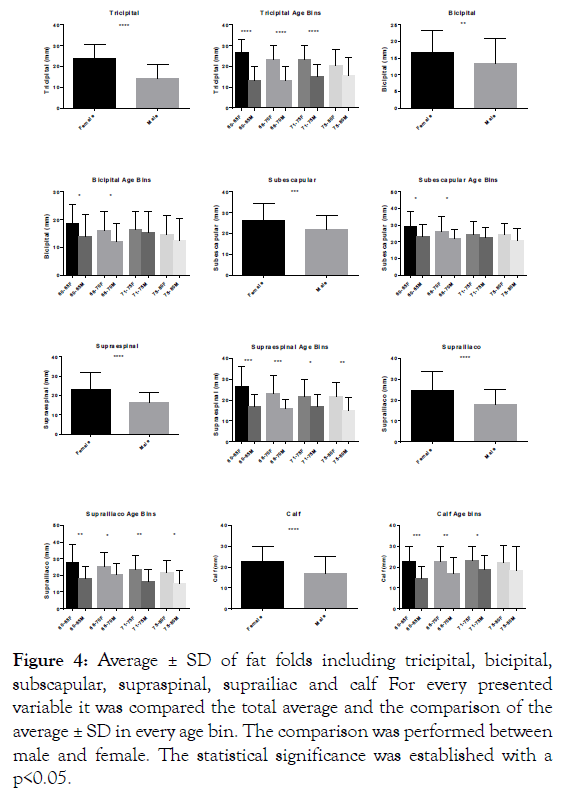
Figure 4: Average ± SD of fat folds including tricipital, bicipital, subscapular, supraspinal, suprailiac and calf For every presented variable it was compared the total average and the comparison of the average ± SD in every age bin. The comparison was performed between male and female. The statistical significance was established with a p<0.05.
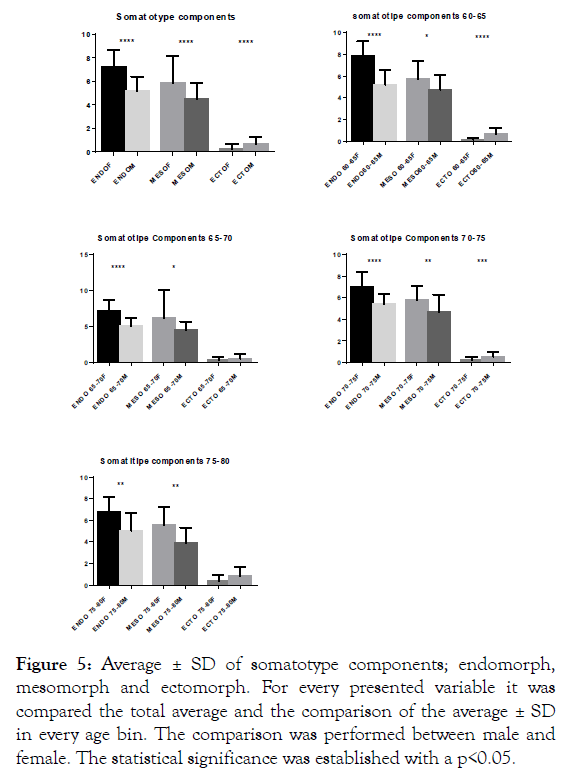
Figure 5: Average ± SD of somatotype components; endomorph, mesomorph and ectomorph. For every presented variable it was compared the total average and the comparison of the average ± SD in every age bin. The comparison was performed between male and female. The statistical significance was established with a p<0.05.
Regarding the somatotype components calculated in the experimental groups, it was found a higher endomorphic and Mesomorphic components and a lower ectomorphic component of the somatotype in females when compared to males. Additionally, this difference was permanent trough the age bin analysed (Figure 6). Additionally, with the Mesomorphic, ectomorphic and endomorphic component of every patient, it was calculated the representation in the somatochart. The complete assignation of the patient in the categories mentioned in the methodology is presented in (Table 1). Considering the calculation of the coordinates of every person, it was asses the frequency of several categories of the traditional somatotype characterization (Table 1). In the two general groups, the most frequent somatotype was Mesoendomorphic (4-3-2), but the corresponding frequency was higher in Males than females. Also, the Endo-Mesomorphic (4-4-2) show higher in frequency in females than males. When compared the representation of the complete set of patients in the somatochart it was evident that most of the patient does not fit with the classic categories of the somatotype represented in the (Figure 1). The representation in the somatochart is performed through the use of 2 coordinates (X and Y) for a two-dimensional representation. When compared the 2 coordinates through the bins age, it was evident a significant difference in the X component of the somatotype calculation in the different age bins when compared male and female, interestingly it was not found any difference in the Y component of the somatochart representation between male and female (Figure 7). When compared the progression of the coordinates through the ageing process no differences were found in males, but in the female group, it was found a diminish of the X component of the somatotype representation when compare the 60-65 age bin against 75-80 age bin (Figure 8). Consequently, to this observation, we found a displacement of the average somatotype when displayed in the somatochart (female 60-65 against 75-80 age bin (Figure 9).
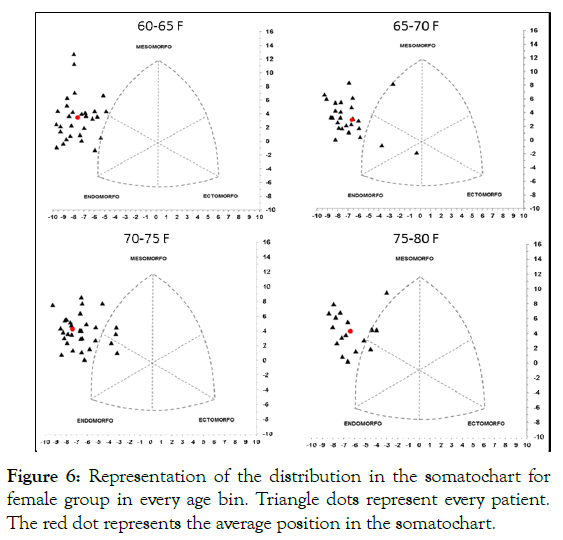
Figure 6: Representation of the distribution in the somatochart for female group in every age bin. Triangle dots represent every patient. The red dot represents the average position in the somatochart.
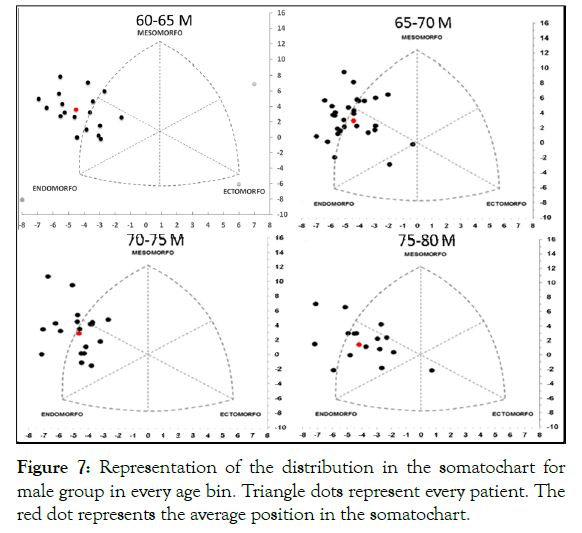
Figure 7: Representation of the distribution in the somatochart for male group in every age bin. Triangle dots represent every patient. The red dot represents the average position in the somatochart.
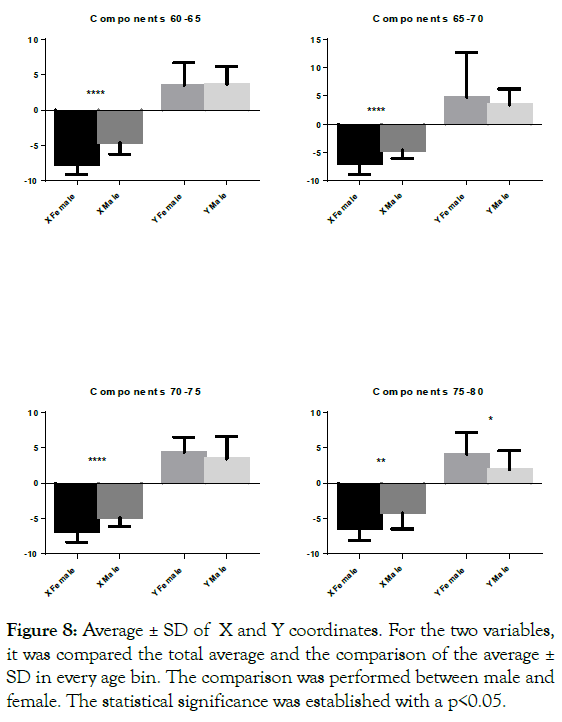
Figure 8: Average ± SD of X and Y coordinates. For the two variables, it was compared the total average and the comparison of the average ± SD in every age bin. The comparison was performed between male and female. The statistical significance was established with a p<0.05.
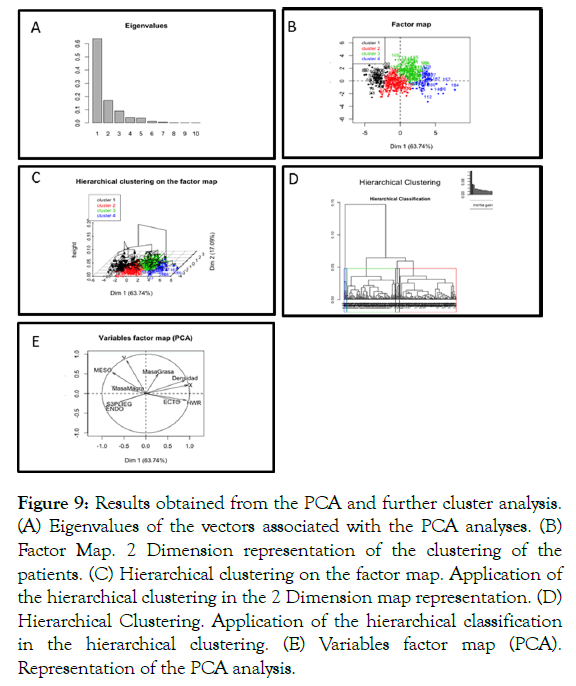
Figure 9: Results obtained from the PCA and further cluster analysis. (A) Eigenvalues of the vectors associated with the PCA analyses. (B) Factor Map. 2 Dimension representation of the clustering of the patients. (C) Hierarchical clustering on the factor map. Application of the hierarchical clustering in the 2 Dimension map representation. (D) Hierarchical Clustering. Application of the hierarchical classification in the hierarchical clustering. (E) Variables factor map (PCA). Representation of the PCA analysis.
Additionally, we perform a Principal component analysis to evaluate the key variables that explain the clustering behaviour of the data. Using ten variables, we perform hierarchical cluster analysis to improve the assignation of the somatotype. It is presented the Eigen Values, the factor Map, the hierarchical clustering on the factor map and the cluster identify in the hierarchical clustering. Also, are presented the principal vector identify in the PCA analysis (Figure 2)
From the analysis of the data, it is evident that males show higher weight, height, Density and Free fat mass. Interestingly these variables in this group of patients did not show any differences through the age bins. Also, females show higher values of BMI, the percentage of corporal fat and kg of lean mass. Interestingly in Male, we did not found any statistical evidence of a change of the variables through the age bins, from our point of view this is equivalent to state the non-modification from the 60 to 80 years old.
On the other hand the following variables, in females, present modification through the age bins analysed. From our point of view, this is indicative of a subpopulation of parameters that modify trough the ageing process. Associated to the changes analysed in the ageing process particularly interesting was the diminish in Free fat mass, and the concomitant increase in the percentage of body fat and density appreciated in females. Also regarding the measurements of diameter, it was evidence that Males show higher diameter Waist and Leg and females show higher diameter Hip and Tight. Interestingly the mentioned variables did not show significant differences for the same gender group (male or female) through the age bins analysed, and this implies that these variables did not change through the ageing process.
Related to the calculation of the somatotype component it was found a higher endomorphic, and mesomorphic component and a lower ectomorphic component in females compares to males. According to his anthropometric distribution could be interpreted has females having higher relative adiposity and robustness component and a lower skinner shape. In this context, there are no comparative studies in the same population. However, when compared these results present the same proportion to another different population. The ethnic group Han in China present the same proportion in somatotype of older than 60 Males, the highest frequency group was the Endo-Meso category in males, this category was the higher in frequency, but the magnitude described was increasing through the ageing process [21]. Interestingly in Females, it was found a similar pattern through the ageing process although, in elderly females, it was found a higher prevalence of Endo-meso somatotype category in Chilean population [21]. Also when compared to younger somatotype studies it was evident that the majority of subjects could not be adequately classified using the classic somatochart.
Interestingly after performing the assignation of the somatotype, many of the represented subjects were out of range. This inadequacy of the standard somatotype calculation and assignation process has been described for younger populations, for example for UK offshore workers it was evident deviations in the somatotype assignation, and a PCA and Clustering algorithm was applied [22]. In this context to optimise the assignation of the somatotype in the older adults age group. It was performed an analysis of PCA and further cluster analysis, we found that 4 clusters were the main groups for female and male, and the key variables used for the representation of the somatotype were Mesomorph, Y component, Lean Mass, S3 fold, Endomorph, Ectomorph, HWR, Density and X component. In this context, it is our firm belief that we could elaborate equations that predict the weight and overall metabolic status using a subpopulation of the mentioned variables (currently under work). This approach of prediction of health component using anthropometry has been used for the prediction of developing metabolic syndrome for adults [23] and particularly for women [24]. Also, anthropometric measurements have been related to the development of diabetes type 2 [25]. In this context in the literature has been published the correlation of some new biochemical markers like ceramides with the incidence of Cardio Vascular Diseases (CVD) [26]. An engaging projection would be the establishment of positive correlation among anthropometric parameter and biochemical markers with the incidence of CVD. In this context, some evidence had correlated the incidence of blood hypertension and hand grip force [27-29]. Our research group is currently working on this issue.
Additionally, the anthropometric measures have been described as essential tools for social welfare. In this context the production of measures that could improve the design of new products, it is more useful in the form of means and standard deviations, by gender and age bins this data it is presented in the Supplementary Tables 1-3. However, another critical factor that affects the aspect of body growth and size are culture, social behaviour and social economy [30]. Additionally has been supported in the literature that the traditional disease-approach of the public health policies it is inadequate in the elderly. Rather than the presence of a disease, the primordial consideration would be the independent functioning. The full study of the component of the self-functioning in older patients it is a much better predictor of the survival and other important outcomes [31]. In this context, one particular critical approach suggested by the OMS consist in developing a new composite health score that includes the physical, cognitive and biometric assessment that could be related to the natural selffunctioning capacity [32]. Our research group is currently working on this issue.
FONDEF PROGRAMA IDeA–PRIMERA ETAPA DE CIENCIA APLICADA ID17AM0023
FONDEF PROGRAMA IDeA–PRIMERA ETAPA DE CIENCIA APLICADA ID17AM0023
Citation: Bravo V, Caparros C, Zúñiga R, Muñoz J, Nicholis O, Barra R (2019) Anthropometric Study among Chilean Older Adu. J Ergonomics 9:244.
Received: 18-Apr-2019 Accepted: 20-May-2019 Published: 27-May-2019 , DOI: 10.35248/2165-7556.19.9.244
Copyright: © 2019 Bravo V, et al. This is an open-access article distributed under the terms of the Creative Commons Attribution License, which permits unrestricted use, distribution, and reproduction in any medium, provided the original author and source are credited.