Journal of Proteomics & Bioinformatics
Open Access
ISSN: 0974-276X
ISSN: 0974-276X
Research Article - (2018) Volume 11, Issue 3
Proteins are of key importance in virtually every cellular process but many proteins have still not been annotated with functions due to experimental difficulties involved with functional assays. To address this problem, many computational methods based on sequence homology, three-dimensional structure, genomic context, and gene expression were developed to predict functions of proteins. Here, we tested the performance of a novel approach that is motivated by the concept of bacterial operons. To predict the substrate specificities of membrane transporters we combined genomic context-based methods with Gene Ontology and gene expression data whereby using SVM for classifying genes. We found that in Escherichia coli, the substrate-specificities of membrane transporters can be predicted with ca. 90% accuracy from the biological functions of co-expressed neighboring genes. In Saccharomyces cerevisiae and Homo sapiens, the respective accuracies are lower at around 80%. When applying the same strategy to enzymes of four metabolic classes of Escherichia coli, we found lower accuracies of 77% (2-class prediction) and 68% (4-class prediction), respectively. This suggests that transfer of functional associations between co-expressed neighbor genes may be case-specific
Keywords: Protein functional annotation; Membrane transporter; Gene Ontology; Gene expression; Gene neighbor; Co-expression; Support vector machine; Substrate classification
In times of high-throughput sequencing and transcriptomics, the amount of sequencing data is quickly piling up. Yet, may proteins have still not been annotated with their cellular functions due to experimental difficulties (time-consuming and costly) involved with functional assays [1]. To address this problem, many computational methods were developed to predict the functions of proteins. The earliest methods were based on the sequence homology between proteins or on sequence motifs of proteins (e.g. PRINT-S [2], BLOCK [3], PROSITE [4], InterPro [5], transport DB [6]. As proteins exist and work as threedimensional structures, protein structures are also a valuable indicator of similar functions between proteins [7]. Other prediction methods consider the genomic context [8-10] or their neighborhood in protein-protein interaction networks [11-13]. Recently, also some tools using natural language processing have been presented (e.g. GOstruct [14], Text-KNN [15] and PPFBM [16].
An important yet neglected field is that of membrane proteins. According to Krogh et al. [17], about 21% of the Escherichia coli genes encode transmembrane proteins. The corresponding numbers are 21% in Saccharomyces cerevisiae, 30% in Caenorhabditis elegans and 20% in Arabidopsis thaliana. Transmembrane proteins play important roles, especially in mediating the interaction between cells and their surroundings. Thus, membrane proteins are important targets for drugs (about 60% of all modern medical drugs [18]). Of particular interest for the prediction of protein function is the subgroup of membrane transporters because they comprise the second largest protein family in H. sapiens, next to G-protein coupled receptors. However, it is experimentally hard to identify their substrate specificities [19].
Previously, substrate specificities of membrane transporters have been predicted, for example, based on sequence homology [20] and amino acid composition [21-23]. Meta-methods that combine different features for functional annotation often gave improved performance compared to single-feature methods. For example, Yayun Hu et al. used four sequence features including amino acid composition, transition and distribution properties, position-specific scoring matrices, and biochemical properties to annotate the substrate specificity of ABC transporters [24]. They reported an accuracy of 88% to distinguish between four classes of ABC transporters. Still, it is worthwhile to characterize the benefits of individual features before combining them with others.
In this study, we combined genomic context-based methods with Gene Ontology (GO) annotations [25] and gene expression data. One motivation behind considering the co-location and co-expression of neighboring genes is the principle of operons in bacterial genomes. Genes in an operon are controlled as a single unit by a single promoter [26] and thus are either expressed together or not at all. They are usually related in function too [27]. Also genes in eukaryotic genomes have been reported to have a tendency to cluster when showing similar expression, and the genes in these clusters tend to have related functions [28-33]. Wang and colleagues, as well as Barkai and colleagues showed that if two eukaryotic genes have the same expression levels in different conditions, they are likely to be members of the same protein complex or to participate in the same biological pathways [34,35]. Also, Lee and Sonnhammer reported that genes involved in the same biochemical pathways tend to gather in various eukaryotic genomes [31]. These relationships between gene co-expression, neighborhood and functions have been frequently exploited in functional genomics studies, e.g. to predict protein interaction partners [36,37], to identify and analyze gene position clusters [38] and by the STRING database [39]. A quasi-standard for functional annotation is the controlled vocabulary compiled by the Gene Ontology Consortium [25]. The Gene Ontology (GO) annotations can be used in functional profiling, functional categorizing and to predict gene function [40]. Here we combined these techniques and tested how well this method works in prokaryotes and eukaryotes.
To predict the functions of a protein, we first retrieve the neighboring genes of the respective protein-coding gene and then compute the co-expression correlation between this central gene and its neighbors. The GO term lists of the central gene and of the neighboring genes that exhibit the highest correlation to the central gene are used to create input data for a support vector machine (SVM) classifier. SVM models are then used for classifying the function of so far uncharacterized genes.
Dataset
For training and testing of the classifiers, we selected the wellstudied model organisms Escherichia coli and Saccharomyces cerevisiae as well as Homo sapiens. For all three organisms, transporter proteins were selected. For, E. coli also metabolic enzymes were selected.
These proteins are called central proteins (and the genes encoding these are called central genes thereafter) to distinguish them from their neighboring genes.
Transporter proteins
From the Transporter Classification Database (TCDB) [41] we retrieved two sets of membrane transporters that facilitate the transport of either amino acids or sugar molecules across the membrane. (Table 1) lists the number of proteins for the three organisms.
| Organism | Escherichia coli | Saccharomyces cerevisiae | Homo sapiens |
|---|---|---|---|
| Group | |||
| Amino Acid Transporters | 47 | 24 | 37 |
| Sugar Transporters | 39 | 17 | 13 |
Table 1: Number of transporters belonging to different groups and organisms according to TCDB.
Enzymes in metabolic pathways
Beside transporter proteins, we also used enzymes of metabolic pathways in E. coli to test our method. Four groups of metabolic pathways involved in carbohydrate, lipid, amino acid, and nucleotide metabolisms were collected. The lists of enzymes for each group were downloaded from the Kyoto Encyclopedia of Genes and Genomes (KEGG) pathway maps, under the tag “metabolism” and the four respective sub-tags, e.g. carbohydrate metabolism, lipid metabolism, nucleotide metabolism, and amino acid metabolism [42]. The gene identifiers of the four groups are listed in Supplement Table 1. The groups contain 187 genes (amino acid metabolism), 253 (carbohydrate metabolism), 45 (lipid metabolism), and 99 genes (nucleotide metabolism), respectively.
Data used for functional annotation
Neighboring genes: From the BioCyc database, we downloaded information about all genes of Escherichia coli, Saccharomyces cerevisiae, and Homo sapiens [43,44]. We then rearranged the list of E. coli and S. cerevisiae genes according to increasing genomic positions.
Homo sapiens genes were first split into separate chromosomes, and then sorted according to the genomic position. Sorting these files helps in finding neighboring genes more easily. We use the term neighboring genes for the closest genes on the same chromosome.
GO terms: We retrieved tab-delimited files with gene symbols and GO terms from the Gene Ontology Consortium [25].
Microarrays data: We used Pearson correlation to measure the co-expression of genes. For Escherichia coli, we used preprocessed and normalized microarray expression data from Dataset Record GSE1121 [45] whereas for Saccharomyces cerevisiae we used respective data from Dataset Record GDS91 [46]. For H. sapiens, we used data for colon adenocarcinoma (COAD) patients from TCGA, but only selected data files from normal samples. After finding neighboring genes, the coexpression correlation between a gene and its neighbors was computed as:
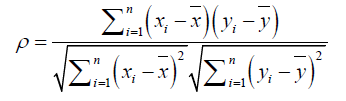
where:
xi is expression value of gene x in ith sample
yi is expression value of gene y in ith sample
n is the number of samples
 and analogously for ͞y
Classification
Figure 1 shows the basic steps in this project. To retrieve the neighboring genes, we look for them both upstream and downstream of the current gene. The number of neighbors upstream, is denoted as n, is equal to the number of neighbors the downstream. The number of selected neighbors that possess highest co-expression correlation with current gene is denotes as N. A pair of number of neighbors and number of selected neighbors are written as (n, N) which we refer to as window size. In the result section, we show the results for three different window sizes (5, 3), (10, 3), and (20, 5).

Figure 1: The workflow of basic steps in this project.
Training and testing data for SVM
The dataset of each organism was split into two subsets, the training set and the test set. In this project, we used one record for testing and all other records for training. Then for each protein group in the training set, we created two lists. One list contains the selected genes and the other list contains all the neighbors of the selected (central) genes. After that we retrieved the GO terms for every gene in these lists. From then on we only worked with these lists of GO terms. For example, if we have two groups of transporter proteins (amino acid transporters and sugar transporters), then we have four lists of GO terms (the first list contains all GO terms of all amino acid transporters in the training set, the second list contains all GO terms of all neighboring genes of these amino acid transporters, the third list contains all GO terms of all sugar transporters in the training set, and the fourth list contains all GO terms of all neighboring genes of sugar transporters).
For each central gene in the training set, we selected maximum N neighbors that have the highest co-expression correlation with the central gene. Then we identified the GO terms for each selected neighbor. After that, we computed the percentage of GO terms that are contained in each GO list. If this percentage was greater than or equal to a pre-selected threshold (r) then we assigned the value 1, otherwise we assigned the value 0. As a test, we also used real-valued functional similarities obtained from GOSemSim [47]. Yet, this strategy gave results of lower quality than the binary-valued approach. Using binaryvalue has a disadvantage, because a higher threshold (r) yields more 0 values. For some cases we did not obtain a value of 1 at all, and a vector with all 0 values is not usable for SVM. Supplementary Tables 2-4 summarize the number of genes that we found suitable to use to build the models. For gene ArtQ of E. coli (Figure 2) in the training set, for example, we selected the neighbors that had the highest co-expression levels (ArtM, ArtI and ArtP). If neighbor ArtI is selected, we compute what percentage of its GO terms are contained in each of the four lists of GO terms. If this percentage is greater than or equal to a pre-selected threshold (r) then we assigned the value 1, otherwise we assigned the value 0. Since we have four GO term lists, this gives four values. If we select three neighbors that have the highest co-expression correlation then we have 3 x 4=12 values of 0 or 1. We used these twelve features together with the group’s names, that were converted to positive integer values, as class label to train the classifier. These steps were repeated for all genes in the testing set.

Figure 2: Co-expression levels of central gene ArtQ and its neighboring genes.
Support vector machine classification
Support Vector Machine classification [48] of substrate specificity or of participation in metabolic pathways was done with the software LIBSVM [49]. LIBSVM can efficiently classify samples into multiple classes, it automatically selects a model which can generate contours of the cross validation accuracy, it makes cross-validation for model selection and treats unbalanced data by using a weighted SVM. In this project, we used leave-one-out cross validation. LIBSVM also provides various kernel functions and different SVM formulations. We tested our method with three kernel functions (linear, radial basis function (RBF), and sigmoid). In most cases with different threshold r, number of neighboring genes or organisms, RBF gave the best results. Then we proceeded using RBF and tested for different values of the cost parameter (0.1, 0.5, 1. 1.5, 5 and 10). The default cost parameter of 1 gave the best results. A lower value of 0.1 gave the worst accuracies. The reliability increases substantially when cost changes from 0.1 to 0.5. The accuracies of S. cerevisiae changed by 15%, accuracies of E. coli by 5.6 % and of H. sapiens by 11.6% at most, respectively. With cost parameter greater than or equal to 1, the accuracies did not show remarkable changes. We also tested four different values of the gamma parameter (1.0, 0.8, 0.5, 0.3 and default value of gamma). The default value of gamma gave better accuracies than other values in most of the cases. For this reason, we kept the default values of all the parameters.
Model validation and evaluation
We used leave-one-out cross validation to evaluate the prediction ability of our model. In the leave-one-out cross validation, one record was used for testing, all others were used for training. The process of training and testing was repeated until all records had been used for testing once. Accuracy (ACC) was evaluated in the usual way as:
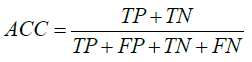
where TP, FP, TN and FN are true positive, false positive, true negative, and false negative, respectively.
Transporter proteins
For illustration, Figure 2 shows that the E. coli gene ArtQ has large co-expression levels with several neighbors (ArtM, ArtI and ArtP) for the selected microarray dataset. As suggested by the very similar gene names, all these genes transport amino acids. Thus we predict that ArtQ also transports amino acid.
First we set the number of upstream and downstream neighbors to 10 each and selected the 3 neighbors with highest co-expression correlation. Figure 3 shows the results for three different thresholds r.

Figure 3: Effects of the similarity threshold r of GO terms on the accuracy of transporter substrate classification.
When the threshold r was increased from 0.2 to 0.5, all accuracies increased likewise (E. coli: from 87% to 90%, S. cerevisiae: from 76% to 78%, H. sapiens: from 77% to 82%). When the threshold was increased further from 0.5 to 0.8, the accuracies of E. coli and of S. cerevisiae increased further whereas that of H. sapiens decreased slightly. For H. sapiens, more sugar transporters were incorrectly classified than amino acid transporters, although the number of amino acid transporters is much larger than the number of sugar transporters (Table 2 and Figure 4).
| Organism | Transporter substrate | r = 0.2 | r = 0.5 | r = 0.8 | |||
|---|---|---|---|---|---|---|---|
| Correctly classified | Not correctly classified | Correctly classified | Not correctly classified | Correctly classified | Not correctly classified | ||
| E. coli | Sugar | 18 | 3 | 15 | 3 | 14 | 2 |
| Amino acid | 22 | 3 | 22 | 1 | 17 | 1 | |
| S. cerevisiae | Sugar | 5 | 2 | 5 | 2 | 5 | 1 |
| Amino acid | 11 | 3 | 10 | 2 | 7 | 2 | |
| H. sapiens | Sugar | 3 | 7 | 3 | 6 | 4 | 3 |
| Amino acid | 30 | 3 | 28 | 1 | 15 | 2 | |
Table 2: Number of genes that were correctly and incorrectly classified.

Figure 4: Prediction accuracy for different window sizes.
Next, we varied the number of neighbors while keeping the threshold r at 0.5. Fig. 4 shows the results for three cases where the windows sizes were (5, 3), (10, 3) and (20, 5), respectively. (10, 3) gave the best result for all three organisms. For comparison, we compared our tool against two webservers that predict substrate specificities of membrane transporters from the protein sequence: (1) TrSSP (http:// bioinfo.noble.org/TrSSP/) [50] using the options “AAindex + PSSM based (Swissprot)’’ and (2) TransportTP (http://bioinfo3.noble. org/transporter/) [51] using an E-value threshold = 0.1. The results obtained with these methods are listed in Table 3. Our method gave superior results (90% accuracy and higher) than TrSSP (64% in the best case) and TransportTP (54% in the best case) for Escherichia coli sequences. TransportTP did not provide useful results for Saccharomyces cerevisiae and human sequences. The results of TrSPP for human sequences were of comparable accuracy to those of our tool. For Saccharomyces cerevisiae sequences, TrSPP provided better results than our tool. In addition, it should be noted, that our method was only able to make predictions for transporters which have non-zero features (see methods, paragraph “Training and testing data for SVM”).
| organism | group | Number of sequences | TrSSP | TransportTP | ||
|---|---|---|---|---|---|---|
| Correct | Accuracy | Correct | Accuracy | |||
| Escherichia coli | aa | 47 | 23 | 48.94% | 10 | 21.28% |
| sugar | 39 | 25 | 64.10% | 21 | 53.85% | |
| Saccharomyces cerevisiae | aa | 24 | 20 | 83,33% | 0 | 0.00% |
| sugar | 17 | 16 | 94,12% | 0 | 0.00% | |
| Homo sapiens | aa | 37 | 31 | 83,78% | 0 | 0.00% |
| sugar | 13 | 10 | 76,92% | 0 | 0.00% | |
Table 3: Comparison against alternative methods for predicting substrate specificities.
Metabolic pathway enzymes
Next we tested the same approach for the genes coding for enzymes belonging to different groups of metabolic pathways of E. coli. Supplement Table 3 shows that, when the number of neighbors was extended, the number of genes that can be used by SVM decreased. In consequence, the accuracies decreased when we considered more neighbors (Figure 5). This characteristic was not found for the transporter proteins.

Figure 5: Accuracies of different thresholds r and number of neighbors when testing with enzymes of the sugar and amino acid metabolism.
After testing with two groups, we tested the method with the four groups of genes involved in sugar, amino acid, lipid, and nucleotide pathways, respectively. Figure 6 shows that the accuracies relative to the random prediction (25%) are increased compared to the previous test. Secondly, the threshold r had only a small effect when we extended the number of neighbors to (20, 5).

Figure 6: Accuracies of 4-class prediction for different thresholds and number of neighbors when testing with enzymes belonging to the sugar, amino acid, lipid and nucleotide metabolic pathways.
The main findings of our study are:
a) The function of membrane transporters and of metabolic enzymes is best associated with that of its co-expressed neighbor genes for E. coli, followed by S. cerevisiae, and by H. sapiens.
b) The substrate-specificities of membrane transporters can be classified better than the membership of enzymes to four major metabolic pathway classes.
The first finding had to be expected. Operons exist in bacteria and rarely in eukaryotes (S. cerevisiae and H. sapiens). Junier and Rivoire recently reported that the 2034 genes of E. coli are arranged in 740 synteny segments [52]. They found that co-expression occurs at high levels within synteny segments and low levels outside. However, it was also suggested that functionally related genes are grouped together in bacteria outside of operons in the form of so-called “uber-operons” [53].
In yeast, the most highly co-expressed pairs of neighbor genes tend to be similar in function [30,54]. Adjacent genes are frequently (more than 25%) transcribed in the same phase(s) of the cell cycle [28].
For H. sapiens, Wang and colleagues recently compared the expression profiles of bulk tissue of glioblastoma patients to expression profiles at single-cell level [35]. Interestingly, they found that co-expression in bulk samples was stronger associated with similar gene function than that in single cell samples. In the latter case, co-expressed genes showed a stronger tendency to physically interact with each other. Nevertheless, our results show that the biological functions of co-expressed neighbor genes are in all three investigated species associated with the function of the central gene.
When compared to results obtained the alternative method TrSSP, our method gave superior results for E. coli transporters, results of comparable quality for human transporters, and results of slightly lower accuracy for S. cerevisiae transporters. Since both methods take quasi orthogonal approaches, it appears worthwhile to combine both methodologies in the future.
Now we turn to the question why function prediction gave better results for the membrane transporters than for metabolic enzymes. To us, this came as a surprise. In Arabidopsis thaliana (which was not studied here), Ren and colleagues reported that co-functionality was in most cases a poor predictor of co-expression, also for neighboring genes [55]. When turned around, this suggests that co-expressed and gene neighborhood cannot be taken as guarantee for co-functionality, at least not in eukaryotic genome.
Cui and colleagues recently analyzed correlations of the expression levels of neighboring genes in H. sapiens [56]. Interestingly, they distinguished between four types of genes: housekeeping genes, specific and selective genes that are either preferentially or exclusively expressed in response to physiological stimuli, and repressed genes. Importantly, they found that the direction of transcription of gene pairs (parallel or antiparallel) has at most a weak effect on the level of co-expression. This supports the approach taken in our study where we have ignored directionality of genes. Compared to randomly selected gene pairs, preferentially expressed and repressed genes showed a substantially higher co-functionality. Interestingly, this was not the case for neighboring housekeeping genes and exclusively expressed gene pairs that showed an even lower co-functionality than randomly selected gene pairs.
These results show that functional associations may be quite case-specific.
In this work, we focused on the classification of integral membrane transporters from three organisms (E. coli, S. cerevisiae and Homo sapiens) according to their transported substrates. The idea was to identify among the close neighbors of a query gene with unknown function those genes that show high co-expression with this gene. Then, we identified frequent GO terms among these co-expressed neighbors and used a support vector machine classifier to annotate the substrate specificity of the query gene. Training of the method was performed on groups of known amino acid and sugar transporters. For transporter proteins, the average accuracies of E. coli, S. cerevisiae and Homo sapiens were 89%, 78%, and 79%, respectively. When tested on the genes belonging to different metabolic pathways of E. coli, the average accuracy was 75% (two classes) and 67% (four classes). In future works, this approach may be used in combination with other features such as sequence motifs, sequence similarity, and further characteristics of the protein sequence such as its amino acid composition.