Journal of Geology & Geophysics
Open Access
ISSN: 2381-8719
ISSN: 2381-8719
Research Article - (2014) Volume 3, Issue 2
Waste is a major health hazard with a very high potential to undermine people’s right to life, and a threat to the environment. In India, waste is generally littered on roadsides and mostly dumped in the outskirts of the cities in areas that are low lying without compliance with the regulations. Proper and sustainable waste management can be achieved through the establishment of appropriate channels for the collection, transportation and disposal of wastes. The aim of this study was to find out the sustainability scenario of solid waste management with respect to the rising population in the city of Hyderabad. The use of Geographical Information System (GIS) was of great essence in classifying the city into sustainability classes based on the grouping of different municipal wards based on the per capita waste generated by each. It was generally found out that a bigger percentage of the municipal wards are low in sustainable waste management. A considerably significant number of the wards were rated ‘very good’ in sustainable waste management. Such areas included Gunfoundry, I.S. Sadan, Kishanbagh, and Attapur.
Keywords: Geographical Information System, Analytical hierarchy process, Hyderabad urban agglomeration, Municipal wards, Greater Hyderabad Municipal Corporation
The observed trend of waste material is a continually growing issue of concern not only at local or regional levels but also at the larger global level. Ramachandra and Bachamanda [1] defined solid wastes as the organic and inorganic waste substances produced through the various societal activities and have lost value to the first user. Municipal Solid Wastes (MSW) as defined by Sahu [2] is the commercial and residential wastes produced at the municipal level or a notified area. The waste could either be in solid or semi-solid form and excludes industrial hazardous wastes but includes treated bio-medical waste products.
The main problem of urban waste management is worth noting not only due to the large quantities of waste produced and the spatial spread, but also the problems encountered in the setting up of the systems for collection, transportation and disposal of the wastes [2,3]. A study conducted by the Centre for Ecological Sciences and Centre for Sustainable Technologies indicates that the cumulative requirement of land disposal of MSW in the entire nation may get to around 1400 km2 by the year 2047 [4]. The rising trend in municipal waste production is attributed to the ever-increasing population [5] which has resulted in pressure to the ecosystem in virtually all ways.
i. To map the population density and solid waste characteristics of the municipal wards of Hyderabad.
ii. To determine the main sources of waste generators and waste characteristics in Hyderabad.
iii. To determine the sustainability ratings of municipal wards of Hyderabad and the expected future waste generation trends.
The area under study is the city of Hyderabad Urban Agglomeration situated in the state of Andhra Pradesh. Hyderabad is the capital city of Andhra Pradesh and is the sixth largest city in India, closely behind Bangalore [6]. The city has been divided into five (5) zones namely North, South, East, West and Central zones with 18 circles and around 150 municipal wards. The number of sanitary workers in the city, both public (Greater Hyderabad Municipal Corporation [GHMC]) and private is around 20,102.
The study made use of data gathered from the Greater Hyderabad Municipal Corporation. The data included population information of Hyderabad municipal wards, volumes of waste generated and the predicted future trends in waste management. The data obtained was fed into GIS software for the generation of spatial maps to show the population distribution and the extent of waste management in various wards, rated using the Analytic Hierarchy Process (AHP) standard classes.
The study considered making use of secondary data obtained from the GHMC. Secondary data was used based on the size of this study area. Collection of data for the whole Hyderabad was not possible because of the scarce resources and limited time. However, the researcher utilized the most recent data from GHMC. The information acquired highlighted the status of waste management in Hyderabad city, discussed under sources and characteristics of the wastes, wastes collected and transported to disposal sites, availability of the number of sanitary workers, predicted future trends in waste production with respect to population density. Based on the per capita solid waste generation data of the wards in the city, GIS analysis was performed and the wards were categorized into different groups to show their sustainability.
AHP was used to rank the zones in respect to their per capita waste generation. AHP is a tool that deals with complex decision making processes. It helps in making decisions and setting priorities. AHP uses evaluation criteria and alternative options. In this case, the per capita waste generation was used to rank the zones into five groups.
Population characteristics of municipal wards of Hyderabad
The city of Hyderabad is ranked the sixth largest urban agglomeration in the entire country. The population growth experienced (4.3 to 5.7 million) during the decade 1991-2001 is further expected to continue to increase by 13.64 million 2021 (Singh, 2010). Courtesy of the Greater Hyderabad Municipal Corporation (GHMC), the city is divided into five zones whose average population densities in persons per square kilometer are: East zone (7899.86), South zone (32777.42), Central (27257.28), West (6684.3) and North (16590.98) zones.
Solid waste in Hyderabad
Urban areas in the state of Andhra Pradesh have generated solid waste more than 11.5 thousand tons/day which is a 9% of all solid waste generated in India. Every individual in Andhra Pradesh generates solid waste on an average 570gm/day which is close to other states, such as, Tamil Nadu (630 g/day) and Jammu and Kashmir (600 g/day). Greater Hyderabad generates about 5,000 tonnes of waste per day (TPD), which accounts for 1.83 million tons per year [7]. It is an appalling phenomenon how wastes in Hyderabad, just like in other cities, can be thrown from one’s house without considering the long-term effect of the same. Much as there are waste containers provided by the GHMC, dumping wastes anyhow is not a concern to some people. One of the adverse effects is the loss of the natural attraction of River Musi which separates the old from the new city of Hyderabad [8].
Solid waste generation patterns in Hyderabad
The solid waste generation pattern is categorized under the social aspects of municipal solid waste management, which also include the handling of households, waste management at the community level and the social conditions of the sanitary workers. In Hyderabad, the main determinants of the waste generation pattern are people’s attitudes and the social orientation of the sanitary workers [7].
Solid waste management in Hyderabad
The management of solid wastes is a main public health and environmental concern especially in the urban regions of the developing countries [9]. In Hyderabad for instance, it has been noted that the management of solid wastes is granted low priority compared to other sectors. The government has provided very little funds for the management of solid wastes yet the waste produced is increasing with the increase in population [10].
Sustainability of wards
It is the responsibility of the urban local bodies to take care of the waste management in the respective municipal wards due to the public and the local nature of the service [11]. Total solid waste management (SWM) can be achieved through the effective implantation of the Municipal Solid Wastes (Management and Handling) Rules, 2000. Schedule – II (Rule 6 (1) and (3), 7 (1) takes care of the collection, segregation, storage, transportation, processing and disposal of municipal solid waste [12].
Most of the waste is dumped on land in an uncontrolled manner, and the disposal situation is expected to deteriorate due to rapid urbanization. Waste disposal sites are subject to rising opposition and it is deemed complicated to get new sites that meet public approval and are situated away from the collection area [13]. The urban challenge is that poor, inaccessible and marginal municipal wards suffer from insufficient service and infrastructure which in turn worsens poverty, ill health and social marginalization. In this regard, many of the waste sources are inaccessible and reached only by roads or alleys which are unsuited for certain methods of transport. This is because of their width, congestion, slope or surface. In terms of manpower, that is, the sanitary workers, the number is quite low compared to the large quantities of solid wastes generated [13].
Waste generation and management
The waste management involves proper channels of waste collection, transportation and disposal [14]. In order to understand waste generation and management, the number of sanitary workers (both public and private) was taken as a measure against the total waste being generated in different regions of the Hyderabad. The details are presented in Table 1 and also illustrated in Figures 1 and 2. According to the trends shown in the graph (Figure 1), it is evident that the central zone stands better in terms of sustainable waste management owing to the high number of workers compared to the other zones. The other regions may need to invest more on workers who will see to improved waste management.
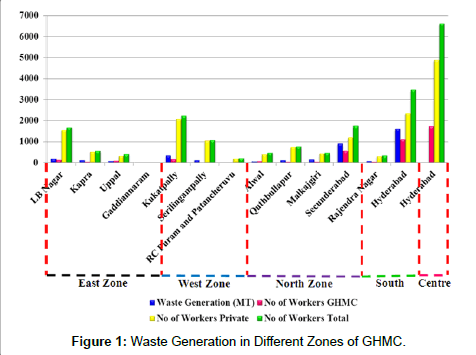
Figure 1: Waste Generation in Different Zones of GHMC.
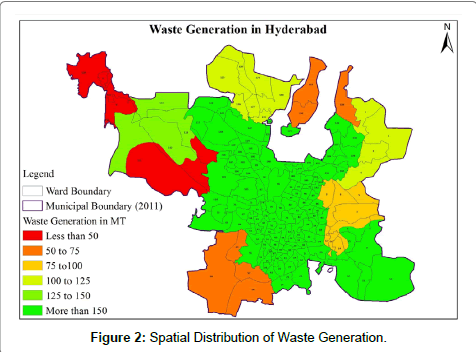
Figure 2: Spatial Distribution of Waste Generation.
| Area | Circle | Waste Generation (in metric tons) | No. of Workers | |||
| GHMC | Private | Total | ||||
| East | LB Nagar | 3 | 185 | 144 | 1535 | 1679 |
| Kapra | 1 | 124 | 52 | 515 | 567 | |
| Uppal | 2 | 78 | 98 | 318 | 416 | |
| Gaddiannaram | 27 | 0 | ||||
| West | Kukatpally | 14 | 335 | 177 | 2063 | 2240 |
| Serilingampally | 11, 12 | 128 | 26 | 1054 | 1080 | |
| RC Puram and Patancheruvu | 13 | 22 | 8 | 198 | 206 | |
| North | Alwal | 16 | 59 | 81 | 396 | 477 |
| Quthbullapur | 15 | 118 | 36 | 747 | 783 | |
| Malkajgiri | 17 | 152 | 42 | 432 | 474 | |
| Secunderabad | 18 | 900 | 564 | 1200 | 1764 | |
| South | Rajendra Nagar | 6 | 74 | 46 | 306 | 352 |
| Hyderabad | 4, 5 | 1600 | 1120 | 2347 | 3467 | |
| Central | Hyderabad | 7, 8, 9, 10 | 1724 | 4873 | 6597 | |
| Total | 3802 | 4118 | 15984 | 20102 | ||
Table 1: Waste Generation in Different Zones of GHMC.
Sources of waste: In order to properly manage the MSW being generated in Hyderabad, the sources and quantity of the waste have been identified and the details are shown in Table 2 and Figure 3.

Figure 3: Municipal Solid Waste Characteristics at Transfer Stations.
| S.No. | Source of Generation | MCH | Surrounding ULBs | ||
| Quantity /Day (in tons) | % | Quantity /Day (in tons) | % | ||
| 1 | Household – Domestic | 1482.00 | 66.18 | 690.45 | 60.60 |
| 2 | Street Sweepings and Drain Cleanings | 173.55 | 7.76 | 148.59 | 13.00 |
| 3 | Hotels and Restaurants | 77.50 | 3.46 | 36.91 | 3.20 |
| 4 | Markets | 92.00 | 4.10 | 60.74 | 5.30 |
| 5 | Shops / Commercial Establishments | 347.10 | 15.51 | 112.25 | 9.90 |
| 6 | Hospitals /clinics | 35.00 | 1.56 | 6.74 | 0.60 |
| 7 | Construction waste | 22.00 | 0.90 | 22.72 | 2.00 |
| 8 | Industrial Waste (Non-Hazardous) | 12.00 | 0.53 | 60.70 | 5.30 |
| Total | 2240 | 100.00 | 1139.00 | 100.00 | |
Table 2: Sources of Wastes in Hyderabad.
It is noticed that the source of wastes is mainly the domestic households (60 to 65%), both for the Hyderabad Municipal Corporation (HMC) and the Urban Local Boards (ULBs), which generates the MSW of 1482 and 690 tons per day. The next source of waste is streets and drains, followed by hotels and restaurants, markets, commercial establishments, industrial etc. Hospitals, clinics and construction sites are noticed as the least waste generation sources.
Waste disposal: At present, a total of 3063 tons per day (TPD) of municipal solid waste (MSW) is being collected, transported and disposed by the GHMC on a daily basis. The waste is being dumped at various disposable sites located mainly at Jawahar Nagar, Shamshiguda, the BHEL site near BDL and Fathullaguda. Jawahar Nagar site is the major dumping ground in Hyderabad which receives a total MSW of 2,618 tons/day from different transfer stations in the city. Apart from that Jawahar Nagar dumping yard also receives another 200 tons/day MSW from other 4 circles of the Hyderabad directly. In addition to that other dumping sites, such as, Shamshiguda, BHEL site and Fathullaguda disposable sites receive a volume of 100, 45 and 100 MSW tons/day, respectively. In the same vein, Annepu [10] noted that approximately 3000 tons of waste per day are generated in Hyderabad and transported to disposing sites by GHMC.
Physical and chemical characteristics of the MSW
The physical and chemical characteristics of the wastes are categorised and presented in Table 3 and Figure 4. The physical characteristics of wastes are categorized into bio-medical, biodegradable, recyclable and inert wastes, whereas, the chemical attributes are into pH, total moisture, fixed carbon, volatile matter and the calorific value. Transfer stations save on labor and operating costs and also reduce the number of vehicular trips to and from disposal sites [15].
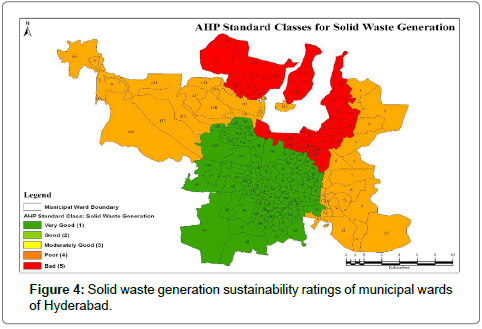
Figure 4: Solid waste generation sustainability ratings of municipal wards of Hyderabad.
| Type of Waste | At Transfer Station (%) | At Disposal Site (%) | |
| A | Physical Characteristics | ||
| 1 | Biodegradable | 46.07 | 50.36 |
| 2 | Recyclable | 40.66 | 36.77 |
| 3 | Inert/Reject | 12.74 | 12.26 |
| 4 | Bio Medical Waste | 0.53 | 0.61 |
| B | Chemical Characteristics | ||
| 1 | pH | 6.64 | 6.72 |
| 2 | Total Moisture | 46.10 | 45.56 |
| 3 | Fixed Carbon | 12.27 | 10.21 |
| 4 | Volatile Matter | 45.54 | 39.71 |
| 5 | Calorific value | 1720.90 | 1457.27 |
Table 3: Municipal Solid Waste Characteristics in Hyderabad.
Future trend: Based on the past trends, solid waste generation trends in Hyderabad are predicted till the year 2021 and shown in Table 4. As per the prediction it is estimated that the per capita solid waste generation trend in GHMC is likely to increase from 698.7 to 803 gm/ cap/day by the year 2021. This means a total of 3142 to 4177 tons/day.
| S.No. | Year | Per Capita Waste (gm/cap/day) | Waste Generated (tons/day) | ||
| MCH | Surrounding ULBs | MCH | Surrounding ULBs | ||
| 1 | 2001 | 607.4 | 517.9 | 2239.2 | 670.5 |
| 2 | 2006 | 651.4 | 556.1 | 2685.5 | 1259.7 |
| 3 | 2011 | 698.7 | 596.3 | 3142.4 | 1884.1 |
| 4 | 2016 | 749.4 | 657.7 | 3641.2 | 2475.1 |
| 5 | 2021 | 803.7 | 683.7 | 4176.8 | 3480.0 |
Table 4: Projected Waste Generation.
Sustainability of the municipal wards with respect to solid waste management
In order to identify, rate and categorize the municipal wards of the Hyderabad on the basis of their sustainability levels with respect to solid waste generation, an analysis is carried out using GIS. Total per capita waste generated by the ward was taken as the basis for rating and categorizing the wards into five different groups indicating their sustainability levels. The per capita waste generation categories of the wards are; < 0.20, 0.20 to 0.35, 0.35 to 0.50, 0.50 to 0.65 and > 0.65 (Table 5). The categories were used to create the groups which are as follows mentioned in Figure 4.
| Per Capita Waste Generation | Group |
| Less than 0.20 | Very Good |
| 0.20 to 0.35 | Good |
| 0.35 to 0.50 | Moderately Good |
| 0.50 to 0.65 | Poor |
| Greater than 0.65 | Bad |
Table 5: Per Capita Waste Generation Groups and Value range.
From the map generated through GIS analysis, it is found that a large percentage of the wards are rated poor in sustainable waste management. Some of these areas include Gachibowli, Patancheruvu and Hayathnagar. This implies that these areas have a per capita waste generation of 0.5 to 0.65. Some of the areas rated ‘bad’ in waste management include Suraram Colony, Alwal and Old Malkajgiri. It implies that these areas have a per capita waste generation which is greater than 0.65. This also means that the areas need remarkable improvement in terms of waste collection, disposal and infrastructure development. The areas rated ‘very good’ include Gunfoundry, I.S. Sadan, Kishanbagh, and Attapur. Much as these areas are rated ‘very good’, the status must be maintained and improved further for sustainable waste management. This finding is in line with the findings by Annepu [10] which indicate that most of the cities in India are poor in terms of solid waste management.
The issue of waste generation and management needs to be taken with weight due to the health hazard that wastes pose to human, animals and plants. In the city of Hyderabad, increase in population has in turn increased the quantities of wastes generated, a phenomenon that needs to be taken care of by increasing the number of workers and the systems of collection, transportation and disposal of the wastes. The main sources of waste are domestic households while least amount is produced at the hospitals, clinics and construction sites. Collected wastes are taken to transfer stations then to disposal sites such as in Jawahar Nagar, which is one of the largest sites. The future trends of waste generation are expected to rise just as the population trends are raising. Measures should be put in place for sustainable waste management (SWM). So far, SWM has been rated ‘very good’ in wards such as I.S. Sadan, Kishanbagh and Lalithabagh, while wards such as Defence Colony and Old Malkajgiri have been rated ‘bad’ due to the observed poor waste management.
For the future SWM it would be recommended that disposal sites be located at a reasonable distance from the collection areas in order to check the financial issues related to high transfer costs and additional investment in road infrastructure. Adequate waste disposal can be taken care of by compliance with guidelines for the siting, design and operation of especially the new landfills. Existing dump sites need to be upgraded through the establishment of sanitary landfills. There also needs well-trained sanitary personnel for waste management and the provision of adequate financial and physical support for a rational operational standard.