Journal of Geology & Geophysics
Open Access
ISSN: 2381-8719
ISSN: 2381-8719
Research Article - (2019)Volume 8, Issue 4
The research work epicenters on the delineation of Barite-Galena sediments within Iyamitet settlement of Obrubra region, Present work has become necessary owing to the growing need for the Nigeria and indeed world economy to be funded from proceeds of mineral ores as an alternative source of regional and global revenues. The ore garners some global economic value and importance. In delineating the region which habours the mineral ore, geo-electricity was introduced into the subsurface by employing a pair of current electrodes while the voltage is measured by inserting another pair of potential electrodes. Shlumberger array and Vertical Electrical Sounding (VES) techniques were adopted to measure apparent ground resistivity of the subsurface under investigation. Eighteen Vertical Electrical Sounding Curves, five geo-sections, five Isoresistivity and four Isopach maps were generated respectively. Since mineral-ores (Barite and Galena) are located within the host rocks, all 18 VES results represented in 18 tables show varied depths to these ores--and the rocks which harbours them.. The Iso-resistivity map with red patches bearing resistivities over 1000 Ωm demonstrates potential for Barite which coincide with varying depth of (10-15) m as revealed by the coring and borehole information. The Iso-pach map with the lightest patch represents highest altitude of the area under investigation. The dark blue patch represents the lowest portion of the region under investigation. Though results do not show the presence of Galena ore material, it is possible that multiple ore intrusions could have compromised the resistivity reading of Galena; Galena presence could be uncovered by combining outcome of results from multiple geophysical techniques
Barite; Galena; Isopach; Isoresistivity; Iyamitet
The importance of Barite and Galena, especially as vital natural resources for varied industries globally and locally, could not exceed emphasis. Barite is an important industrial mineral that is used extensively as a weighting agent in well-drilling fluids and in lesser amounts for filler, chemical, and ceramic applications. Barite (BaSO4) as identified by Brobst [1] is widely distributed in the United States with the greatest production, obtainable from Arkansas, Missouri, Nevada, and Georgia. Furthermore, nearly half of the States have yielded some barite or have potential resources. Additionally, since World War I, domestic production climbed steadily, reaching more than one million tons in 1956. More still, 90% of Barite is used in oil industry for drilling mud and 10% in chemical and other industries in many processes and products.
According to Oden [2] Benue trough is Nigeria’s main, but not exclusive source of barite mineralisation. Furthermore, there are at least ten barite fields in the trough, each containing swarms of veins or concordant stratiform minerals flats of hydrothermal origin. Additionally, there are only two vein trends in the trough: the NW-SE trend, which tends to be orthogonal to the axis of the trough; and the N-S to NNE-SSW trend, which is younger than the former. Both vein sets are formed from ac tension joints reflecting different postsedimentary deformation phases in the trough. The NW-SE veins are also more frequent than the N-S veins, almost in the ration of 2:1.
According to Geosciences News and Information of 2005- 2019, Galena (PbS) is the world's primary ore of lead from a large number of deposits in many countries. It is found in igneous and metamorphic rocks in medium to low temperature hydrothermal veins. Additionally, in sedimentary rocks it occurs as veins, breccia cements, isolated grains, and replacements of limestone and dolostone. In Lead-acid batteries, the lead from Galena is used to start automobiles. It is pertinent noting that Lead from Galena is one of the metals used in energy storage systems associated with power generation and hybrid vehicles.
Iyamitet is a village in the Obubra Local Government Area of Cross River State of Nigeria. Although not documented in literature, mining activities have been going on in the area for some time particularly by the artisan miners. Samples of Barite-galena assemblage hosted within quartz schist were observed in part of the studied locations. The price of Barite and Galena are on the increase despite the nation’s Barite–Galena ore deposits. This increase is attributable to the absence of established mining and processing plant that can serve as a feed to local mining industry. The humongous promise that mining presents has aggravated the search for ways to enhance mining of Barite and Galena ore in commercial quantity from within Iyamitet.
Research aim and objectives
The aim of this work is to employ Geo-electric Approach in Mineral Characterization of Iyamitet Settlement while the following objectives will be achieved: identification of possible veins and fractures favouring the accumulation of Barite–Galena and determining the depth to the mineralized zone which form the basis for mining activities.
Location of study area
Iyamitet is a settlement within Cross River State of South Southern Nigeria. It is located within N5.8660390, E8.32661390; N5.8660390, E8.3449370; N5.8522070, E8.3261390; N5.8522070, E8.3449370. A location map of Iyamitet with its appended; longitudinal and latitudinal locations are presented in Figure 1. This map is an integral map of Nigeria emergent from the south southern region.

Figure 1. Map of Iyamitet laden with Barite and Galena.
Past research works
DC resistivity role in mineral exploration cannot be overemphasized such that Geo-electrical and IP methods are well employed by Irawan et al. [3] and Moreira et al. [4] for 2-D Subsurface Imaging of Deep Ore Mineral Mapping and in Geophysical modeling in gold deposit respectively. Additionally, Kataka et al. [5] employed DC Resistivity method on sulphide deposit exploration in Musina area of South Africa.
Park et al. [6], Mostafaire and Ramazi [7] applied DC resistivity method in the survey of gold-bearing vein in Yongjang mine, Korea and in exploration of sodium sulfate deposit in Garmab, Iran, respectively. Akinde et al. [8,9] employed DC Resistivity and magnetic methods, in the investigation of Mylonite across Ifewara settlement of southwestern Nigeria for Neo-Tectonic overprint’s identification. This present research work tends to delineate two minerals which consist of Barite and galena within the study area. It will also reveal the depth to the ore-body of the minerals deposit.
Electrode configuration
Electrical resistivity survey has over the years being used for measuring the true resistivity of the subsurface. Ground apparent resistivity is related to various geological parameters such as mineral and fluid content, porosity and degree of water saturation present in rock.
Resistivity-related investigations are conducted by passing current into the subsurface by employing a pair of current electrodes, while the ground or subsurface potentials are measured by employing another pair of potential electrodes. The common electrode array used in resistivity survey includes:
• Wenner array
• Schlumberger array
• Pole – Dipole
• Dipole – dipole
• Gradient array
• Lee – partion array
• Cross square array
The adopted array is represented by the simple set up in Figure 2.

Figure 2. An adopted set up for Schlumberger array from Dikedi et al. [9].
The Geometric or G-Factor of Schlumberger Array is represented in equation (1)
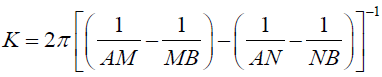 (1)
(1)
Equation (1) is expanded to give the relationship in equation (2)
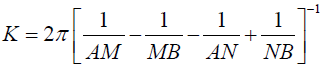 (2)
(2)
Substituting AM, MN and NB with a,b and a as indicated in Figure 1, leads to equation (3)
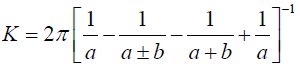 (3)
(3)
Equation (3) is further simplified to give equation (4)
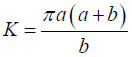 (4)
(4)
Finally, by multiplying, K, by measured ground resistance, R, leads to a relationship explaining apparent resistivity
 (5)
(5)
VES curves can be interpreted qualitatively using simple curve shapes, semi-quantitatively with graphical model curves or quantitatively with computer modeling. Often a noisy field curve is smoothened to produce a graph that is easy to model. Near-surface layers tend to be modeled more accurately than those at depth because field data from shorter electrode separations tend to be more reliable than those for very large separation, owing to higher signal–to–noise ratios.
The results of VES data for the study area are plotted and interpreted. A typical graphical plot of VES revealed that the curves are predominantly made up of five layers of HKH (ρ1>ρ2<ρ3>ρ4< ρ5) where ρ1,ρ2,ρ3,ρ4 and ρ5 are apparent ground resistivity of the first, second, third, fourth and fifth layer respectively. These VES curves are presented in Figures 3-7. Table of VES 1 to VES 18 interpreted data are presented in Tables 1 to 18.

Figure 3. (a-d) VES 1 to VES 4 Model curves are presented.

Figure 4. (a-d) VES 5 to VES 10 Model curves are presented.

Figure 5. (a-d) VES 11 to VES 12 Model curves are presented.

Figure 6. (a-d) VES 13 to VES 16 Model curves are presented.

Figure 7. (a-b) VES 17 to VES 18 Model curves are presented.
| S/N | Resistivity Ω-m | Thickness (m) | Depth (m) | Lithological equivalence |
|---|---|---|---|---|
| 1 | 144.9 | 1.7 | 1.7 | Lateritic topsoil |
| 2 | 45.2 | 11.2 | 12.9 | Laterite |
| 3 | 205.3 | 44.7 | 57.6 | Fractured basement |
| 4 | 159.4 | 19.2 | 76.8 | Fractured basement |
| 5 | 231.4 | - | - | Fresh basement |
Table 1: Traverse 1, VES 1 interpreted result.
| S/N | Resistivity Ω--m | Thickness (m) | Depth (m) | Lithological equivalence |
|---|---|---|---|---|
| 1 | 232.2 | 2.7 | 2.7 | Lateritic topsoil |
| 2 | 14.6 | 5.9 | 8.6 | Laterite |
| 3 | 1920.2 | 44.2 | 52.8 | Fractured basement |
| 4 | 662.4 | 27.4 | 80.2 | Fractured basement |
| 5 | 775.9 | - | - | Fresh basement |
Table 2: VES 2 interpreted result.
| S/N | Resistivity Ω--m | Thickness (m) | Depth (m) | Lithological equivalence |
|---|---|---|---|---|
| 1 | 197.6 | 1.9 | 1.9 | Lateritic topsoil |
| 2 | 26.6 | 11.8 | 13.7 | Laterite |
| 3 | 716.6 | 60.1 | 73.8 | Fractured basement |
| 4 | 192.7 | 19.4 | 93.2 | Fractured basement |
| 5 | 249.2 | - | - | Fresh basement |
Table 3: VES 3 interpreted result.
| S/N | Resistivity Ω--m | Thickness (m) | Depth (m) | Lithological equivalence |
|---|---|---|---|---|
| 1 | 27.1 | 0.9 | 0.9 | Lateritic topsoil |
| 2 | 12.8 | 4.3 | 5.2 | Laterite |
| 3 | 445.6 | 35 | 40.2 | Partially Fractured basement |
| 4 | 221.3 | 37.9 | 78.1 | Fractured basement |
| 5 | 244.5 | - | - | Fresh basement |
Table 4: Traverse 2, VES 4 interpreted result.
| S/N | Resistivity Ω-m | Thickness (m) | Depth (m) | Lithological equivalence |
|---|---|---|---|---|
| 1 | 145.9 | 1 | 1 | Lateritic topsoil |
| 2 | 142.4 | 4.6 | 5.6 | Laterite |
| 3 | 388.2 | 51.9 | 57.5 | Fractured basement |
| 4 | 643.1 | 51.5 | 109 | Fractured basement |
| 5 | 751.1 | - | - | Fresh basement |
Table 5: VES 5 interpreted result.
| S/N | Resistivity Ω-m | Thickness (m) | Depth (m) | Lithological equivalence |
|---|---|---|---|---|
| 1 | 18.5 | 0.5 | 0.5 | Lateritic topsoil |
| 2 | 198.2 | 1.9 | 2.4 | Laterite |
| 3 | 30.3 | 6.3 | 8.7 | Saprolite |
| 4 | 445.1 | 63.9 | 72.5 | Fractured basement |
| 5 | 324.1 | - | - | Fresh basement |
Table 6: VES 6 interpreted result.
| S/N | Resistivity Ω-m | Thickness (m) | Depth (m) | Lithological equivalence |
|---|---|---|---|---|
| 1 | 384.3 | 2.6 | 2.6 | Lateritic topsoil |
| 2 | 95.3 | 5.8 | 8.4 | Laterite |
| 3 | 1225.2 | 35.2 | 43.6 | Fractured basement |
| 4 | 754.7 | 29.5 | 73.1 | Fractured basement |
| 5 | 831.9 | - | - | Fresh basement |
Table 7: Traverse 3, VES 7 interpreted result.
| S/N | Resistivity Ω-m | Thickness (m) | Depth (m) | Lithological equivalence |
|---|---|---|---|---|
| 1 | 631.2 | 1.1 | 1.1 | Lateritic topsoil |
| 2 | 112.5 | 6.4 | 7.5 | Laterite |
| 3 | 434.1 | 21.4 | 28.9 | Saprolite |
| 4 | 218 | 40 | 68.9 | Fractured basement |
| 5 | 313.1 | - | - | Fresh basement |
Table 8: VES 8 interpreted result.
| S/N | Resistivity Ω-m | Thickness (m) | Depth (m) | Lithological equivalence |
|---|---|---|---|---|
| 1 | 659.3 | 1.3 | 1.3 | Lateritic topsoil |
| 2 | 24.2 | 11 | 12.3 | Laterite |
| 3 | 892.7 | 49.3 | 61.6 | Fractured basement |
| 4 | 251.3 | 29.8 | 91.5 | Fractured basement |
| 5 | 243.7 | - | - | Fresh basement |
Table 9: VES 9 interpreted result.
| S/N | Resistivity Ω-m | Thickness (m) | Depth (m) | Lithological equivalence |
|---|---|---|---|---|
| 1 | 141.3 | 0.6 | 0.6 | Lateritic topsoil |
| 2 | 23.8 | 3.9 | 4.4 | Laterite |
| 3 | 650 | 42.3 | 46.7 | Partially Fractured basement |
| 4 | 382.3 | 29.5 | 76.2 | Fractured basement |
| 5 | 419.9 | - | - | Fresh basement |
Table 10: Traverse 4, VES 10 interpreted result.
| S/N | Resistivity Ω-m | Thickness (m) | Depth (m) | Lithological equivalence |
|---|---|---|---|---|
| 1 | 93.3 | 0..6 | 0.6 | Lateritic topsoil/Boulder fillings |
| 2 | 191.2 | 3.7 | 4.3 | Laterite |
| 3 | 56.8 | 8.9 | 13.2 | Saprolite |
| 4 | 1603 | 73 | 86.2 | Fractured basement |
| 5 | 588.3 | - | - | Fresh basement |
Table 11: VES 11 interpreted result.
| S/N | Resistivity Ω -m | Thickness (m) | Depth (m) | Lithological equivalence |
|---|---|---|---|---|
| 1 | 201.6 | 1.4 | 1.4 | Lateritic topsoil |
| 2 | 22.5 | 7.9 | 9.3 | Laterite |
| 3 | 150.4 | 38.2 | 47.5 | Fractured basement |
| 4 | 101.7 | 29.9 | 77.4 | Fractured basement |
| 5 | 106.6 | - | - | Fresh basement |
Table 12: VES 12 interpreted result.
| S/N | Resistivity Ω-m | Thickness (m) | Depth (m) | Lithological equivalence |
|---|---|---|---|---|
| 1 | 43.6.3 | 0.7 | 0.7 | Lateritic topsoil |
| 2 | 48.6 | 10.3 | 11 | Laterite |
| 3 | 849.4 | 48.8 | 59.7 | Fractured basement |
| 4 | 360.7 | 28.4 | 88.2 | Fractured basement |
| 5 | 450.4 | - | - | Fresh basement |
Table 13: Traverse 5, VES 13 interpreted result.
| S/N | Resistivity Ω-m | Thickness (m) | Depth (m) | Lithological equivalence |
|---|---|---|---|---|
| 1 | 86.6 | 1.4 | 1.4 | Lateritic topsoil |
| 2 | 402.2 | 5.7 | 7.1 | Laterite |
| 3 | 78.2 | 13.9 | 21 | Saprolite |
| 4 | 1045.9 | 38.2 | 59.2 | Fractured basement |
| 5 | 1026.6 | - | - | Fresh basement |
Table 14: VES 14 interpreted result.
| S/N | Resistivity Ω-m | Thickness (m) | Depth (m) | Lithological equivalence |
|---|---|---|---|---|
| 1 | 38.6 | 1.3 | 1.3 | Lateritic topsoil |
| 2 | 59.7 | 7.6 | 8.9 | Laterite |
| 3 | 327.3 | 23.3 | 32.4 | Saprolite |
| 4 | 291.7 | 34.4 | 66.7 | Fractured basement |
| 5 | 296.1 | - | - | Fractured basement |
Table 15: VES 15 interpreted result.
| S/N | Resistivity Ω-m | Thickness (m) | Depth (m) | Lithological equivalence |
|---|---|---|---|---|
| 1 | 32 | 2.5 | 2.5 | Lateritic topsoil |
| 2 | 119.7 | 7.5 | 10 | Laterite |
| 3 | 703.7 | 31.7 | 41.7 | Saprolite |
| 4 | 577.6 | 27.7 | 69.4 | Fractured basement |
| 5 | 725.2 | - | - | Fractured basement |
Table 16: Traverse 6, VES 16 interpreted result.
| S/N | Resistivity Ω -m | Thickness (m) | Depth (m) | Lithological equivalence |
|---|---|---|---|---|
| 1 | 67.7 | 0.7 | 0.7 | Lateritic topsoil |
| 2 | 132.8 | 2.8 | 3.5 | Laterite |
| 3 | 24.7 | 9.5 | 13 | Saprolite |
| 4 | 360.2 | 93.3 | 106.3 | Fractured basement |
| 5 | 188.9 | - | - | Fresh basement |
Table 17: VES 17 interpreted result.
| S/N | Resistivity Ω-m | Thickness (m) | Depth (m) | Lithological equivalence |
|---|---|---|---|---|
| 1 | 197.7 | 1 | 1 | Lateritic topsoil |
| 2 | 110.5 | 7.3 | 8.3 | Laterite |
| 3 | 1158.7 | 42.1 | 50.4 | Fractured basement |
| 4 | 782.8 | 29.9 | 80.2 | Fractured basement |
| 5 | 796.8 | - | - | Fresh basement |
Table 18: VES 18 interpreted result.
Two dimensional geoelectric sections are developed for six traverses and are presented as Figures 8; they reveal five layers. The first layer is represented by lateritic top soil and has resistivity range of 18.5 to 659.3 Ωm and thickness range of 0.5 to 2.7 m, having relatively higher thickness at VES 2. The second layer is represented as laterite layer with resistivity range of 12.8 to 402.2 Ωm and a thickness range of 2.8 to 13.3 m, the thickness is high at VES 11. The third layer has ground apparent resistivity range of 24.7 to 1920.2 Ωm and a thickness range of 6.3 to 60.1 m. The fourth layer is presented with resistivity range of 107.5 to 1045.9 Ωm and a thickness range of 19.2 to 93.3 m. The fifth layer is presented with resistivity range of 101.2 to 1026.6 Ωm and the thickness is to infinity.

Figure 8a. Showing geoelectric section traverse 1.

Figure 8b. Showing geoelectric section traverse 2.

Figure 8c. Showing geoelectric section traverse 3.

Figure 8d. Showing geoelectric section traverse 4.

Figure 8e. Showing geoelectric section traverses 5.

Figure 8f. Showing geoelectric section traverse 6.
The result of the Iso-resistivity map is presented as Figure 9. The central part of the map is characterized by resistivity value less than 240 Ωm and corresponds to the area occupied by the Baritegalena. The eastern part and some portion of the western part of the map is characterized by resistivity value greater than 15 Ωm and these regions correspond to the area occupied by banded gneisses. The high resistivity values on the map, trending NW-SE at the southeastern part of the map is indicative of intrusion in the area.

Figure 9. (a-e) Showing Isoresistivity map for layer 5.
An Isopach map of the region under investigation is developed and presented in Figure 10. This map captures the thickness of the overburden (depth to ore-body). The shallowest part of the overburden is located about the central portion of the investigated region while the deepest part lies at the southeastern and northern part of the study area.

Figure 10. (a-d) Isopach maps of the area under investigation.
The outcome of the research work display depths to ore bodies and overburden thicknesses. There are potentials for Barite in traverse 1 for VES 2 within the third layer and traverse 4 for VES 11 within the fourth layer, respectively primarily within the fractured basement layers. Saprolite constituents are harbouring barite within VES 6, 8,11,14, 15,16, and 17 along traverses 2,3,4 and 6. Though results do not show the presence of Galena ore materials, it is possible that multiple ore intrusions could have compromised the resistivity reading on Galena; Galena presence could be uncovered by combining outcome of results from multiple geophysical techniques. These possible intrusions are manifested by the uneven spread in the lithology shown in each of the geo sections. Additionally, in the course of the investigation, the resistivity meter used could have captured only the resistivity of gangue mineral constituents impregnated within Galena deposit.
VES 7 along traverse 3 shows robust hydrological promises Conversely, VES 11 and 14 along traverses 4 and 5 respectively shows the least hydrological promise. Other VES points show fair appreciable potential for groundwater. VES 1 to 3 under traverse 1, VES 5 along traverse 2 with VES 9 along traverse 3 show resistivity contrast that could be attributed to barite-galena deposit. VES 10 to 11 along traverse 4, VES 13 along traverse 5 and VES 17 to 18 along traverse 6 are fractured subsurface rock sections harboured some remnant devoid of mineral deposit within the 3rd and 4th layer. The fractured basement is underlain by fresh basement.
The Iso-resistivity map with red patches bearing resistivities over 1000 Ωm demonstrates potential for Barite. The Iso-pach map with the lightest patch represents highest altitude of the area under investigation. The dark blue patch represents the lowest portion of the region under investigation.
Citation: Akinde AS, Dikedi PN, Ogharandukun MO (2019) Adopting Geo-electric Approach in Mineral Characterization of Iyamitet Settlement, J Geol Geophys 8:466. doi: 10.35248/2381-8719.19.8.466
Received: 12-Sep-2019 Accepted: 21-Oct-2019 Published: 28-Oct-2019
Copyright: © 2019 Akinde AS, et al. This is an open-access article distributed under the terms of the Creative Commons Attribution License, which permits unrestricted use, distribution, and reproduction in any medium, provided the original author and source are credited.