Journal of Geology & Geophysics
Open Access
ISSN: 2381-8719
ISSN: 2381-8719
Research Article - (2017) Volume 6, Issue 4
Formation fractures have significance effect on the permeability of rocks in oil and gas reservoirs. In real conditions, the opening of vertical fractures exceeds the opening of horizontal fractures and the permeability of reservoirs in conditions of horizontal wells is higher than in vertical conditions. In the sonic log longitudinal waves, unlike the transverse waves, the attenuation rate strongly depends on the wave path direction. It is shown that the mechanism of the attenuation of sound waves in porous rocks is represented by the scattering of "soft" microheterogeneous inclusions. For reservoir rocks with porosity (φ) of (10-20)%, the attenuation decrement is several times higher than the decrement of the other mechanisms.
Keywords: Porosity; Fractures; Pores; Acoustic logging; Attenuation decrement; Permeability; Longitudinal waves; Transvers waves
The fractures and pores of rocks, in many ways, determine the hydrocarbon content in oil and gas fields. However, measuring the porosity and permeability of reservoir rocks, using geophysical methods is a difficult task. In the solution of the permeability problem, a significant progress has now been made in connection with the invention of the method based on monitoring the penetration of drilling mud into the near-wellbore space [1,2].
The effectiveness of this method depends on a full package of the information about the geometry and openings degree of the fractures in reservoir rocks. These openings play the role of channels in the process of fluid flow. In fact, the main interest here is those fractures that are oriented in a direction orthogonal to the borehole axis. An extensive geological and geophysical literature is devoted to the study of fractures in reservoir rocks [3,4].
However, unfortunately, there are very few publications devoted to the method of studying the direction of the surface of fractures and the degree of their unfolding. Therefore, in dealing with this problem, one can use only the most general provisions of geology and mechanics:
Fractures at the stage of their initial formation, under the action of tectonic processes, have a complex form and, more often, an arbitrary spatial orientation of the surface.
In the further evolution of rocks, the characteristics of the openings of rock fractures become dependent on their direction relative to the compressive pressure (usually vertical). Due to the fact that vertical compression is stronger than horizontal compression, there is a greater "collapse" of horizontal fractures, which leads to their predominance over vertical ones. Therefore, in terms of higher oil recovery, horizontal wells have advantages over vertical ones, since the fractures surrounding them are orthogonal to the well axis.
Physical model to study of the effect of structures with directional fractures on the field of seismic waves
The model represents a visual representation of the possibilities of acoustic methods for revealing geological structures that cut by a system of parallel fractures. The physical modelling is performed on sheet models [5]. In these models the enclosing medium was imitated by a thin aluminium sheet and the fractures in crosscuts of this sheet.
During the experiment, the probing base rotated relative to the normal to the direction of fractures in a circle from angle ϴ = - π / 2 (coinciding with the direction of fractures) to the angle ϴ = π / 2 (to the opposite direction of the fractures). The wave fields of the longitudinal and transverse waves are shown in (Figure 1). The first path on the left corresponds to the standard (solid) object in which fractures are absent. A comparison with the standard object allows us to visually see the influence of fractures. This influence in particular includes the reduction in the waves speed due to;

Figure 1: Seismograms of translucence model containing mutually parallel fractures, for longitudinal (A) and transverse waves (B).
• Signal delay and an increase in the attenuation.
• Reduction of amplitude and increase of the visible period (decrease in frequency band) of the probe pulse.
The influence of fractures on the propagation mode of longitudinal waves is quite expected. When the beam (ray) is directed orthogonally to the surface of the fractures, the velocity of the waves becomes minimal, and the attenuation is maximal. As for the effect of the fractures on the propagation mode of transverse waves, the result of the experiment here is unexpected. In the case of transverse waves, the change in the direction of probing with respect to the direction of the fractures practically does not affect either the propagation velocity or the attenuation of the probing waves. Therefore, the presence of directional fractures in the probed medium actually can only be determined by longitudinal waves.
Study of fractures and pores of a probed medium by standard acoustic logging
It is typical, for the industrial practice, that the design of the sonic logging tool contains a magnetostrictive source located at some distance from two geophones (piezoelectric receiver of sound signals) [6].
The distance between the source and the nearest geophone is most often selected in L1(1-2 m). The distance between the near and far geophones is L2(0.4 m).
In the industrial environments, the acoustic parameters of the probed medium are usually determined on the basis of the spatial interval of L2. The speed of sound, typically measured in the simplest way: as the ratio of the L2 to the interval time of wave propagation (t2 - t1):
V=L2 / (t2-t1) (1)
where:
V=the speed of sound, m/s.
Decrement of attenuation caused more often by the decreasing of the wave amplitude than by increasing of the visible period. Since the observation base L2 used in the probes has a relatively small length, the measurement accuracy both of the propagation velocity of the wave V and attenuation decrement Q-1 are limited. L2 is designed to be relatively small to improve the spatial resolution in the study of thinlayered geo-acoustic environment.
We attempted to develop a measurement technique with improved accuracy both for the seismic velocity and the decrement of the attenuation of the probed geo-acoustic medium. This technique is based on the use of information about the total length of the wave trajectory (from the source to the far geophone L=L1+L2). The essence of this technique is to analyse the changes in the signal of the far geophone when the probe moves in the borehole.
Another way was also successfully tested to implement the maximum length of the probe; it does not require design changes. This way is based on the use of the change in the spectral ratios (and hence the shape) of the broadband probing signal, which take place in the absorbing and scattering media. In fact, the greater attenuation of high-frequency spectral component as compared to low-frequency components reduces the central frequency of the spectrum fc. A consequence of this is the elongation of the "visible" (apparent) period of the pulsed probing signal Tv = 1 / fc. Using this effect, leads to the following formula:
where:
f - The width of the frequency band of the probing signal, mm.
ΔTL,V-The increment of the "visible" period that occurs when the wave propagates in the time interval tL, μ sec.
The relative value of the frequency spectrum of the signal represents the sensitivity of this method.
Method for studying fractures of probed geo-acoustic environment based on the analysis of measured velocity parameters
Among the possible physical criteria that can be used to obtain information about the existence of directed fractures in rocks, is the anomalous value of Poisson's ratio KPoiss. In fact, in this model, the plate environment represents actually a mechanical equivalent of a continuous solid body dissected by a system of parallel fractures. The value of KPoiss in a direction orthogonal to the surface of the fractures should be minimal, and in the direction of the surface of the fractures, the maximum. In the acoustic logging method, the Poisson ratio can be determined according to the measurement of the ratio of the sound velocities of the transverse Vs and the longitudinal Vp waves [7]:
where:
KPoiss-Poission ratio, unitless.
Vs -Formation transverse velocity, m/sec.
Vp -Formation longitudinal velocity, m/sec.
Since the minimum value of KPoiss occurs at the maximum of the ratio Vs / Vp , then it is the determination of the Vs / Vp ratio from the log analysis of seismic wave velocities that carries information about the Poisson's ratio.
Unfortunately, the value of KPoiss depends not only on the presence of fractures, but also on the material composition of the probed medium. Actually, if the average value of the Poisson ratio of rocks is KPoiss ~ 0.33 (which corresponds to the ratio Vs / Vp =0.5), then in viscous "water-like" rocks of clay type the value of the Poisson's ratio is much higher. While in brittle "plug-like" rocks such as limestone and sandstone, on the contrary, KPoiss is lower [7]. Therefore, the range of variation of Poisson's ratio, due to the change in the real composition of the probed medium, is an obstacle in the study of the fractures by the method of analysing the Poisson's ratio. The magnitude of this range is quite significant. For example, for oil well, the range of variation in KPoiss along the depth of the well is approximately 20%, while the effect of fractures on the KPoiss value is significantly smaller. Therefore, when analysing the presence of fractures, it is correct to take into account not the absolute value of the KPoiss, but either its deviation from the average value for a given rock type or its dependence on the direction of probing. If neither of these options are possible, then we must use other methods to study the formation fractures and, first of all, by analysing the attenuation of the probing waves.
Method for studying the fractures of the probed geo-acoustic medium based on an analysis of information about measured attenuation parameters
A study of the influence of micro heterogeneous inclusions on the characteristics of a geo-acoustic medium, carried out by means of physical modelling. It has showed that among the parameters of velocity and Q factor, the Q factor has a higher sensitivity to the influence of micro-heterogeneous inclusions. Thus, in the case of studying the porosity coefficient [5], it was established that when using the attenuation decrement as the output measuring value, the sensitivity with respect to the change in the porosity coefficient is Q times higher than with respect to the change in one of the velocity parameters. When working with high-quality rocks, such as most the reservoir rocks, this means a very significant advantage of the "attenuation method" for one to two orders of magnitude.
The qualitative aspect of the influence of directional fractures on attenuation of seismic waves is shown on seismograms (Figure 1). An increase in the decrement leads to a drop in the amplitude and an increase in the visible period (a decrease in the upper boundary of the frequency range) of the probing signal for longitudinal waves. As can be seen, the minimum attenuation occurs when the medium is probed along the fractures (ϴ → 0). When ϴ>0, the magnitude of the attenuation increases, reaching its maximum when ϴ → π / 2, i.e., with the direction of the probing beam orthogonal to the direction of the fractures, and hence orthogonal to the well axis.
Method for determining the rocks attenuation parameters by the ratio of the amplitudes of the longitudinal and transverse waves
A method for processing acoustic log data was developed based on the use of the ratio of the amplitudes of the longitudinal and transverse waves of the probing signals Up/Us [8]. Unfortunately, the authors do not give a physical explanation for the work of their proposed method. In our opinion, the dependence of the ratio Up/Us should be sought in the differences of attenuation decrements between the longitudinal and transverse waves. Since the measurement of the amplitudes of the probing signal waves is a simple technological procedure, it is logical to apply this method to evaluate the fractures of the probed rocks.
We use the expressions for the amplitudes of the probing signal of acoustic logging in the following form:

where:
Up (0) , Us (0) , Up (L) , Us (L) -The amplitudes of the longitudinal and transverse waves at the distances L=0 and L respectively, μ sec/m.
Qp-1 and Qs-1-The decrements in the attenuation of longitudinal and transverse waves. λp and λs. The lengths of the longitudinal and transverse waves, mm.
and transverse waves. λp and λs. The lengths of the longitudinal and transverse waves, mm.
Kp-s-The conversion coefficient of the longitudinal wave to the transverse wave.
Kd-The divergence coefficient.
Based on equation 4 and equation 5 we obtain:
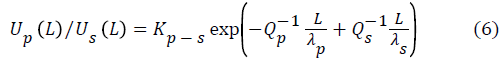
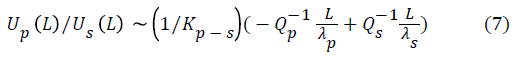
Representing an approximately exponential function in the form of a power series, we get:
In the presence of fractures having a direction orthogonal to the direction of the probing wave, the attenuation decrement of the longitudinal wave exceeds the decrement of the transverse wave, Qp-1 > Qs-1. Furthermore, the length of the transverse wave is usually twice as long as the longitudinal wave. Therefore, in the case under consideration, with an acceptable approximation, we can put
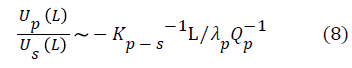
Thus, the ratio of Up(L) /Us(L) is proportional to the decrement of attenuation of longitudinal waves and hence can be used as a measure of formation fracturing. Note that the amplitude of the probing signal is a parameter easy to measure, minimally susceptible to errors and failures.
The field of waves shown in (Figure 1) refers to structures that are cut by gas-filled fractures. However, by simple logical reasoning, they can be extended to structures in which the filler of the fractures is a liquid (oil or water). Actually, taking into account, that the replacement of gas with liquid has very little effect on the field of transverse waves, since the wave impedance inside the fractured medium (Z=ρ V) remains close to zero. This is because the velocity of the transverse waves (Vs ) in the liquid is also zero, as in the gas. In contrast to this, for longitudinal waves, the acoustic wave impedance (Z) inside the fractured medium, when the gas is replaced by a liquid significantly increases. This will significantly reduce the anomalous effects for both velocity and attenuation.
Attenuation mechanism of seismic waves in porous rocks based on the principle of dispersion (Reemission of seismic waves by inertial forces arising on micro-heterogeneous inclusions of reduced density)
From the two possible anomalous effects of rocks (seismic velocity and attenuation), the geophysics in their exploration more often uses seismic velocity. The parameter of attenuation has received much less attention. Using means of the ultrasonic seismic modelling previously performed a series of experimental works showed that the attenuation decrement has a significantly higher sensitivity to porosity parameter than the parameter of seismic velocity. However, the results of these experiments could not be linked to the results of the theoretical analysis at that time. The fact is that in classical works on acoustics, the central place is occupied by works on the study of the propagation regularities of the waves in gases and liquids. In General works such as encyclopaedic monographs [8], reviews results related to the study of the attenuation regularities of the sound waves is limited to the medium objects. These objects are the liquid containing medium and micro-heterogeneities of the inclusions of very small sizes. The final conclusions in this work cannot be used in analysing the propagation of waves in rocks. For example, a widely known popular acoustics, the conclusion about the transparency of the small obstacles to the probing sound waves can only mislead geophysicists.
The theoretical analysis, in the recent geophysical work [8-11], was carried out using significant simplifications and approximations that qualitatively modify the real physics of propagation of sound waves in rocks. For example, In order to realize an approximate solution of the equation of fluid flow, the micro-heterogeneous inclusions are considered in form of ellipsoids. While this simplification is unacceptable for most interest objects to practical oil and gas geophysics [12].
Experiments of physical modelling have shown that the mechanism of viscous friction plays a secondary role in the attenuation of seismic waves in highly porous rocks. This is confirmed by the fact that the replacement of low viscous water inside fractures and pores with high viscous oil has little effect on the attenuation. Furthermore the replacement of any liquid with a gas has a very low viscosity, leading even to an increase, rather than decrease the attenuation.
An analysis of the experimental facts leads to the conclusion that the main reason for the significant attenuation of seismic waves in porous and fractured rocks is the effect of their dispersion. This is due to the appearance of a force field on the "soft" (with respect to the surrounding medium) micro-heterogeneous inclusions, randomly located inside the oil and gas reservoir.
To show this, consider a wave field that occurs when a porous geoacoustic medium is probed with a plane harmonic sound wave. This wave has an oscillatory velocity 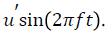 This wave corresponds to the acceleration
  and the pressure
 where Vₒ and ρ are seismic velocity and density of the medium [7]. The dependence of pressure on the vibrational velocity is called the acoustic Ohm's law.As a result of the acceleration action (u´´), some of the i-th element of this medium, has volume Vi and respectively the mass of mi=ρiVi, acts on the host medium with the force
 . According to the condition of chaotic distribution of micro-heterogeneous inclusions in a medium, and hence, secondary forcs sources, the latter are independent. Each force source emits oscillatory displacement
  which physically means the selection of energy from the initial probing wave [13]. This means the appearance of attenuation, the decrement magnitude of which can be estimated as follows. The decrease in the amplitude of the wave
  over a small spatial interval Δl is determined as a consequence of the pressure drop d(p(dl)) based on the acoustic Ohm's law and at the value of the wave resistance
  (9)
(9)
Where;
Vo - Seismic formation velocity, m/sec.
ρ - Formation density, gm/cc.
u´ - Waves acceleration, m/sec2.
Δl - Waves space interval, mm.
The value of the pressure drop  is the result of the action, over the spatial interval Δl, of the sum of elementary sources of forces
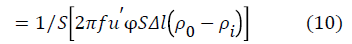
where;
N (S , Δl )-The number of elementary force sources Fi in the volume of the propagation space of the Sdl.
φ - The coefficient of porosity, %.
(ρo -ρi)-The difference between the density of the enclosing rock ρo and the density of the interstitial fluid ρi, gm/cc.
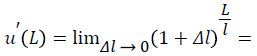
Further, passing from a small spatial interval dl to an interval of finite length L, we obtain:

Taking into account that for small arguments of the function x, we have exp x ~ (1+x), and consequently, (1+x)N ~ Nx. Also taking into account the ratio of f/u´=1/λ (where λ is the wave length, mm), then we get:
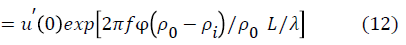
In acoustics, the traditional expression for the attenuation of a sound wave is the relation;
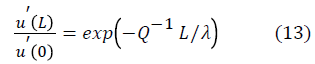
where Q-1: The attenuation decrement, dB (decibels) per unit length
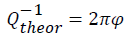
Comparison of this relation with Equation 12 shows their compliance with the value of the decrement equal to
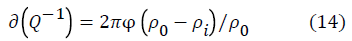
Thus, the attenuation decrement of the porous rocks is equal to the product of the coefficient of porosity multiplied by the difference in the relative density of interstitial fluid. Let us pay attention to the fact that neither the dimensions, nor, the more so, the shape of the microheterogeneous inclusions, do not affect the magnitude of the decrement. The influencing factor is only the cumulative volume of micro-heterogeneous inclusions, which represents the porosity of the probed geo-acoustic medium.
In real rocks, the relative density of the interstitial fluid varies in relatively narrow limits-from ρi ~ 0 (gas) to ρo ~ 1 g/cc (water). Therefore, the maximum relative change (ρo – ρi) / ρo in the attenuation value Q-1 are not more than 30%. This makes it difficult to diagnose the material composition of the interstitial fluid according to the parameter Q-1. Here, electromagnetic methods have advantages over acoustic ones. As follows from Equation 10 and for the possibility of diagnosing the porosity coefficient, the attenuation effect is a very convenient factor for the porosity determination.
We did not take into account the attenuation value that takes place in a "continuous" (devoid of pores) geo-acoustic medium, assuming that Q-1 (φ → 0) → 0. In the oil and gas geophysics this assumption is close to the truth, since the attenuation decrement of consolidated rocks usually does not exceed several hundredths Q-1 (φ ~ 0)<0.05. It should also be noted that it is possible to introduce an amendment to the attenuation of waves in a continuous medium. The amendment uses a statistical relationship between the decrement and the seismic velocity of rocks. The latter can be approximated by an empirical relation [14]
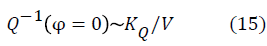
Where V is the velocity of sound (m/sec) and KQ is an empirical coefficient.
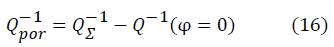
Since the value of the seismic velocity V is usually well known, it is possible to consider the initial value of the decrement Q-1 (φ =0). This consideration allows us to clarify the part of decrement, which is introduced by the porosity of the medium into its total value 
With the purpose of studying the regularities that determine the effect of the rock porosity on the attenuation of seismic waves, a series of laboratory experiments by means of physical (ultrasonic) modelling was carried out earlier [5]. To this end, a group of physical models containing micro-heterogeneous inclusions (pores) that filled with either gas or liquid (oil or water) has been developed. The experiments were carried out with two-dimensional (sheet) and three dimensional (volumetric) models. Two-dimensional models were built on the basis of thin sheet of aluminium. Such models were equivalent to twodimensional (cylindrical) of the enclosing environment. Microheterogeneous gas-filled inclusions were imitated by perforations in the body of the sheet.
The main type of three-dimensional (volumetric) models was built based on the principle of a mixture of foam plastic granules and epoxy resin. Such models correspond to rocks that are containing gas-filled pores. When the size of the foam plastic granules is of the order of 1 to 4 mm and the wavelength of the probing signal is 5 to 50 mm, small size condition for micro-heterogeneous inclusions is achieved. This condition, with respect to the wavelength of the probing signal, always occurs in situ seismic sensing. The coefficient of porosity of such a medium is equal to the volume of foam granules with respect to the volume of epoxy resin.
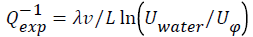
The models were prepared in the form of rectangular blocks having dimensions 250 × 250 × 28 mm3 . Foam inclusions were granules of the size 1 × 1 × 1.5 mm3 . Four blocks were prepared in which the porosity coefficients were φ = 0.8, 16 and 23%. The experiments were carried out on longitudinal waves. Each block was placed in an aquatic medium, in which it was transmitted through an ultrasonic wave. The central frequency of the probe pulse was chosen within the range of f ~ 130-300 kHz. The wavelength in the epoxy resin was  mm. The obtained measurement results are summarized in Table 1.
| Variables | Values | |||
|---|---|---|---|---|
| Porosity, φ | 0 | 0.08 | 0.16 | 0.23 |
 |
0 | 0.5 | 1 | 1.45 |
| Uwater/Uφ | 1.03 | 2.18 | 4.75 | 3.9 |
| fv,Hz | 140 | 187 | 140 | 140 |
| λv,mm | 14.3 | 14.35 | 19 | 19.5 |
 |
0.015 | 0.4 | 1.08 | 0.94 |
Table 1: The obtained measurement results.
The experiment shows the qualitative agreement of the attenuation decrement values obtained experimentally and analytically.
In geological structures, vertical pressure prevails over horizontal pressure. Therefore, the opening of vertical fractures exceeds the opening of horizontal fractures and the permeability of reservoirs for horizontal wells is higher than for vertical ones.
The highest sensitivity with respect to the factor of presence of fractures is the criterion of wave attenuation. For longitudinal waves, the attenuation decrement has a strong dependence on the direction of the ray (beam) relative to the plane of the fractures. The change in the decrement takes place from the minimum, which occurs when the direction of wave propagation closes to the direction of the surface of fractures, up to a maximum, occurring when the orthogonal direction.
For the transverse waves, the attenuation decrement is practically independent of the direction of the wave propagation.
A method for measuring the attenuation decrement of longitudinal waves, and hence the study of fractures in the method of acoustic logging, is a method based on measuring and interpreting the ratio of the amplitudes of the longitudinal and transverse waves of the probing signal.
In the present work, an attempt is made to explain the cause of high attenuation of seismic waves in a porous medium. The work is based on the mechanism associated with the appearance of a force field in "soft" micro-heterogeneous inclusions. In this case, the increment of the attenuation decrement is expressed by the product of the porosity coefficient multiplied by the relative density of the interstitial fluid.
For highly porous oil and gas reservoir rocks, the attenuation decrement due to this mechanism is ten times higher than the decrement value due to other mechanisms.
The attenuation decrement for a given mechanism does not depend on the shape of the incoherent inclusions. Furthermore, it does not depend on the frequency and amplitude of the probing signal.