Journal of Proteomics & Bioinformatics
Open Access
ISSN: 0974-276X
ISSN: 0974-276X
Research Article - (2023)Volume 16, Issue 3
Leishmania donovani, a kinetoplastid parasite causing leishmaniasis, is an opportunistic parasitic pathogen that affects immunocompromised individuals and is a common cause of Kala-azar. Specific parasite molecules can be delivered into host epithelial cells and may act as effector molecules for intracellular parasite development. So, there is a need to develop new approaches to understanding the interaction between the host and the pathogen. In our study, we built a weighted gene co-expression network using differentially expressed genes obtained through analysis of leishmaniasis-infected patients. Our goal was to identify key signature genes and pathways associated with visceral leishmaniasis infection by network biology analysis which can identify the most influential genes in the gene coexpression interaction network. We identified five prominent genes, IFNG, SC5D, LSM1, CMC2, and SAR1B, with higher interamodular connectivity, as the key signature genes. A deep neural network model-variational autoencoder was utilized to create new features, and a support vector machine validated the key signature genes. These key signature genes are involved in various biological processes like cytokine-cytokine receptor interaction, TGF-beta signaling pathway, antigen processing and presentation, IL-17 signaling pathway, Th1 and Th2 cell differentiation, and T-cell receptor signaling pathway. Besides, we also identified 04 significant miRNAs targeted with key signature genes, including hsa-miR-340-5p, hsa-miR-325-3p, hsa-miR-182-5p, hsa-miR-1271-5p/hsa-miR-96-5p. Further, analysis of the differentially expressed genes revealed that many critical cellular responses were triggered by visceral leishmaniasis infection, including immune responses and inflammatory and cell apoptosis. We get FDA approved anti-inflammatory agents emapalumab and methylprednisolone as a re-proposed drug for leishmaniasis cure. Our study can enhance the understanding of the molecular pathogenesis of visceral leishmaniasis infection and have implications for the plan and execution of mRNA expression tools to support early diagnostics and treatment of visceral leishmania sis infection.
Leishmania donovani; Leishmaniasis; Cell differentiation; Anti-inflammatory agents; Gene co-expression
L. donovani is a kinetoplastid parasite causing leishmaniasis. An estimated 700000 to 1 million new cases and some 26000 to 65000 deaths occur annually due to leishmaniasis [1]. Pentavalent antimonials were earlier used as a first-line antibiotic against leishmaniasis-however, 60% of patients in Bihar were unresponsive to this drug. Thiol metabolism of the parasite is reported for pentavalent antimonial resistance [2].
Bioinformatics algorithms can be utilized for drug target identification. One approach is the analysis of metabolic pathways as it provides an insight into pathogen metabolic state. This approach can result in identifying essential and selective novel drug targets. As pathogens involve multiple metabolic pathways, analyzing the pathways at a system level is more prudent than focusing on a few genes [3]. During an infection, the metabolic rate of a pathogen was reported to be changed. We can identify new therapeutic drug targets by analyzing the metabolic changes during pathogenesis [4]. Multi-protein complexes mediate critical cellular functions of pathogens. These protein complexes' functionalbility depends on proteinprotein interaction between multiple protein complex sub-units. Identification of these sub-networks of protein-protein interaction can result in a novel therapeutic interventional site [5]. It has been shown that biological networks tend to be robust against random perturbation, but disruption of hubs often leads to system failure [6].
WGCNA is a powerful tool for identifying key genes and pathways associated with complex diseases, including cancer and infectious diseases. The methodology has yet to be applied to leishmaniasis data, but it has the potential to provide valuable insights into the underlying molecular mechanisms of the disease. Weighted Gene Co-expression Network Analysis (WGCNA) is a widely used bioinformatics approach for identifying gene modules that are biologically meaningful and functionally related to a disease or phenotype of interest. WGCNA uses a correlation based approach to group genes that have similar expression patterns across different samples into modules or clusters [7]. The modules can then be correlated with the phenotype of interest, such as disease status or clinical outcome, to identify gene networks that are associated with the disease.
Weighted Gene Co-expression Network Analysis (WGCNA) is a widely used bioinformatics method that helps identify modules of functionally related genes based on their coexpression patterns across different samples. This method is particularly useful for identifying groups of genes that are differentially expressed in disease samples compared to normal samples, as it can help identify gene modules that are closely related to the disease of interest [8].
By clustering genes into modules based on their expression patterns, WGCNA can help identify key biological pathways that are dysregulated in disease. These modules can then be further studied to identify potential therapeutic targets or biomarkers for diagnosis and treatment. Additionally, WGCNA can help identify hub genes that play a central role in regulating the expression of other genes within a module, providing further insights into the molecular mechanisms underlying disease [9].
In the case of leishmaniasis, we can use WGCNA to identify gene modules that are differentially expressed between normal and leishmaniasis samples. By examining the modules and the genes within them, we can gain insight into the biological pathways and mechanisms that contribute to the development and progression of leishmaniasis. This information can be used to develop more effective diagnostic and therapeutic approaches for the disease.
Microarray gene expression data typically have a high number of genes (i.e., features) and a small number of samples, which makes it challenging to build accurate classifiers or models. Dimensionality reduction techniques such as Principal Component Analysis (PCA), autoencoderm and Fisher's Linear Discriminant Analysis (FLDA) are commonly used to address this challenge [10-12].
Autoencoders are a type of neural network that can learn to compress high-dimensional data into a lower-dimensional representation. The input data is first encoded into a compressed representation, and then decoded back into its original form [13]. The autoencoder is trained to minimize the difference between the input and the output, effectively learning to extract the most important features in the data [14]. Variational Autoencoder (VAE) is an improvement over the traditional autoencoder that models the distribution of the compressed representation instead of just the mapping from input to output. VAEs are commonly used for unsupervised learning and can generate new data similar to the input data [15].
In the context of microarray gene expression data, VAEs can be used to effectively reduce the dimensionality of the data and extract meaningful features related to a specific disease, such as leishmaniasis, as you mentioned. By using VAEs, it is possible to identify important genes and pathways related to the disease, which can lead to better understanding of the disease and development of more accurate diagnostic tools or treatments.
The study aimed to identify key genes and construct a regulatory network involved in the progression of visceral leishmaniasis, a parasitic disease caused by Leishmania donovani. To achieve this, the researchers constructed a co-expression network of Differentially Expressed Genes (DEGs) using weighted gene co-expression network analysis.
The most significant modules in the network were identified, and key signature genes were determined using the module membership measure, also known as eigengene based connectivity (kME). Genes with a kME value close to 1 were considered key signature genes and used as a feature classifier. The researchers applied a variational autoencoder to genes with significantly different expression data, and the results were mapped to a 15-dimensional representation as another type of leishmaniasis feature.
Finally, the study established a regulatory network of genemiRNA targets for the progression of visceral leishmaniasis. This network can provide insight into the molecular mechanisms underlying the disease and potentially identify new therapeutic targets for treatment [16].
The detailed workflow is as follows (Figure 1).

Figure 1: The detailed workflow is as follows.
Data set acquisition
In this study, the leishmaniasis microarray dataset GSE 125993 from the gene expression omnibus was used, which contained whole blood transcriptional profiles associated with asymptomatic infection, active disease, and in treated cases of 84 samples. GSE 125993 is a microarray dataset combining the results of two independent experiments to understand the host response in disease cases better. Fakiola, et al., carried out experiment 1 (GSE125992) with the following conditions: Active visceral leishmaniasis case, treated with 15 doses of non-liposomal Amphotericin B on alternate days, quantiferon positive asymptomatic, endemic healthy control (serology and quantiferon negative), and HighAb-high anti-leishmanial antibody levels by direct agglutination test. Experiment 2 (GSE125993) Fakiola et al., included an active visceral leishmaniasis case, an active visceral leishmaniasis case treated with a single dose of liposome encapsulated amphotericin B, a quantiferon positive asymptomatic, an endemic healthy control (serology and quantiferon negative), and highAb-high antileishmanial antibody levels measured by direct agglutination [17].
Data preprocessing and quality check of samples
We used the R packages to preprocess the microarray dataset GSE 125993 and purged incomplete expression data records. Removing genes with zero variance is a common preprocessing step in gene expression analysis, and it can help to improve the accuracy and interpretability of downstream analyses. By removing genes with zero variance, we are essentially removing any genes that do not vary in expression across the samples in dataset. These genes are not informative for differential expression analysis or network construction, as they do not exhibit any differential expression patterns or correlations with other genes [18].
Moreover, including these genes in analysis can lead to problems with some statistical models, such as those that rely on the assumption of non-zero variance, and may also affect the quality of results. Overall, removing genes with zero variance is a standard data cleaning step that can help to ensure that analysis focuses on the most informative genes, and can improve the quality of results.
Pruning non-differentially expressed genes
The workflow I described is a common approach for performing differential gene expression analysis using the Limma package in R. Limma is a widely used package for this type of analysis, and it provides a powerful set of tools for modeling complex it provides a powerful set of tools for modeling complex experimental designs, performing normalization and quality control, and identifying differentially expressed genes. The workflow I outlined is a general framework that can be adapted to many different experimental designs and datasets, and can be used to generate high-quality results that are suitable for downstream analysis and interpretation. To summarize, the steps involved are:
•Create a design matrix: This matrix specifies which samples are applied to which channels on the array. It is essentially an indicator matrix that indicates the experimental design.
•Fit a linear model: Use the "lmFit" function to fit a linear model with the expression data and the design matrix as arguments.
• Create a contrast matrix: Use the "makecontrasts" function to create a contrast matrix for relevant comparisons.
• Compute fold-changes and t-statistics: Use the "Contrast.fit" function to compute fold-changes and t-statistics for the contrast of interest.
• Moderation of standard errors: Use the "eBayes" function to moderate the standard errors.
• Identify differentially expressed genes: Compute moderated t-statistics and log-odds of differential expression for each gene. Identify highly ranked differentially expressed genes with a p-value of <=0.05.
• Filter out non-differentially expressed genes: Remove genes that are not differentially expressed for any contrast.
Co-expression network and module construction
The goal of standard differential expression analysis is to identify individual genes. When each gene is treated as a separate entity, it is easy to lose sight of the forest for the trees, failing to recognize that thousands of genes can be organized into a small number of modules rather than presenting a list of individual genes, WGCNA is beneficial for comprehending the "system." WGCNA focuses on modules rather than individual genes, significantly reducing the number of tests required. We utilized the WGCNA R package to build the co-expression network. A scale-free network is better suited to describing gene-gene relationships. Signed networks are preferred because they preserve sign information, which is defined as aij=|0.5 +0.5*cor(xi,xj )|^β with a value of β for signed networks is 12. For signed networks with scale-free topology, a 'soft threshold' value of 14 was chosen by estimating scale-free topology 'fit index' and mean connectivity as a function of the soft-thresholding power. To build our co-expression network, we first generated a "Pearson correlation matrix", also known as a similarity matrix. We then used the power transformation to convert the similarity matrix to an adjacency matrix, as suggested [19,20]. Following that, modules were constructed and merged using a dynamic branch cut tree method, yielding five modules with a merging threshold value of 0.3.
Identification of key modules in co-expressed gene networks
Genes with similar expression partners are of interest because they may be tightly co-regulated, functionally related members of the same pathway. The analysis of co-expression networks reveals information about the underlying network and the group of genes whose expression levels are co-regulated. How do you identify the key players in a network or pathway of intriguing genes? Key signature genes in the entire network are frequently uninteresting, particularly in co-expression networks, but genes with high connectivity in interesting modules can be exciting. Some transcriptions play multiple roles depending on the cellular environment, so statistical significance does not always imply biological relevance. What are the advantages of constructing networks and identifying co-expression modules over considering each candidate gene individually? The answer is that identifying multiple therapeutic targets within the same pathway is beneficial in the search for druggable targets. The WGCNA R package employs the first principal component to determine how modules are related, referred to as Module Eigengene (ME). The modules of interest were discovered by examining the relationship between module eigengenes and clinical traits. In addition, a measure of Module Significance (MS) and gene significance was computed. A measure of Module Significance (MS) is defined as the average gene significance of all genes in the module. Gene significance is determined as a link between two genes. The gene modules with the highest MS and GS absolute value were more relevant in leishmaniasis [21,22].
Functional and pathway enrichment analysis of modules
The passage describes a common approach used in systems biology and bioinformatics to analyze gene expression data. In this approach, genes are not analyzed individually, but rather in groups or modules that are believed to have related functions. The modules are typically identified based on their co-expression patterns, meaning that the genes in each module tend to be turned on or off together under different conditions.
Once the modules are identified, they can be further characterized by performing enrichment analysis. This involves comparing the genes in each module to a database of known biological functions, such as Gene Ontology (GO) terms or Kyoto Encyclopedia of Genes and Genomes (KEGG) pathways, to see which functions are overrepresented in the module.
DAVID is a popular tool for performing enrichment analysis, and it can provide information on the top terms or pathways that are enriched in each module. For example, the top ten KEGG pathways and the top ten terms in each G.O. domain can be identified for each module, giving insights into the potential biological functions and processes that are associated with the module.
Overall, module based analysis and enrichment analysis are powerful tools for understanding the complex relationships between genes and their functions in biological systems.
Module visualization and identification of signature genes
A topological overlap matrix plot was used to visualize modules in the co-expression network. A topological overlap matrix plot is a visual representation of the topological overlap between genes in a co-expression network. It allows one to identify modules of genes that are highly interconnected and share similar expression patterns. The intramodular connectivity of genes within a module can be used to define a measure of module membership, or kME. The kME of a gene reflects its degree of connectivity within a module, with higher kME values indicating a greater degree of membership in the module.
By identifying genes with high kME values, one can identify key signature genes that are centrally located within the coexpression module and likely to play important roles in the biological processes associated with the module. Cytoscape is a popular software tool for visualizing and analyzing complex networks, including co-expression networks generated by WGCNA. It allows one to create customized network visualizations, perform network analyses, and integrate data from multiple sources to gain insights into the structure and function of biological networks.
Feature creation using variational autoencoder
An application of a Variational Autoencoder (VAE) is reducing the dimensionality of gene expression data and using the resulting compressed representation as a feature for disease classification. This is a common application of VAEs, as they are particularly useful for learning representations of high dimensional data that can be used for downstream tasks like classification.
To clarify, an autoencoder is a neural network architecture that is designed to learn a compressed representation of input data. The network is trained to reconstruct the input data from this compressed representation, so that the output layer has the same number of neurons as the input layer. The hidden layer(s) of the autoencoder has fewer neurons than the input and output layers, which forces the network to learn a compressed representation that captures the most salient features of the input data.
A VAE is a type of autoencoder that learns a compressed representation that is also a probabilistic model of the input data. Specifically, the hidden layer of the VAE learns the mean and variance of a probability distribution over the input data. During training, the network learns to minimize the reconstruction error (like a traditional autoencoder) while also encouraging the distribution learned by the hidden layer to be similar to a standard normal distribution. This encourages the VAE to learn a compressed representation that captures the most important features of the input data while also maintaining a smooth and continuous distribution in the latent space.
This approach is interesting because gene expression data is often high-dimensional, meaning there are many genes and measurements for each sample, which can make it difficult to analyze and interpret. Dimensionality reduction techniques, like the variational autoencoder, can be used to reduce the number of features to a more manageable level while still retaining important information.
Using the low dimensional representation generated by the autoencoder as a feature for a disease classification task is a common approach in machine learning. By training a classifier to distinguish between samples with and without leishmaniasis using the low-dimensional representation as input, it is possible to evaluate the effectiveness of the dimensionality reduction approach and potentially improve the accuracy of the classification task.
It's worth noting that the performance of the approach will depend on various factors, such as the quality and size of the original gene expression data set, the hyperparameters used in the autoencoder, and the choice of classifier. Nevertheless, this is an interesting application of autoencoders in bioinformatics and demonstrates the potential of machine learning techniques for analyzing complex biological data.
We created new gene expression data set with low dimensional information using a variational autoencoder. Further, dimensional information of created gene expression data set was used as a feature of the disease data set to classify leishmaniasis.
Evaluation of key signature genes with a classification algorithm
We used a machine learning algorithm, specifically a support vector machine with a Radial Basis Function (RBF) kernel, to validate the key signature genes identified in the study. The microarray gene expression data sets were first reduced to a lower dimension, and then effective features that were closely related to leishmaniasis were extracted. To evaluate the performance of the support vector machine algorithm, several performance measures were calculated. These measures include classification accuracy, which is the proportion of correctly classified instances out of the total number of instances; confusion matrix, which shows the number of true positives, true negatives, false positives, and false negatives; Area Under the R.O.C. Curve (A.U.C.), which is a measure of the algorithm's ability to discriminate between positive and negative instances; sensitivity, which is the proportion of true positives out of all positive instances; specificity, which is the proportion of true negatives out of all negative instances; and cross-entropy loss, which measures the difference between the predicted probability distribution and the true probability distribution.
By using these performance measures, we were able to evaluate the effectiveness of the support vector machine algorithm in accurately classifying instances as either positive or negative for leishmaniasis based on the reduced dimension of microarray gene expression and the effective features closely related to the disease.
Confusion matrix: A confusion matrix is a table used to evaluate the performance of a classification algorithm. It summarizes the number of correct and incorrect predictions made by the model on a set of data for each class. The four types of elements in a confusion matrix are:
• True Positive (TP): The number of instances that are actually positive and are correctly predicted as positive by the model.
• False Positive (FP): The number of instances that are actually negative but are incorrectly predicted as positive by the model. This is also known as a type I error.
• False Negative (FN): The number of instances that are actually positive but are incorrectly predicted as negative by the model. This is also known as a type II error.
• True Negative (TN): The number of instances that are actually negative and are correctly predicted as negative by the model.
By analyzing the values in the confusion matrix, we can calculate various metrics such as accuracy, precision, recall, F1-score, and others to evaluate the performance of the classification algorithm.
Accuracy: Accuracy is a common metric used to evaluate the performance of a machine learning model. It is calculated by dividing the number of correct predictions made by the model by the total number of predictions made. The formula for calculating accuracy is:
Accuracy=(Number of correct predictions)/(Total number of predictions)
For example, if a model correctly predicts 90 out of 100 samples, then the accuracy would be 90/100 or 0.9 (or 90%).
It's worth noting that accuracy is not always the best metric to use, especially if the classes in the dataset are imbalanced. In such cases, other metrics such as precision, recall, or F1 score may provide a more informative evaluation of the model's performance.
Sensitivity: Sensitivity is a statistical measure that assesses the ability of a model or test to correctly identify positive cases out of all true positive cases. In other words, sensitivity is the proportion of true positive cases that are correctly identified as positive by the model or test.
The sensitivity is calculated as the number of true positive cases divided by the sum of true positive cases and false negative cases. This can be expressed as:
Sensitivity=True positive/(True positive+False negative)
A high sensitivity value indicates that the model or test is able to correctly identify a large proportion of positive cases, while a low sensitivity value indicates that many positive cases are missed by the model or test. Sensitivity is particularly important in applications such as medical diagnosis or disease screening, where identifying all positive cases is crucial to avoid missing important cases.
Precision: Precision is a statistical measure that assesses the accuracy of positive predictions made by a model or test. It measures the proportion of true positive cases out of all positive predictions made by the model or test. In other words, precision is the measure of how many of the predicted positive cases are actually true positive cases.
Precision is calculated as the number of true positive cases divided by the sum of true positive cases and false positive cases, and it is usually expressed as a percentage. Mathematically, it can be represented as:
Precision=(True positive/(True positive+False positive)) × 100%
A high precision value indicates that the model or test is making accurate positive predictions, while a low precision value indicates that many of the positive predictions made by the model or test are incorrect. Precision is an important performance metric in applications where accurate positive predictions are critical, such as medical diagnosis, fraud detection, and spam filtering.
F-beta: The F-beta score is a performance metric that combines both precision and sensitivity by taking their harmonic mean. The contribution of each metric to the score depends on the value of the beta parameter, which determines the relative weighting of precision and sensitivity.
The F beta score is calculated as:

Here, beta is a non-negative parameter that determines the relative importance of precision and sensitivity in the score. A value of beta=1 gives equal weight to precision and sensitivity, while higher values of beta emphasize precision over sensitivity, and lower values of beta emphasize sensitivity over precision.
The F1 score is a special case of the F beta score where beta=1, and it gives equal weight to precision and sensitivity. The F1 score is often used as a summary metric for binary classification problems, where there is an equal emphasis on correctly identifying both positive and negative cases.
The F beta score is a useful metric when both precision and sensitivity are important, and their relative importance can vary depending on the application. It is commonly used in fields such as medical diagnosis, where both false positives and false negatives can have serious consequences.
Cross-entropy loss: In binary classification problems, where we are trying to predict whether a data point belongs to one of two possible classes, the cross-entropy loss (also called log loss) is a commonly used loss function to measure the difference between the predicted probabilities and the actual binary labels. Fitting a model to perform binary classification, the loss function is a binary cross-entropy/log loss defined as:

Where;
y and p(y) is the label and predicted probability of the point being positive class (correctly classified) for all N points.
In other words, the cross-entropy loss measures how well the predicted probabilities match the true binary labels. When the predicted probability is close to the true label, the loss is small, while when the predicted probability is far from the true label, the loss is large.
The cross-entropy loss is a commonly used loss function in machine learning, especially for binary classification tasks. It has several desirable properties, including being a smooth, differentiable function that can be optimized efficiently using gradient based methods.
miRNAs targeting key signature genes
MIENTURNET, an interactive web application was used for microRNA target enrichment analysis, to screen for miRNAs that are potentially involved in regulating key signature genes. MIENTURNET uses the TargetScan program for sequence based miRNA target predictions, and achieved significant functional enrichment of predicted miRNAs using the software.
After identifying the miRNAs potentially involved in regulating key signature genes using MIENTURNET, we used cytoscape 3.6.1 to establish a network of interactions between key signature genes and the identified miRNAs.
In addition to visualizing the interactions between key signature genes and miRNAs, we also conducted a functional enrichment analysis of the target genes, which involved identifying the biological processes, molecular functions, and cellular components that were most enriched among the target genes. This analysis can provide insights into the biological pathways that may be involved in the disease process and can help to identify potential drug targets.
Overall, the combination of MIENTURNET and cytoscape allowed identifying potential regulatory relationships between miRNAs and key signature genes, providing a more detailed understanding of the mechanisms involved in the disease process. The functional enrichment analysis of target genes also provided insights into potential drug targets.
Drug gene interaction analysis
To predict potential drugs for treating leishmaniasis, we used the DGIdb web tool. DGIdb is a database of drug-gene interactions and druggable genes that provides information on which drugs may be effective in treating specific diseases based on their interactions with genes involved in the disease process.
Using the DGIdb web tool, we likely queried the database with genes known to be involved in leishmaniasis and looked for drugs that interact with those genes. This approach can help to identify potential drugs that may be effective in treating the disease by targeting specific pathways or mechanisms involved in the disease process.
The use of computational approaches such as this can help to accelerate the drug discovery process by identifying potential drug candidates that can be further tested in preclinical and clinical studies. Overall, the use of the DGIdb web tool provides a valuable resource for identifying potential drug candidates for a wide range of diseases, including leishmaniasis.
We performed statistical data analysis and co-expressed gene network analysis to identify potential key signature genes. Statistical data analysis is a common approach in bioinformatics that involves applying statistical methods to high-throughput data, such as microarray or RNA-sequencing data, to identify genes that are differentially expressed between different samples or conditions. Co-expressed gene network analysis involves identifying groups of genes that are co-expressed or functionally related based on their expression patterns across different samples or conditions.
To interpret the biological significance of the differentially expressed module and repurposing drugs, we used gene ontology analysis and drug-gene interaction analysis. Gene ontology analysis involves using computational methods to identify the biological processes, molecular functions, and cellular components that are enriched among the differentially expressed genes. This can help to provide insights into the underlying biological pathways that are involved in the disease process.
Drug-gene interaction analysis involves identifying drugs that interact with the differentially expressed genes and exploring their potential as drug candidates for treating the disease. This approach can help to identify new uses for existing drugs or to identify potential drug targets for future drug discovery efforts.
Overall, the combination of statistical data analysis, co-expressed gene network analysis, gene ontology analysis, and drug-gene interaction analysis allowed the authors to identify potential key signature genes, interpret their biological significance and repurposing drugs in the context of leishmaniasis.
We performed statistical data analysis and co-expressed gene network analysis to enumerate potential key signature genes. Gene ontology and drug-gene interaction was done to interpret the biological significance of differentially expressed module and re-purposing drugs.
Data preprocessing and differentially expressed gene analysis
There are 21060 probes I.D.s and 84 samples in the GSE 125993 series microarray dataset. We eliminated probe IDs with incomplete expression data records. This is a common preprocessing step in microarray data analysis, as it helps to remove probes that are not informative or may produce unreliable results. The density and heatmap plots of the samples were created, which are presented in Figure 2. Density plots provide a visualization of the distribution of expression values for each sample, while heatmap plots provide a visualization of the overall patterns of expression across all samples. These plots can help to identify any outliers or patterns in the data that may need to be addressed during further analysis.
Overall, the initial data processing steps taken with the GSE 125993 microarray dataset helped to ensure that the data was of high quality and suitable for further analysis. The density and heatmap plots provided a useful visualization of the data and helped to identify any potential issues that needed to be addressed.

Figure 2: Density and correlation heatmap plot. (A) Density plot of microarray sample GSE125993 (B) Correlation heatmap of samples.
Our samples' density and heat map plots revealed that they were of good quality. We eliminated any genes with zero variance, keeping just the useful genes during differential expression. The Bioconductor package limma in R was used to perform differentially expressed gene analysis for all combinations of sample condition data. Genes with an F.D.R. p-value of less than 0.05 corrected for multiple testing using the B.H. technique were considered significant, and genes not differentially expressed in any sample conditions were filtered out. We found 3,646 genes that were expressed in the GSE 125993 dataset.
Construction of weighted co-expression gene network
We used the average linkage and Pearson's correlation methods to cluster the GSE 125993 samples in Figure 3A. To achieve a scale-free network, 12 (scale-free) powers were chosen as the softthresholding parameter in this investigation Figure 3B.
Our samples' density and heat map plots revealed that they were of good quality. We eliminated any genes with zero variance, keeping just the useful genes during differential expression. The Bioconductor package limma in R was used to perform differentially expressed gene analysis for all combinations of sample condition data. Genes with an F.D.R. p-value of less than 0.05 corrected for multiple testing using the B.H. technique were considered significant, and genes not differentially expressed in any sample conditions were filtered out. We found 3,646 genes that were expressed in the GSE 125993 dataset (Figure 3).

Figure 3: Sample clustering and scale-free network threshold. (A) Cluster dendrogram to detect outliers, (B) Scale-free independence and mean connectivity graph, (C) Histogram of nodes K and check scale-free topology.
The findings indicate that the co-expression network is a scalefree network, which is a common property of biological networks. This means that the distribution of connections (or degree) of the nodes follows a power law distribution, where a few nodes have a large number of connections (hubs) and most nodes have only a few connections. The use of weighting coefficients allowed for the generation of an adjacency matrix and Topological Overlap Measure (TOM), which helps to identify densely interconnected modules of genes.
Hierarchical clustering analysis of the genes was performed using node differences (1-TOM), which is a measure of dissimilarity between genes based on their connectivity in the network. This analysis helps to group together genes that have similar patterns of expression and connectivity in the coexpression network. The results of this analysis were presented in Figure 4.

Figure 4: Hierarchical clustering genes. (A) Gene clustering on TOM-based dissimilarity (B) Network heatmap plot of selected genes, (C) Eigengenes Adjacency heatmap.
Overall, the analysis of the co-expression network helped to identify modules of genes that are co-expressed and potentially involved in similar biological processes. The use of weighting coefficients and the TOM helped to improve the accuracy of this analysis and increase the resolution of the identified modules.
The clustering analysis of gene expression data identified a total of 18 modules, each containing a group of genes that are highly co-expressed. To identify modules that are functionally related, a correlation analysis was performed between different modules. This analysis revealed that some modules are highly correlated with each other, indicating that they may be involved in similar biological processes.
To merge highly correlated modules, a dynamic branch-cut tree method was used, which is a widely used method for module detection in co-expression networks. The method starts by treating each module as a separate tree and iteratively merges pairs of trees with the highest similarity based on their Topological Overlap Measure (TOM). The merging threshold value determines the level of similarity required for two trees to be merged into a single module.
In this study, a merging threshold value of 0.30 was used, resulting in the merging of 18 modules into 5 modules. The results of this analysis were presented in Figure 5, which shows the five final modules and the genes that belong to each module. This approach helped to identify a smaller number of modules that are more functionally related, making it easier to interpret the biological significance of the identified modules.

Figure 5: (A) Clustering dendrogram (B) Dynamic cut tree, and (C) Merged modules.
Identification and enrichment analysis of modules
We calculated the Pearson correlation coefficient between leishmaniasis and M.E. to analyze the relationship between gene modules of leishmaniasis disease (Table 1).
| Color | MEmagenta | MElightcyan | MEblue | MElightgreen | MEgrey |
|---|---|---|---|---|---|
| |Cor_ADR| | 0.29486 | 0.42101 | 0.3305 | 0.19686 | 0.30656 |
| p-value | 0.006474 | 6.67E-05 | 0.002137 | 0.072682 | 0.004565 |
| Module significance | 0.215953 | 0.32308 | 0.24895 | 0.165099 | 0.17063 |
Note: *Cor_ADR=Pearson correlation coefficient
Table 1: Pearson correlation between each module and leishmaniasis.
According to module significance, p-value, and Pearson correlation coefficient, MElightcyan became our module of interest (Table 1). The differentially expressed gene co-expression network module's putative biological activities were investigated using G.O. enrichment analysis. We did a Gene Ontology (G.O.) enrichment analysis of signature genes, and the results are pictorially shown in Figures 6 and 7.

Figure 6: Gene ontology analysis-biological process and molecular functions.
The enriched G.O. biological processes were positive regulation of ER-associated ubiquitin-dependent protein catabolic process, histone mRNA catabolic process, tetrahydrofolate interconversion, optic nerve development, negative regulation of insulin secretion involved in the cellular response to glucose stimulus, endonucleolytic cleavage in ITS1 to separate SSU-rRNA from 5.8S rRNA and LSU-rRNA from tricistronic rRNA transcript (SSU-rRNA, 5.8S rRNA, LSU-rRNA), cotranslational protein targeting to membrane, golgi ribbon formation, 7- methylguanosine cap hypermethylation, and vesicle organization. Enriched G.O. cellular processes were the Lsm1-7-Pat1 complex, pICln-Sm protein complex, spliceosomal tri-snRNP complex, transcription export complex, proteasome core complex, alphasubunit complex, mitochondrial proton-transporting ATP synthase complex, coupling factor F(o), methylosome, U4 snRNP, small nuclear ribonucleoprotein complex, and mitochondrial proton-transporting ATP synthase complex. The molecular process was enriched in methylenetetrahydrofolate dehydrogenase (NAD+) activity, Metheny tetrahydrofolate cyclohydrolase activity, methylenetetrahydrofolate dehydrogenase (NADP+) activity, phosphatidic acid transporter activity, U1 snRNP binding, NADH dehydrogenase (ubiquinone) activity, 4-iron, 4-sulfur cluster binding, Hsp70 protein binding, macromolecular complex binding, and structural constituent of ribosome.
The enriched GO KEGG were protein export, proteasome, valine, leucine, and isoleucine degradation, cardiac muscle contraction, spinocerebellar ataxia, spliceosome, protein processing in endoplasmic reticulum, coronavirus disease- COVID-19, non-alcoholic fatty liver disease, and oxidative phosphorylation as shown in Figure 7.

Figure 7: Gene ontology analysis-cellular components and kegg pathways.
Identification of key signature genes in key module and pathway analysis
A key signature gene in a module usually has a high gene significance, module membership value, and module interconnectivity. Therefore, we first selected genes with G.S.>0.45 and MM >0.75. These conditions were satisfied by six genes, namely, SC5D, LSM1, IFNG, CMC2, SAR1B, and C5orf15, as Key Signature Genes (KSGs) of leishmaniasis. Finally, we selected the top 5 genes, SC5D, LSM1, IFNG, CMC2, and SAR1B, with the largest interamodular connectivity, as the signature genes. We explored the functional association between key signature genes of leishmaniasis by performing gene ontology and KEGG pathway enrichment analysis. The IFNG (interferon-gamma) was enriched in cytokine-cytokine receptor interaction, HIF-1 signaling pathway, necroptosis, TGF-beta signaling pathway, osteoclast differentiation, antigen processing and presentation, JAK-STAT signaling pathway, natural killer cell mediated cytotoxicity, IL-17 signaling pathway, "Th1, and Th2 cell differentiation", "Th17 cell differentiation", "T cell receptor signaling pathway", type I diabetes mellitus, leishmaniasis, Chagas disease, African trypanosomiasis, malaria, toxoplasmosis, amoebiasis, tuberculosis, hepatitis C, influenza A, herpes simplex virus 1 infection, pathways in cancer, PD-L1 expression and PD-1 checkpoint pathway in cancer, inflammatory bowel disease, "systemic lupus erythematosus", rheumatoid arthritis, allograft rejection, graft-versus-host disease, fluid shear stress, and atherosclerosis. Gene LSM1 (LSM1 homolog, mRNA degradation associated) enriched in RNA degradation. Gene SC5D (Sterol-C5-Desaturase) is involved in steroid biosynthesis and metabolic pathways. Gene SAR1B (secretion associated Ras related GTPase 1B) functional enriched in protein processing in endoplasmic reticulum, legionellosis. There have been many reports of the essential roles of cytokine in responding to leishmaniasis during the activation of the disease.
Feature creation using variational autoencoder
Variational autoencoder is a class of deep learning neural network architecture that belongs to generative models. In neural network architecture, a variational autoencoder consists of an encoder, a decoder, and a loss function. The encoder transforms input data into latent space, and the decoder reconstructs data given the hidden representation. An autoencoder is neural network architecture whose inputs are high-dimensional data points that convert them into a low dimensional latent vector and further reconstruct the original input sample by utilizing latent vector representation without losing valuable information (Figures 8A and 8B). Variational autoencoders can be defined as auto-encoders whose training is tuned to avoid overfitting, and the latent space has suitable properties that enable the generative process. We created a variational auto-encoder deep neural network with input as differentially expressed gene sets. The network was trained with 3646 genes as input at the input layer, 584 and 100 as intermediate layers, and 15 as latent dimensions. Optimized hyperparameters by parameterization trick with a batch size of 20, learning rate as 0.0005, the test data size of 35, epochs as 50, fold count as 10, and sigmoid activation function was used. We created new features of the gene expression data set to reduce the dimensionality of gene expression data and converted this gene expression data into a 15 dimensional representation to minimize dimensionality.
Validation of the key signature genes with a classification algorithm
We investigated the validity of the identified key signature genes with the help of Support Vector Machine classification (SVM). We selected the best parameters for the S.V.C. model using the grid search method. Radial Basis Function (RBF) kernel with width σ,
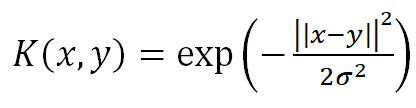
Regularization parameter, which is the penalty parameter that represents misclassification C=1000; and gamma=0.01 were estimated as the best parameters. Using these best estimated parameters, SVM classified 0.859%~86% accurately with 5-fold Cross-validation (Cv) on the training set and 0.82%~82% accuracy on the test set (Figure 8C). Evaluation metrics associated with confusion matrix are as follows (Figure 8D):
Our classification model with labels (0,1) gives accuracy of (0.859,0.823) on training and test sets, respectively. Support vector machine classification model with labels (0,1) gives sensitivity of (0.72,0.94). The precision of the support vector machine classification model with labels (0,1) is (0.93,0.71). Our classification model with labels (0,1) gives f1-score of (0.81,0.83).
ROC-AUC: The ROC-AUC score is a commonly used metric for evaluating the performance of a classifier, especially in binary classification problems. It measures the ability of the model to distinguish between positive and negative samples. An ROCAUC score of 0.5 represents a random classifier, while a score of 1.0 represents a perfect classifier. The closer the ROC-AUC score is to 1, the better the classifier performance. It is an important metric for evaluating the performance of a classifier, particularly in cases where the class distribution is imbalanced.
In this case, the ROC-AUC score of 0.91 indicates that the support vector machine classifier model performed very well in distinguishing between the genes related to leishmaniasis and those that are not. Therefore, it can be concluded that the classifier has a high degree of accuracy and reliability (Figure 8).
A cross-entropy or log loss value approaching zero indicates that the predicted probabilities of the model are close to the true probabilities. Therefore, a value of 0.3 and 0.2 for the test and training datasets, respectively, suggests that the binary classification model is performing well and accurately predicting the classes.
miRNAs targeting key signature genes infected by visceral leishmaniasis
We extracted the targets of key signature genes-miRNAs using MIENTURNET. Five key signature genes (SC5D, LSM1, IFNG, CMC2, and SAR1B) interact most with miRNAs enlisted in Table 2.
| S.N. | miRNA family | p-value | F.D.R. | Target gene |
|---|---|---|---|---|
| 1 | hsa-miR-340-5p | 0.059106 | 0.373919 | IFNG, SAR1B |
| 2 | hsa-miR-325-3p | 0.020637 | 0.373919 | SC5D, SAR1B, CMC2 |
| 3 | hsa-miR-182-5p | 0.054174 | 0.373919 | SAR1B, SC5D |
| 4 | hsa-miR-1271-5p/hsa-miR-96-5p | 0.044298 | 0.373919 | SAR1B, SC5D |
Table 2: Mienturnet enrichment results from TargetScan.
We have found 04 significant miRNAs targeted with key signature genes, including hsa-miR-340-5p, hsa-miR-325-3p, hsamiR- 182-5p, hsa-miR-1271-5p/hsa-miR-96-5p. Investigating the 04 miRNAs identified with biomarkers in visceral leishmaniasis infection was significantly associated with p<0.05. miRNAs hsa-miR-340-5p targeted with two key signature genes (IFNG, SAR1B), hsa-miR-325-3p targeted with three key signature genes (SC5D, SAR1B, CMC2), hsa-miR-182-5p targeted with genes SAR1B and SC5D, hsa-miR-1271-5p/hsamiR- 96-5p targeted with genes SAR1B and SC5D.
Gene-drug interaction analysis
We identified approved drugs from DGIdb database. We get FDA approved anti-inflammatory agents Emapalumab and Methylprednisolone as a re-proposed drug for leishmaniasis cure. Using the "Gene and Drug Landing Page Aggregator (GDLPA)" web tool, we identified gene-drug interactions as listed in Table 3.
| S.N. | Gene | Drugs |
|---|---|---|
| 1 | SC5D | Lanosterol, tretinoin, simvastatin, isopentenyl pyrophosphate, mevalonic-acid, fluconazole, lovastatin, isoflurane, tromethamine, putrescine |
| 2 | LSM1 | Racemethionine, tromethamine, uridine, fluorouracil, gemcitabine, biotin, ampicillin, tretinoin, imidazole, thiamine |
| 3 | IFNG | Hydrocortisone,tretinoin,prednisolone,prednisone,tromethamine,isoniazid,aspirin,d-threo-neopterin,biotin,methylprednisolone |
| 4 | CMC2 | Fluorouracil,tromethamine,letrozole,pidorubicine,ampicillin,dexamethasone,zidovudine,cetrimonium,capric acid, stearic acid |
| 5 | SAR1B | Vitamin e, hydroxyurea, paclitaxel, tromethamine, nocodazole, nifedipine, oxymetazoline, glutaral, morpholine, gamma-tocopherol |
Table 3: Gene-drug interactions.
Despite remarkable progress toward eliminating V.L. as a public health problem in India, transmission continues, and V.L. outbreaks are increasingly recognized. In this study, we reanalyzed whole blood transcriptomic data to identify differentially expressed genes. Further, co-expression gene interaction networks were constructed for differentially expressed genes. Next, co-expression network was decomposed in modules. Analyzing desiese specific module, key signature genes are identified. Additionally, key signature genes were validated among differentially expressed genes. Transcriptomic data are large dimensional in terms of genes, so there was a need to create new features. A variation of generative adversarial network namely variational autoencoder was applied to create new features of differentially expressed genes. A new dataset was created with the key signature genes and 15 dimentional data of differential expressed genes. Thereafter, supervised machine learning method-support vector machine was applied to classify disease and control cases samples. Thus, a two-step approach was applied to study whole blood transcriptomic data to identify key signature genes.
Protein-protein/gene-gene interactions have been studied from different perspectives such as biochemistry, quantum chemistry, molecular dynamics, signal transduction, and among others. All this information enables the creation of large protein interaction networks similar to metabolic or genetic/epigenetic networks that empower the current knowledge on biochemical cascades and molecular etiology of disease, as well as the discovery of putative protein targets of therapeutic interest. Insufficient adjacency matrix measures interconnectedness in a network. Still, another approach is the topological overlap matrix (shared), which gives more meaning the WGCNA co-expression network analysis method is used in systems biology to identify disease genes, pathways, and key regulators.
The leishmaniasis disease microarray dataset GSE125993 was analyzed in this study, and a weighted gene co-expression network was constructed with differentially expressed gene sets. Probe ids of 21060 were annotated with respective gene symbols. Preprocessing the microarray data by making density and heat plots, and eliminating genes with zero variance, good quality data was retained. Limma statistical package with an F.D.R. pvalue less than 0.05 as the cutoff was applied to identify 3646 differentially expressed genes. These differentially expressed genes were used to construct a weighted gene co-expression network using Pearson's correlation method. The average linkage method with hierarchical clustering clustered the differentially expressed genes into five modules. Module's interconnected analysis reveals that the module MElightcyan was more significant than other modules.
Furthermore, the KEGG pathway and gene ontology analysis of module MElightcyan identified the potential function of the genes in the module. This revealed that these genes were clustered in many pathways, with emphasis on protein processing in endoplasmic reticulum, metabolic pathways, amyotrophic lateral sclerosis, valine, leucine and isoleucine degradation, protein export, etc. The enriched biological processes were co-translational protein targeting to membrane, golgi ribbon formation, 7-methylguanosine cap hyper methylation, vesicle organization and positive regulation of ERassociated ubiquitin dependent protein catabolic process, tetrahydrofolate interconversion. Enriched cellular processes were the mitochondrial proton-transporting ATP synthase complex Lsm1-7-Pat1 complex, spliceosomal tri-snRNP complex, transcription export complex, proteasome core complex, mitochondrial proton-transporting ATP synthase complex, small nuclear ribonucleoprotein complex. The molecular process was enriched in methylenetetrahydrofolate dehydrogenase (NAD+) activity, metheny tetrahydrofolate cyclohydrolase activity, methylenetetrahydrofolate dehydrogenase (NADP+) activity, NADH dehydrogenase (ubiquinone) activity, 4 sulfur cluster binding, Hsp70 protein binding, macromolecular complex binding, structural constituent of ribosome, and phosphatidic acid transporter activity.
Next, we selected the top 5 genes namely SC5D, LSM1, IFNG, CMC2, and SAR1B with high module interconnectivity, module membership value, and gene significance. As Key Signature Genes (KSGs) of leishmaniasis. The IFNG (interferon-gamma) was enriched in 'cytokine-cytokine receptor interaction', 'IL-17 signaling pathway', 'Necroptosis', 'TGF-beta signaling pathway', 'osteoclast differentiation', ‘antigen processing and presentation’, ‘JAK-STAT signaling pathway’, ‘natural killer cell mediated cytotoxicity’,‘T-cell receptor signaling pathway’, ‘inflammatory bowel disease’, ‘HIF-1 signaling pathway’, ‘systemic lupus erythematosus’, and ‘atherosclerosis’. Gene LSM1 (LSM1 homolog, mRNA degradation associated) enriched in RNA degradation. Gene SC5D (Sterol-C5-Desaturase) is involved in steroid biosynthesis and metabolic pathways. Gene SAR1B (secretion associated Ras related GTPase 1B) functional enriched in protein processing in endoplasmic reticulum, legionellosis. There have been many reports of the essential roles of cytokine in responding to leishmaniasis during the activation of the disease.
A variational auto-encoder deep neural network with input as differentially expressed gene sets was trained with optimized hyperparameters by parameterization trick, created new features of the gene expression data set, and converted this gene expression data into a 15-dimensional representation to minimize dimensionality. Investigating the validity of the identified key signature genes with the help of a support vector machine with best-estimated parameters, SVM classified 0.859%~86% accurately with 5-fold Cross-Validation (CV) on the training set and 0.82%~82% accuracy on the test set. Further, confusion matrix values summarize the performance of this classification algorithm.
Resulted classification model with labels (0,1) gives accuracy of (0.859,0.823) on training and test sets, respectively. SVM classification model with labels (0,1) gives sensitivity of (0.72,0.94), precision of (0.93,0.71). And f1-score of (0.81,0.83). The ROC-AUC of our support vector machine classifier model is 0.92, which approaches 1. So, it concluded that the classifier did well in classifying the genes. Cross-entropy loss computed binary cross-entropy/log loss as 0.3 and 0.2 for test and training data sets, respectively, and approaches to zero. Thus, the binary classification model is significantly good.
Targets of key signature genes-miRNAs found 04 significant miRNAs targeted with key signature genes, including hsamiR- 340-5p, hsa-miR-325-3p, hsa-miR-182-5p, hsa-miR-1271-5p/ hsa-miR-96-5p. Investigating the 04 miRNAs identified with biomarkers in visceral leishmaniasis infection was significantly associated with p<0.05. miRNAs hsa-miR-340-5p targeted with two key signature genes (IFNG, SAR1B), hsa-miR-325-3p targeted with three key signature genes (SC5D, SAR1B, CMC2), hsa-miR-182-5p targeted with genes SAR1B and SC5D, hsa-miR-1271-5p/hsa-miR-96-5p targeted with genes SAR1B and SC5D.
Further, text-mining of gene-drug interaction revealed FDA approved anti-inflammatory agents emapalumab and methylprednisolone as a re-proposed drug for leishmaniasis cure. Using the web tool, we identified gene-drug interactions. These drugs need further experimental validation for their possible use in leishmaniasis treatment. This study is based on leishmaniasis gene expression analysis. Furthermore, we need wet-lab studies to interpret and validate the functionality.
In this study, we aimed to detect key signature genes and pathways implicated in active visceral leishmaniasis. We have five genes IFNG, SC5D, LSM1, CMC2, and SAR1B, with higher interamodular connectivity, as the key signature genes. These genes were validated using a machine learning algorithm by creating new gene features by applying a variational autoencoder. These genes are involved in processes like cytokinecytokine receptor interaction, IL-17 signaling pathway, T-cell receptor signaling pathway, and Th1 and Th2 cell differentiation. Besides, hsa-miR-340-5p, hsa-miR-325-3p, hsamiR- 182-5p, hsa-miR-1271-5p/hsa-miR-96-5p miRNAs were found to target key signature genes. Further, candidate drugs were identified by gene-drug interaction. The emapalumab and methylprednisolone were identified as re-purposed drugs for leishmaniasis cure. The results of this study may give insight into the understanding of the molecular pathogenesis of visceral leishmaniasis infection.
However, this study used an integrated experimental and computational methodology for transcriptomic analysis. Incorporating multiple experimental and computational approaches can help gain a more comprehensive understanding of the disease and identify novel targets for drug development. lncRNA analysis is missing. lncRNAs have importance in controlling intestinal epithelial cell death, increasing inflammation. It is a valid point that lncRNAs play an essential role in many biological processes, and their potential role in disease pathogenesis cannot be ignored. lncRNAs are linked to the pathogenesis of a variety of disorders. Therefore, Future studies could focus on the role of lncRNAs in the context of the disease being studied. Additionally, studying host-pathogen protein-protein interactions could provide more insight into the disease mechanism and identify potential therapeutic targets.
R.N.V. is financially supported by the University Grants Commission (UGC), New Delhi, India. G.P.S. acknowledges the support from the Department of Science and Technology (DST)-Science and Engineering Research Board (SERB) project (Id: File No-E.C.R./2017/003480/P.M.S., file no. M.T.R./ 2021/000378) and department of biotechnology, ministry of science and technology, govt. of India (project id BT/PR40251/ BITS/137/11/2021). We acknowledge B.I.C. at J.N.U. funded by D.B.T. for infrastructure.
R.N.V. and G.P.S. conceived the model. R.N.V. and N.S. Analyzed and interpreted the results. R.N.V. wrote the manuscript. N.S and G.P.S. jointly supervised this study. All authors approved the final manuscript.
All data are available in the NCBI GEO database.
The authors declare no competing interests.
[Google Scholar] [PubMed]
[Crossref] [Google Scholar] [PubMed]
[Crossref] [Google Scholar] [PubMed]
[Crossref] [Google Scholar] [PubMed]
[Crossref] [Google Scholar] [PubMed]
[Crossref] [Google Scholar] [PubMed]
[Crossref] [Google Scholar] [PubMed]
[Crossref] [Google Scholar] [PubMed]
[Crossref] [Google Scholar] [PubMed]
[Crossref] [Google Scholar] [PubMed]
[Crossref] [Google Scholar] [PubMed]
[Crossref] [Google Scholar] [PubMed]
[Crossref] [Google Scholar] [PubMed]
[Crossref] [Google Scholar] [PubMed]
[Crossref] [Google Scholar] [PubMed]
[Crossref] [Google Scholar] [PubMed]
[Crossref] [Google Scholar] [PubMed]
Citation: Verma RN, Subbarao N, Singh GP (2023) A Two-Step Approach-Machine Learning, Variational Autoencoder, and Weighted Gene Co- Expression Network Analysis Identify Key Signature Genes and Pathways Implicated in Active Visceral Leishmaniasis. J Proteomics Bioinform. 16:648.
Received: 10-Mar-2023, Manuscript No. JPB-23-22116; Editor assigned: 13-Mar-2023, Pre QC No. JPB-23-22116 (PQ); Reviewed: 27-Mar-2023, QC No. JPB-23-22116; Revised: 19-May-2023, Manuscript No. JPB-23-22116 (R); Published: 26-May-2023 , DOI: 10.35248/0974-276X.23.16.648
Copyright: © 2023 Verma RN, et al. This is an open-access article distributed under the terms of the Creative Commons Attribution License, which permits unrestricted use, distribution, and reproduction in any medium, provided the original author and source are credited.