Journal of Stock & Forex Trading
Open Access
ISSN: 2168-9458
ISSN: 2168-9458
Research - (2022)Volume 9, Issue 3
According to the semi-strong form of Efficient Market Hypothesis (EMH), any public information should be reflected in the price, and earnings announcement as one type of information. This research focuses on the Nifty 50 stock index, where no researches have been realized so far. The main aim of the research is to study stock returns behavior during quarterly earnings announcement in the Nifty 50 market. For this study secondary data of the selected sample companies has been collected. A sample of 25 top market capitalization companies in the Nifty 50, their stock price and quarterly earnings announcements of the year 2021-2022 were taken for this study.
The study employs event study methodology to measure the impact of the earnings announcement on the stock price movement. The research uses technical indicators to analyze the market behavior in the event period. The results showed an anomaly in the bad earnings surprise sample in which the cumulative abnormal returns continuously increased after the event. The Nifty 50 market was analyzed using technical indicators and it was found that the market was bullish in nature so even though the companies reported bad earnings since the whole market was raising the stock prices also rose. This was further confirmed by doing an event study on a neutral market which showed no anomalous reaction. In conclusion it was found that the type of market influences the movement of stock price behavior. The results of event study from a neutral market were found to be satisfactory and showed no anomalous reaction.
Efficient market hypothesis; Earnings announcement; Event study; Technical indicators
In the 1960s, Eugene Fama, recognized as the “Father of modern finance”, introduced the Efficient Market Hypothesis in his doctoral thesis. He put forward three hypothesis of the efficient market:
• The weak-form efficiency, the security’s price reflects its historical prices, which means that future prices cannot be predicted by analyzing prices from the past.
• The semi strong-form efficiency, the security’s price reflects all publicly available information: no excess return can be earned by trading on this information. But profit can be made via not publicly available information.
• The strong-form efficiency, the security’s price reflects all information, this is the case where the abnormal returns equal zero.
Earnings announcement is the first undisputed proof that analysts, investors, and traders receive regarding a company’s performance for the quarter or the year. The days before an earnings announcement are important for investors and analysts to pay attention to. It is when analysts speculate and provide estimates that result in a definitive effect on share prices, either causing them to start an upward or downward trend.
According to the semi-strong form of Efficient Market Hypothesis (EMH), any public information should be reflected in the price, and earnings announcement as one type of information. The market price should immediately and in an unbiased manner reflect this information. This empirical research on stock reaction to earnings announcement is important for both investors and managers. By examining the stock reactions to earnings announcement, investors can judge the efficacy of earning preannouncement. At the same time, managers can better understand how to design earnings announcement strategies and manage the firm to maximize its stock price.
A research study on effect of earnings announcement will help the analyst to understand how the stock price gets affected by the earnings announcement.
The selected companies are:
• Reliance Industries Ltd.
• Tata Consultancy Services Ltd.
• HDFC Bank Ltd.
• Infosys Ltd.
• Hindustan Unilever Ltd.
• ICICI Bank Ltd.
• State Bank of India
• Bajaj Finance Ltd.
• Housing Development Finance Corporation ltd
•Bharti Airtel Ltd.
• ITC Ltd.
•Kotak Mahindra Bank Ltd.
• Asian Paints Ltd.
• Maruti Suzuki India Ltd.
• Hcl Technologies Ltd.
• Larsen & Toubro Ltd.
• Bajaj Finserv Ltd.
• Wipro Ltd.
• Axis Bank Ltd.
• Sun Pharmaceutical Industries Ltd.
• Titan Company Ltd.
• Ultratech Cement Ltd.
• Nestle India Ltd.
• Oil & Natural Gas Corporation Ltd.
• Adani Ports and Special Economic Zone Ltd.
Asthana and Mishra examined the effect of the sizes of the announcing and non-announcing firms on information transfers. They highlighted the fact that there were more pre-announcement earnings in large firms; and that the abnormal returns of the large firms may contain information that is useful for other firms in the same industry.
de Fond put the finger on the context in which the information is released. A large body of research examines cross-country differences, this being said, [1] emphasized more on two specific aspects of it: cross-country differences in investors‟ reactions to annual earnings announcements and country-level differences in the financial reporting environment. de Fond finding highlighted the fact that countries with higher quality earnings have more informative annual earnings announcements, while in countries with more frequent interim financial reporting, annual earnings announcements were less informative.
Jegadeesh and Livnat study consisted of estimating earnings and sales (or revenue) surprises either with historical time-series data or with analyst forecasts. Post-earnings-announcement drift was found to be stronger when the revenue surprise was in the same direction as the earnings surprise. This result proved to be robust to various controls, including the proportions of stock held by institutional investors, arbitrage risk, and turnover (prior 60-month average trading volume). This finding is consistent with prior evidence that earnings surprises have a more persistent effect on future earnings growth when they consist of higher revenue surprises than when they consist of lower expense surprises.
Chavannavar and Patel tested the weak and semi-strong form efficiency over the study period from 2013 to 2016. Sample constitutes 100 stocks and autocorrelation, run test, residual test and event study was used for analysis. It was found that the events had no bearing on returns, and inferred that market was efficient in both the forms [2-7].
Born tested the semi strong form of efficient market 53 hypothesis in context of trump’s tweets over the period from 9th November 2016 to 20th January 2017. Sample constitutes 15 tweets (events) about 10 publicly traded firms. Standard event study methodology was used. The results showed that on event day, positive tweet results in positive abnormal returns and negative tweet in negative abnormal returns. CARs were also found insignificant and the study inferred that the results were compatible with the EMH.
Singh and Yadav examined the efficiency of semi strong form of BSE in context of stock split announcement over the period from 2010 to 2017. Sample constitutes 59 stock split announcements and standard event study methodology was applied for analysis. Results of the study based on AARs and CAARs are found contradictory to each other, hence the study provide mixed results regard efficiency of BSE during the study period.
Aim
To study how stock returns behave during quarterly earnings announcement in the Nifty 50 market
The data for the study are taken from the moneycontrol.com and yahoo finance.com for the period of 2021-2022 (Table 1).
| Objectives | Statement of the objective | Method/ Methodology |
|---|---|---|
| 1 | Study of abnormalreturns and CAAR from earnings surprise | Event Study |
| 2 | Analysis of the nifty 50 market to identifythe factors whichcauses anomalyreaction | Technical Analysis
|
| 3 | Study abnormal returns from stocks in a neutral market. | Event Study |
Table 1: The data for the study are taken from the moneycontrol.com and yahoo finance.com for the period of 2021-2022.
Objective 1
To study the abnormal returns and cross section analysis of cumulative abnormal returns with reference to earnings surprise.
From Table 2 we can see that the CAAR has increased during the event day from 0% to 0.8%. The CAAR has continued to increase till the end of the event period indicating the good earnings sample has positively impacted the stock price during the event. In the bad earnings surprise the CAAR has increased after the event day from 2.3% to 3.4% and it has continued to increase to 4.1% up until the last day of the event period. So, the event of good earnings surprise has positively impacted the stock price which is an anomalous reaction because bad earnings surprise should result in a decrease in the CAAR In the no earnings surprise sample, the CAAR has not seen any noticeable increase or decreasebefore or after the event. So, the event of no earnings surprise had no particular impact on the stock price.
| Good earnings surprise sample | Bad earnings surprise sample | No earnings surprise sample | ||||||
|---|---|---|---|---|---|---|---|---|
| AAR | CAAR (good earnings) | CAAR (Bad | CAAR (no | |||||
| AAR | earnings) | AAR | earnings) | |||||
| 1 | 0.00% | 0.20% | 1 | -0.20% | -0.40% | 1 | 0% | 0% |
| 2 | 0.10% | 0.30% | 2 | -0.20% | -0.70% | 2 | 0% | 0% |
| 3 | 0.40% | 0.70% | 3 | 0.60% | 0.00% | 3 | 0% | 1% |
| 4 | 0.30% | 0.90% | 4 | 0.20% | 0.30% | 4 | 0% | 0% |
| 5 | -0.10% | 0.90% | 5 | 0.40% | 0.50% | 5 | 0% | 0% |
| 6 | 0.20% | 1.10% | 6 | 0.50% | 1.10% | 6 | 0% | 0% |
| 7 | -0.10% | 1.00% | 7 | 0.30% | 1.60% | 7 | 0% | 0% |
| 8 | -1.00% | 0.00% | 8 | 0.70% | 2.30% | 8 | 0% | -1% |
| Event Day | 0.90% | 0.80% | Event Day | Event Day | ||||
| 1.10% | 3.40% | 0% | 0% | |||||
| 1 | 0.00% | 0.80% | 1 | -0.10% | 3.40% | 1 | 1% | 1% |
| 2 | 0.20% | 1.00% | 2 | 0.20% | 3.60% | 2 | 0% | 1% |
| 3 | 0.20% | 1.20% | 3 | 0.40% | 4.00% | 3 | 0% | 0% |
| 4 | 0.60% | 1.80% | 4 | 0.20% | 4.20% | 4 | 0% | 0% |
| 5 | 0.80% | 2.60% | 5 | 0.00% | 4.10% | 5 | 0% | 0% |
| 6 | 0.10% | 2.70% | 6 | -0.40% | 3.80% | 6 | 0% | 0% |
| 7 | -0.30% | 2.40% | 7 | 0.10% | 4.00% | 7 | 0% | 0% |
| 8 | 0.00% | 2.40% | 8 | 0.00% | 4.10% | 8 | 0% | 0% |
Table 2: AAR and CAAR of the companies in 2021-22.
From the Figure 1 the CAAR have shown an increase during the event day and then has continued to show a positive increase in the CAAR. This shows that the CAAR has increased from the event day which means the event has positively impacted the earnings of the company. The CAAR from bad earnings surprise have shown an increase during the event day and then has continued to show a positive increase in the CAAR. This shows that the CAAR has decreased from the event day which means the event has positively impacted the earnings of the company. This is an anomalous result because bad earnings should show a decrease in the AAR and CAAR. The CAAR from no earnings surprise have shown an increase during the event day and then has shown no significant change in the CAAR. This shows that the CAAR has shown no particular change from the event day which means the event has positively impacted the earnings of the company. From the outcome we can see that the results from positive earnings surprise and negative earnings surprise have shown satisfactory results but in bad earnings surprise the CAAR has increased instead of decreasing which is an anomaly. This will be further studied in the next objective to find if the type of market had an impact on the movement of AAR and CAAR [8-11].
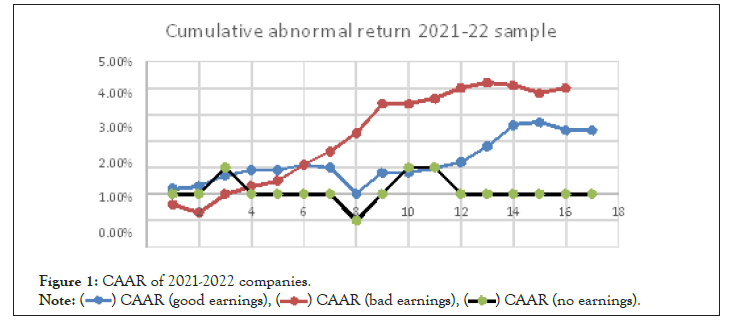
Figure 1: CAAR of 2021-2022 companies.
Objective 2
Technical analysis of the Nifty 50 market to identify the factors which causes anomaly reaction in the negative earnings surprise.
In this objective a technical analysis was done on the market to identify the type of market using different technical indicators like RSI, Stochastic oscillator and Williamson %R was used.
Average RSI=56.79996 Bullish Market
From the Figure 2 the average RSI is 56.7996 which show that the market during the financial year 2021-22 is bullish in nature.
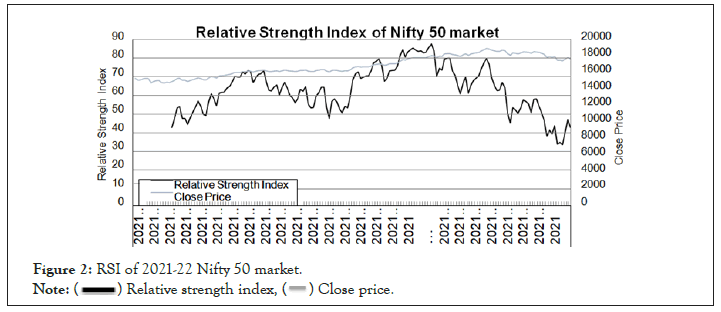
Figure 2: RSI of 2021-22 Nifty 50 market.
Average RSI=56.79996 Bullish Market
From the Figure 3 the average RSI is 56.7996 which show that the market during the financial year 2021-22 is bullish in nature.
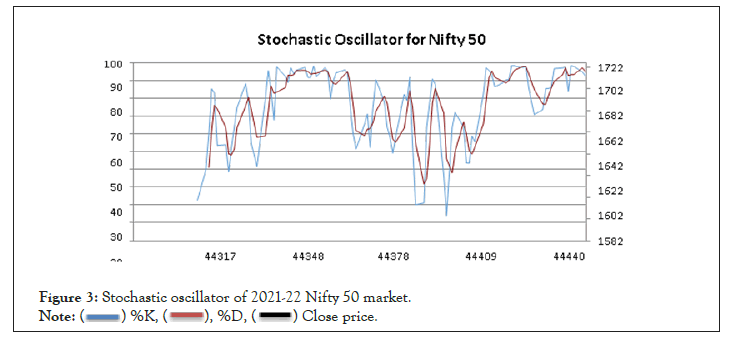
Figure 3: Stochastic oscillator of 2021-22 Nifty 50 market.
Average CCI=51.42 Bullish Market
From the Figure 4 the average Williamson %R is (-35.04) which shows that the market during the financial year 2021-22 is bullish in nature.
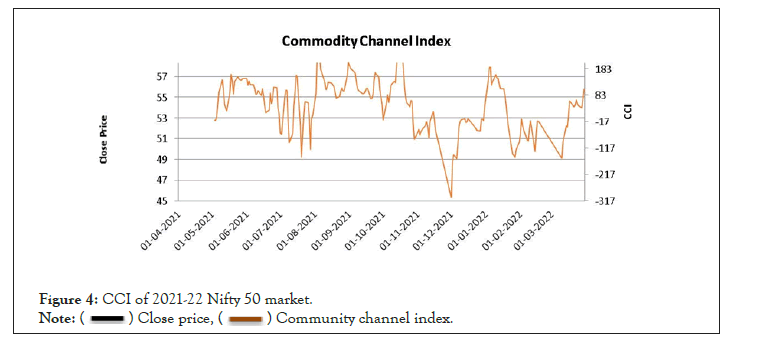
Figure 4: CCI of 2021-22 Nifty 50 market.
All the technical indicators show that the market during the financial year 2021-22 is bullish in nature. In a bullish market the stock prices keep rising up to 20% for several weeks, months or even years. So, from this we can interpret that the anomaly reaction which showed an increase in the AAR and CAAR in the bad earnings surprise sample was caused due to the bullish nature of the market in which the stock prices kept rising even though the company reported bad earnings.
Objective 3
Study abnormal returns from stocks in a neutral market.
As we have seen from the first and second objective the anomaly in reactions was caused due to bullish nature of the market. So, in this objective we try to find out whether anomaly reactions occur in a neutral market. For this objective the most neutral market from the last 10 years was identified using technical analysis. After identifying the market then stock price reaction around earnings announcement is studied using 3 different samples (good earnings surprise, bad earnings surprise, no earnings surprise) just like the first objective. This objective is done to identify if any anomaly reaction occurs in a neutral market or the results give satisfactory results.
Average RSI=47 Neutral Market
From Figure 5 the value of RSI is 47 during the financial year 2015-16 which indicates the market is neutral in nature.
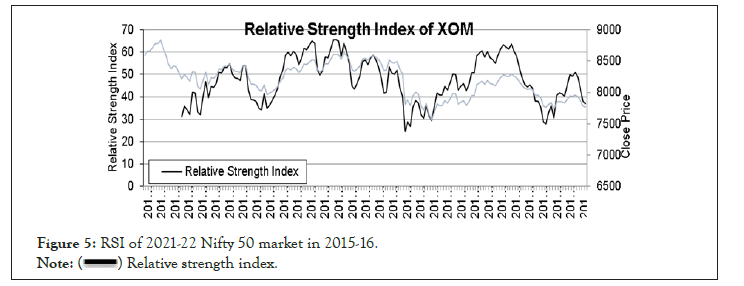
Figure 5: RSI of 2021-22 Nifty 50 market in 2015-16.
From the Figure 6 average %k is 50.94 which show that the market is neutral in nature in the financial year 2015-16.
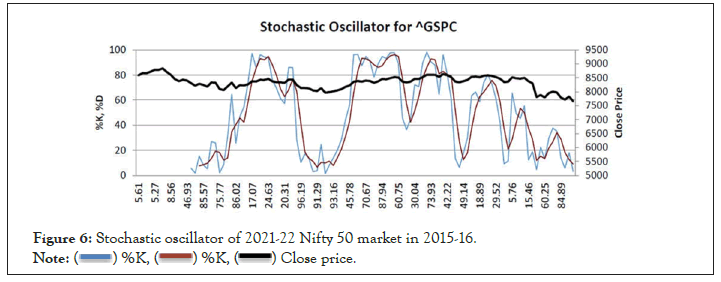
Figure 6: Stochastic oscillator of 2021-22 Nifty 50 market in 2015-16.
Average CCI=(-19.04) Neutral Market
From the technical analysis above it was found that the financial year 2015-16 was the most neutral market in the last 10 years.
In the next step of the objective, we find the stock price reaction to event announcements of the top 25 companies in the Nifty 50 market in the year 2015-16. In this objective the same methodology in objective 1 is repeated.
From Table 3 we can see that in the good earnings sample during the event day there has been a sharp increase in the CAAR from 2.2% to 4.1% and the CAAR has continued to increase until the end of the event day. So, the good earnings surprise has positively impacted the stock price of the companies. In the bad earnings sample during the event day the CAAR has steeply decreased from 1.8% to 0.5% and it has been continuously decreasing up until the end of the event day. So, the bad earnings surprise has negatively impacted the stock price of the companies. In the no earnings surprise sample, we cannot see any significant change in the movement of the AAR or CAAR before or after the event day. So, the no earnings sample had any particular impact on the movement of the stock prices of the company.
| Good earnings surprise sample | Bad earnings surprise sample | No earnings surprise sample | ||||||
|---|---|---|---|---|---|---|---|---|
| AAR | CAAR (good earnings) | CAAR (Bad | CAAR (no | |||||
| AAR | earnings) | AAR | earnings) | |||||
| 1 | -0.20% | 0.20% | 1 | 0.00% | 0.40% | 1 | -1% | -1% |
| 2 | 0.50% | 0.70% | 2 | 0.00% | 0.80% | 2 | -1% | -1% |
| 3 | 0.60% | 1.30% | 3 | 0.00% | 1.30% | 3 | 0% | -1% |
| 4 | 0.40% | 1.70% | 4 | 0.00% | 1.70% | 4 | 0% | -2% |
| 5 | -0.60% | 1.20% | 5 | 0.00% | 2.00% | 5 | 0% | -1% |
| 6 | 1.50% | 2.70% | 6 | 0.00% | 2.40% | 6 | 0% | -1% |
| 7 | 0.00% | 2.70% | 7 | -1.00% | 1.70% | 7 | 0% | -1% |
| 8 | -0.50% | 2.20% | 8 | 0.00% | 1.80% | 8 | -1% | -2% |
| Event Day | 1.90% | 4.10% | Event Day | Event Day | ||||
| -1.00% | 0.50% | 0% | -2% | |||||
| 1 | 1.20% | 5.30% | 1 | -1.00% | -0.90% | 1 | 0% | -1% |
| 2 | 0.40% | 5.70% | 2 | 0.00% | -0.90% | 2 | 0% | -1% |
| 3 | 1.00% | 6.70% | 3 | -1.00% | -2.00% | 3 | 0% | -1% |
| 4 | 0.40% | 7.10% | 4 | 0.00% | -1.80% | 4 | 0% | -1% |
| 5 | -0.10% | 7.00% | 5 | 0.00% | -1.90% | 5 | 0% | -1% |
| 6 | -0.40% | 6.60% | 6 | -1.00% | -2.70% | 6 | 0% | 0% |
| 7 | 1.30% | 7.90% | 7 | 0.00% | -2.60% | 7 | 0% | -1% |
| 8 | 0.10% | 8.00% | 8 | 0.00% | -2.60% | 8 | 0% | -1% |
Table 3: AAR and CAAR of the companies in 2015-16.
From the Figure 7 in the good earnings sample the CAAR have increased during the event day and then has continued to show a positive increase in the CAAR. This shows that the CAAR of good earnings surprise sample has increased from the event day which means the event has positively impacted the stock price of the company. In the bad earnings sample the CAAR has decreased during the event day and then has continued to show a negative change in the CAAR. This shows that the CAAR of bad earnings surprise sample has decreased from the event day which means the event has negatively impacted the stock price of the company. In the no earnings surprise CAAR has shown no significant change during the event period. The AAR has shown only little change before and after the event period. This shows that the CAAR of no earnings surprise sample had no particular impact on the stock price of the company (Figure 8) [12].
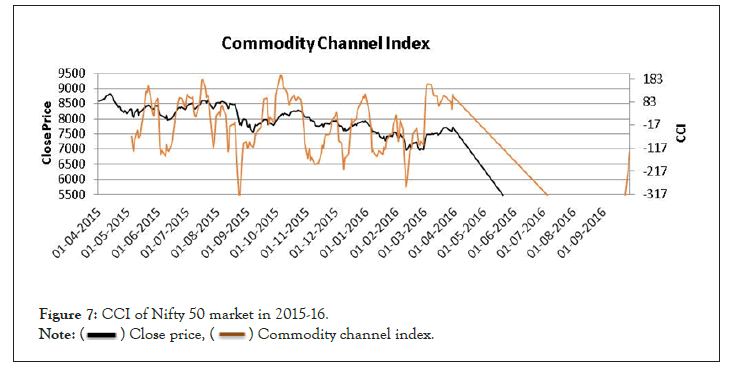
Figure 7: CCI of Nifty 50 market in 2015-16.
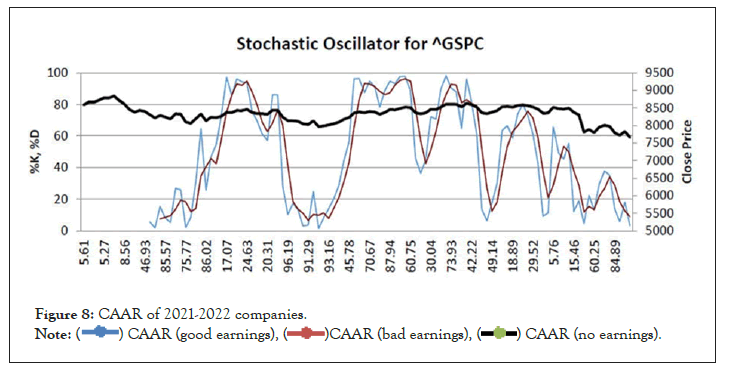
Figure 8: CAAR of 2021-2022 companies.
All the results from the 3 different samples are satisfactory and there is no anomalous reaction. This shows that the anomaly only occurs in bullish and bearish markets in which the whole market is expected to change which in turn affects the stock price of companies as well.
The research focuses only on the stocks of Nifty 50 market, so further analysis on different markets in India can be done. A different sample type can be considered. When conducting this research, we decided to take the top 25 companies of Nifty 50 according to their market capitalization. It can be relevant to take another sample. A different sample can be medium capitalization and small capitalization companies. The analysis may show different results. Different subdivision can be made. In this thesis, researching with different subdivisions: big companies versus small companies. A smaller structure might react faster, and the consequences and study outcomes can be different. The same research with the same methodology shall be done on annual announcements. It might provide different results.
Earnings announcement is the first undisputed proof that analysts, investors, and traders receive regarding a company’s performance for the quarter or the year. The main aim of the research is to study stock returns behavior during quarterly earnings announcement in the Nifty 50 market. The CAAR of the good earnings surprise increased after the event day indicating the stock price went up after the event. The CAAR of no earnings surprise showed little to no increase after the event day indicating there was no significant change in the stock movement. The bad earnings surprise showed an anomalous result in which the CAAR increased after the event day. All the technical indicators showed that the market was bullish in nature in the given time period which have caused anomaly reaction in the results. Technical analysis was done to find market which was neutral. All 4 indicators showed the 2015-16 market was neutral. Good earnings surprise showed increase in abnormal returns. Bad earnings surprise showed negative abnormal returns. No surprise earnings showed no significant change. This shows that there is no anomaly reaction in a neutral market. In conclusion it was found that the type of market influences the movement of stock price behavior. The results of bad earnings sample in the first objective on a bullish market was anomalous while the results of event study from a neutral market were found to be satisfactory and showed no anomalous reaction.
A study on stock return performance around earnings announcements by Dr. Uday K Jagannathan and Mr. Cheshire H. To study the abnormal returns and cross section analysis of cumulative abnormal returns with reference to earnings surprise of the companies in Nifty 50 market by Dr. Uday K Jagannathan and Mr. Cheshire H. Technical analysis of the Nifty 50 market to identify the factors which causes anomaly reaction in the positive and negative earnings surprise by Dr. Uday K Jagannathan and Mr. Cheshire H. To Study abnormal returns from stocks in a neutral market by Dr. Uday K Jagannathan and Mr. Cheshire H.
I’m highly indebted to Dr. Uday K Jagannathan, Assistant Professor of Faculty of Management for her guidance, constant supervision, insightful comments, and suggestions at every stage of the research and also for her unwavering support in completion of thesis.
[Crossref] [Google Scholar].
[Crossref] [Google Scholar].
[Crossref] [Google Scholar].
[Crossref] [Google Scholar].
[Crossref] [Google Scholar].
[Crossref] [Google Scholar].
[Crossref] [Google Scholar].
[Crossref] [Google Scholar].
[Crossref] [Google Scholar].
Citation: Jagannathan UK, Cheshire H (2022) A Study on Stock Return Performance around Earnings Announcements in the Indian Stock Market. J Stock Forex. 09:214
Received: 10-Aug-2022, Manuscript No. JSFT-22-18792; Editor assigned: 15-Aug-2022, Pre QC No. JSFT-22-18792 (PQ); Reviewed: 29-Aug-2022, QC No. JSFT-22-18792; Revised: 05-Sep-2022, Manuscript No. JSFT-22-18792 (R); Published: 12-Sep-2022 , DOI: 10.35248/2168-9458.22.09.214
Copyright: © 2022 Jagannathan UK, et al. This is an open access article distributed under the terms of the Creative Commons Attribution License, which permits unrestricted use, distribution, and reproduction in any medium, provided the original author and source are credited.