Biochemistry & Pharmacology: Open Access
Open Access
ISSN: 2167-0501
ISSN: 2167-0501
Research Article - (2014) Volume 3, Issue 6
The measurement of sucrose hydrolysis to glucose and fructose in yeast is valuable for many aspects of yeast cell biology and metabolic analysis, and has been used extensively to understand the genetics of the SNF1 kinase. However, a simple and rapid method describing how to perform this assay for new users is lacking. Here, we review various methods used to measure invertase activity. We focus on a method based on a colorimetric assay that was first described by Goldstein and Lampen in 1975. Our report not only describes a simple and rapid application of this method to measure secreted invertase enzymatic activity from yeast whole cells for new users, but also establishes optimized times for assay conditions. The method utilizes a small volume of yeast culture in which the entire procedure can be performed in less than an hour. Very few reports offer a step-by-step method that can be readily used without prior knowledge of the procedure, providing the impetus for this report. The optimizations described in this report allow increased sensitivity when comparing subtle changes.
<Keywords: Yeast, SUC2, Invertase, SNF1 kinase, Assay method
The yeast external invertase enzyme exists as a dimer that can associate to form octamers [1]. Invertase converts the disaccharide sucrose into glucose and fructose [2]. Under conditions of low glucose, yeast cells express invertase as an attempt to use alternative carbon sources. The invertase enzyme is encoded by the SUC2 gene, which produces two types of invertase enzymes, one that is glycosylated and secreted into the periplasmic space, and one that in not glycosylated and maintained within the cytosol [3,4]. The cytosolic form is expressed at low constitutive levels, whereas the periplasmic invertase is strictly regulated by glucose repression. The periplasmic localized invertase requires up to 3 hours for maximum activity when depressed, which then decreases slowly and is associated with a gradual release of invertase into the growth medium [5].
Under normal laboratory conditions yeast are grown in 2% glucose-supplemented media, where SUC2 expression is actively repressed by the glucose activated transcriptional repressor Mig1 [6]. Low levels of glucose (0.014-0.067%), but not alternative carbon sources (such as galactose and glycerol), specifically activate SUC2 expression [7]. Under these conditions, Mig1 repression is lifted by SNF1 kinase phosphorylation [8,9]. When glucose concentrations are high (2% for example) the SNF1 kinase is inactive and maintained in the cytosol, but under low glucose conditions becomes phosphorylated and transported into the nucleus, and other cellular compartments. Once active, SNF1 kinase phosphorylates a host of cellular factors that work to resist stress, and leads to the use of alternative carbon sources. The most studied of these targets is Mig1. Phosphorylation of Mig1 by SNF1 kinase leads to export of Mig1 from the nucleus, activation of SUC2, and expression of invertase. Sucrose in the media can then be converted to glucose and fructose. In fact, the SNF1 kinase complex was first identified as a sucrose non-fermentable mutant [10].
The study of invertase activity has been extensively used over the past 90 years to measure glucose in foods and various organisms, and more recently to assess SNF1 kinase activity. The invertase assay measures the amount of glucose converted from sucrose from yeast cells grown under activating (low glucose) or repressing (high glucose). This has been a powerful assay that has yielded valuable information about the genetics of SNF1 kinase function. Methods used to measure invertase activity have relied on the analysis of reducing sugars by spectrophotometry of colored reactions using dinitrosalicylic acid [11-14], or o-dianisidine [15], enzyme assay kits [16], polarimetry [17] (discussed in 13), HPLC [18], in-gel assays [10,19] and ultrasonic techniques [2]. Many recent reports that utilize the invertase assay refer to work based on spectrophotometric measurement of colored reactions using o-dianisidine at OD540 [20]. A recent report described measuring invertase activity [20] from invertase fused to the C-terminal 21 amino acids of the GPI (glycosylphosphatidylinositol) transamidase (GPI-T), which anchored the invertase enzyme to the plasma membrane [21]. Cells from this study were grown in media supplemented with 1% fructose (depressing conditions) for 36 hours. Methods have also been described where invertase activity is measured via preparation of cell lysates using glass beads [22]. However, a detailed simple and rapid protocol for performing the yeast invertase assay for new users is lacking. The purpose of this report is to provide a detailed and simple protocol for conducting the yeast invertase assay using whole cells and spectrophotometric measurement of product.
Strains, media, reagents and general methods
Strains used in this study were based on the S288c genetic background. The mig1Δ and snf1Δ mutants were described previously [23]. Cells were grown in YP media (1% yeast extract; 2% peptone) supplemented with 2% glucose for repressing conditions, or 0.05% glucose for activating conditions. Glucose oxidase was purchased from Calbiochem, peroxidase, type I, from horseradish, was purchased from SIGMA, and o-dianisidine was obtained from Alfa Aesar. Westerns were performed according to our standard protocols [24].
Cell Preparation
Cells from a single yeast colony were used to inoculate 15 ml overnight YPD (2%) cultures (see Supplementary Materials for protocol). Plates were generally 2% YPD containing 2% agar. Typically, after 16 hours of growth at 30ºC, the cells were at an optical density (OD) of 0.1 - 0.3, read at a wavelength of 600 nm (OD600). It is important to start the experiment when the cells are in the early phase of log growth, as the SUC2 gene is induced as glucose is depleted within the culture. Once the cells are at the appropriate OD, 1×10⁶ cells are removed to assess invertase activity under repressed conditions. Cell concentrations were calculated using an OD600 of 1.0, which is roughly equivalent to 2×10⁷ cells/ml. The remaining cells were then harvested and resuspended at an OD600 of 0.2 - 0.3 in YPD (0.05%). This condition is considered activating for SUC2 expression and invertase activity. However, others have used 0.1% glucose for activating conditions, as well as 5% glucose for repressing conditions [22]. The cells were then incubated at 30ºC for 2 hours. For 37ºC experiments, the cells were incubated in 2% YPD at 37ºC for 2 hours prior to addition of prewarmed 0.05% YPD. Cells were then harvested, resuspended in 0.05% YPD and incubated at 37ºC for 2 hours. Following growth in activating conditions, 1×10⁶ cells were removed to assess invertase activity. For time course studies, once the cells were resuspended in 0.05% YPD, 1×10⁶ cells were removed every 20 minutes for 2 hours to assess invertase activity. Invertase activity in 2% glucose cultures prior to harvesting is considered time zero. Each aliquot of 1×10⁶ cells was centrifuged washed 2 times with 200 μl sterile H2O, then kept on ice until all samples were prepared. The pellets from 1×10⁶ cells are small, so care must be taken to ensure the cell pellet is not pipetted away. Washing the cells in 10 mM Na Azide has been described [25], and this seems to result in a tighter cell pellet, which is easier to work with. When performing protein analyses in parallel with the invertase assay (such as for Western analysis), cultures were used that accommodated 5 - 10 ml of culture/protein lysate. We used the following formula to determine the amount of 2×SDS buffer (20% glycerol; 2% β-mercaptoethanol; 4% SDS; 0.13 M Tris pH 6.8; and 6.65 mg/100 ml Bromophenol Blue) to use when resuspending cell pellets, when preparing protein lysates: 2X SDS (μl) = OD600 × volume of cells used × 10. Once the cells were resuspended in 2×SDS buffer, the cells were boiled for 5 minutes, centrifuged and kept frozen at –20ºC until needed.
Invertase Assay
Once the cells were washed 2 times with either sterile water or 10 mM Na Azide, the cell pellets were left on ice until needed. It is easiest to wash the cells directly after harvesting rather than at the end when many samples have accumulated. It is also more manageable to wash less than 10 samples at a time, as cell pellets loosen while awaiting pipeting. To start the reaction, all samples were resuspended in 50 μL 50 mM Na Acetate pH 5.1. Controls prepared for every assay were: a) cells without sucrose, b) no cells plus sucrose, and tubes containing c) 250 and d) 500 μM glucose (prepared from a 1 mM stock solution). Each control was brought to 50 μl with H2O (c and d) or 50 mM NaAc (a and b). The controls were carried through the remainder of the assay. Next, 12.5 μl 0.5 M sucrose was added to all samples, except controls a, c and d, where 12.5 μl H2O was added. To ensure consistent start times, sucrose was added to the side of the eppendorf and then mixed when ready to start the assay. Immediately following addition of sucrose, the tubes were incubated at 37ºC. The reaction becomes saturated after 10 minutes of incubation, so incubation times longer than 10 minutes will not accurately reflect the μM Glucose converted/min in this reaction. Therefore, after 10 minutes at 37ºC, stop the reaction by adding 75 μl of 0.2 M K2HPO4. The samples were then put on ice for 1 minute, boiled for 3 minutes and placed on ice again for 1 minute. Samples remained on ice at this point while additional samples were being treated. To begin the color reaction, 500 μl of the assay mix was added. The assay mix is made fresh by adding 50 μl of 5000 U/ml glucose oxidase, 62.5 μl 1 mg/ ml peroxidase and 375 μl 10 mg/ml o-dianiside (suspend o-dianiside in 95% ethanol in a fume hood, as this is a toxic substance, and wrap in tin foil when stored at 4ºC) into 25 ml 0.1 M potassium phosphate buffered to pH 7.0. The assay mix is wrapped in tin foil, stored at 4ºC, and made fresh every week. The samples are then incubated at 37ºC for 20 to 30 minutes. However, we find that this reaction is saturated after 10 minutes. In our hands, the invertase reaction is most sensitive when the sucrose to glucose conversion occurs for 10 minutes, followed by a 10-15 minute color reaction. Following the color conversion incubation, 500 μl 6 N HCl was added to develop the color. At this point, the reaction is complete and stable for a number of days at room temperature. The amount of sucrose converted to glucose is measured at OD540 after cellular debris has been pelleted. Control a (containing cells without sucrose; see above for control description) is used to zero the measurements. We find that the reading is saturated by anything greater than 500 μM glucose. Diluting the samples 20 fold (50 μl into 1 ml) into a 1:1 mixture of assay buffer:6 N HCl allows a more accurate measurement of the developed pink color. The amount of glucose converted is calculated by dividing the OD540 reading of the sample by the OD540 reading for 250 μM glucose (control c). This number is multiplied by 250 to give the total μM glucose converted and then divided by the time of the reactions (10 minutes in our hands). Invertase activity is given as μM glucose converted/minute/106 cells, as the number of cells assayed is 1×10⁶. The formula is: (OD540 sample/ OD540 control c) ×(250/reaction time).
The invertase activity measured in this assay is predominantly the activity of the inducible enzyme that is secreted into the periplasmic space [4]. The invertase assay reported here is based on a protocol first described in 1975 [20] and used by many labs, but adequate description of the method for first time users is lacking. The assay essentially contains 3 keys steps: 1) cell preparation, 2) conversion of sucrose to glucose and fructose by the secreted invertase enzyme, and 3) quantitative measurement of the glucose produced. The number of cells used in the assay, the time required for the conversion of sucrose to glucose, and time for glucose measurement were optimized in this report for use in our laboratory. We found that measurement of 1×10⁶ cells (100 μl of a culture at OD6000.5 will yield approximately 1×10⁶ cells) produced values that approached the limit of the linear range of the experiment (Figure 1). Increasing the cell number to 1.5×10⁶ or higher do not increase the amount of glucose measured. Using this assay to measure glucose production in repressed and depressed mig1Δ and snf1Δ mutants confirmed that the assay is correctly measuring Snf1 kinase activity at the SUC2 promoter (Figure 2). The experiments in Figures 1 and 2 were performed with sucrose to glucose conversion time of 15 minutes and color development time of 30 minutes. When we optimized these conditions, we found that a sucrose to glucose conversion time of 10 minutes (Figure 3), and a color development time of 10-15 minutes was optimum (Figure 4), which differs from the reaction times commonly described in the literature (15 minutes for the sucrose to glucose conversion and 30 minutes for the color development). Furthermore, we found that the conversion of sucrose to glucose is most rapid at the beginning of the reaction and slows down over time (Figure 3B). It is therefore important to be accurate and consistent when performing the sucrose to glucose conversion reaction. We find that our reported incubation times provide the most sensitive results.
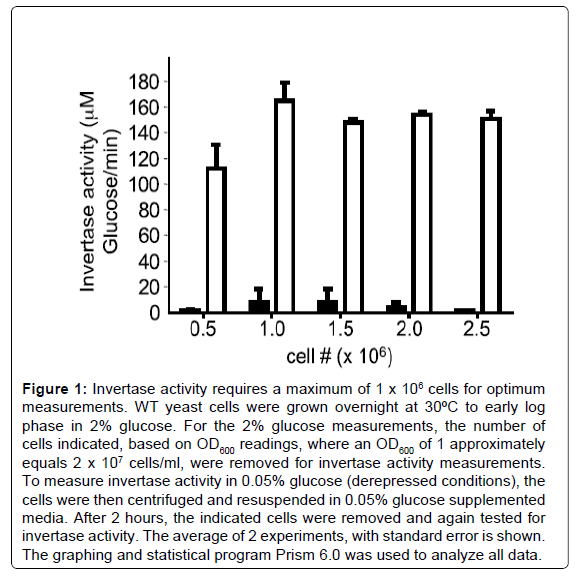
Figure 1: Invertase activity requires a maximum of 1 x 10⁶ cells for optimum measurements. WT yeast cells were grown overnight at 30ºC to early log phase in 2% glucose. For the 2% glucose measurements, the number of cells indicated, based on OD600 readings, where an OD600 of 1 approximately equals 2 x 10⁷ cells/ml, were removed for invertase activity measurements. To measure invertase activity in 0.05% glucose (derepressed conditions), the cells were then centrifuged and resuspended in 0.05% glucose supplemented media. After 2 hours, the indicated cells were removed and again tested for invertase activity. The average of 2 experiments, with standard error is shown. The graphing and statistical program Prism 6.0 was used to analyze all data.
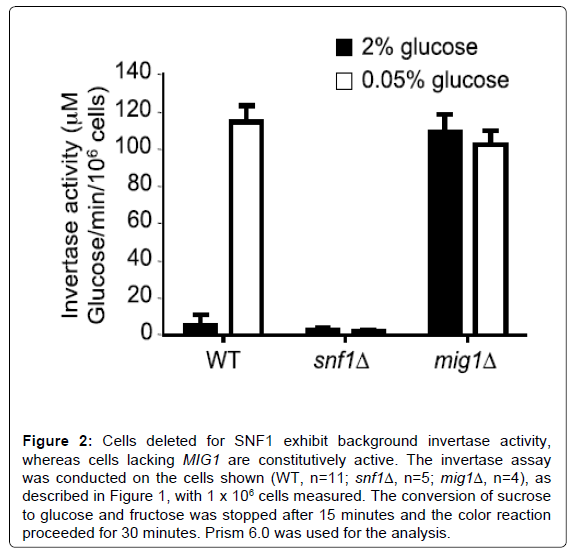
Figure 2: Cells deleted for SNF1 exhibit background invertase activity, whereas cells lacking MIG1 are constitutively active. The invertase assay was conducted on the cells shown (WT, n=11; snf1Δ, n=5; mig1Δ, n=4), as described in Figure 1, with 1 x 10⁶ cells measured. The conversion of sucrose to glucose and fructose was stopped after 15 minutes and the color reaction proceeded for 30 minutes. Prism 6.0 was used for the analysis.
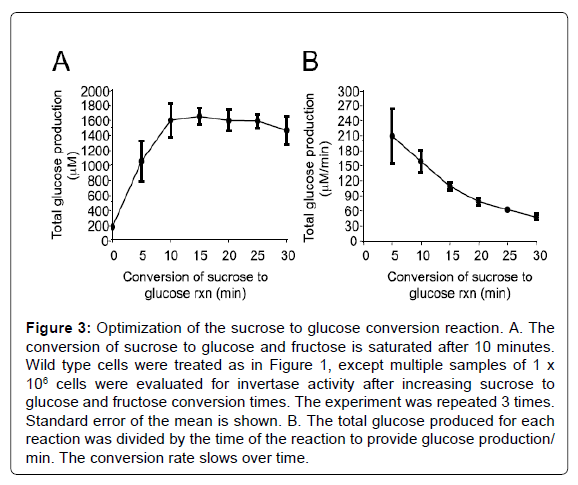
Figure 3: Optimization of the sucrose to glucose conversion reaction. A. The conversion of sucrose to glucose and fructose is saturated after 10 minutes. Wild type cells were treated as in Figure 1, except multiple samples of 1 x 10⁶ cells were evaluated for invertase activity after increasing sucrose to glucose and fructose conversion times. The experiment was repeated 3 times. Standard error of the mean is shown. B. The total glucose produced for each reaction was divided by the time of the reaction to provide glucose production/ min. The conversion rate slows over time.
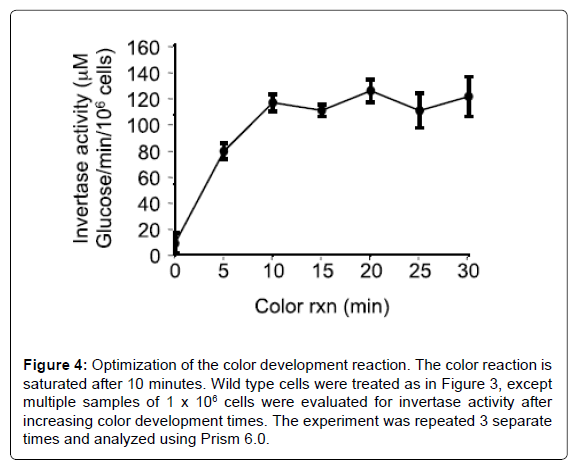
Figure 4: Optimization of the color development reaction. The color reaction is saturated after 10 minutes. Wild type cells were treated as in Figure 3, except multiple samples of 1 x 10⁶ cells were evaluated for invertase activity after increasing color development times. The experiment was repeated 3 separate times and analyzed using Prism 6.0.
We tested invertase activity in wild type cells expressing endogenously TAP-tagged MIG1 grown at 30ºC and 37ºC. The cells were grown overnight in YPD 2% glucose at 30ºC. The next morning, when 20 ml cell cultures were in early log phase, the cells were split and incubated at 30ºC and 37ºC in YPD 2%. After 2 hours, samples were taken for invertase activity measurement (1×10⁶ cells). Samples were also removed for protein lysate preparation (5 ml). The remaining cells were washed and resuspended in 0.05% glucose, and again incubated at 30ºC and 37ºC. After 2 hours, samples were removed for invertase activity determination and protein lysate preparation. Figure 5A shows that temperature has little effect on invertase activity after 2 hours in derepressing conditions. Western analyses using antibodies against phosphorylated mammalian AMPK, which recognizes phosphorylated yeast Snf1, shows that Snf1 is activated after growth in 0.05% glucose at both 30ºC and 37ºC. Likewise, antibodies that recognize the TAP epitope show that Mig1-TAP is also phosphorylated when grown in 0.05% glucose irrespective of temperature. In snf1Δ cells, as expected, there was no detectable signal from the phospho AMPK α antibody, no Mig1 phosphorylation and no invertase activity (Figure 5A). To take a more defined view of invertase activity at elevated temperatures, we conducted a time course, as previously described (Figure 5B) [22]. Our results demonstrate that shifting the temperature of the experiment to 37ºC does not impact the assay. Although many studies have shown that yeast cells have a faster growth rate and a higher rate of glucose consumption when shifted from 28ºC to 37°C [26-28], this does not influence the activation of the invertase enzyme. Nonetheless, the time course approach to analyzing invertase activity provides greater detail than the single time point approach demonstrated in Figures 4 and 5A.
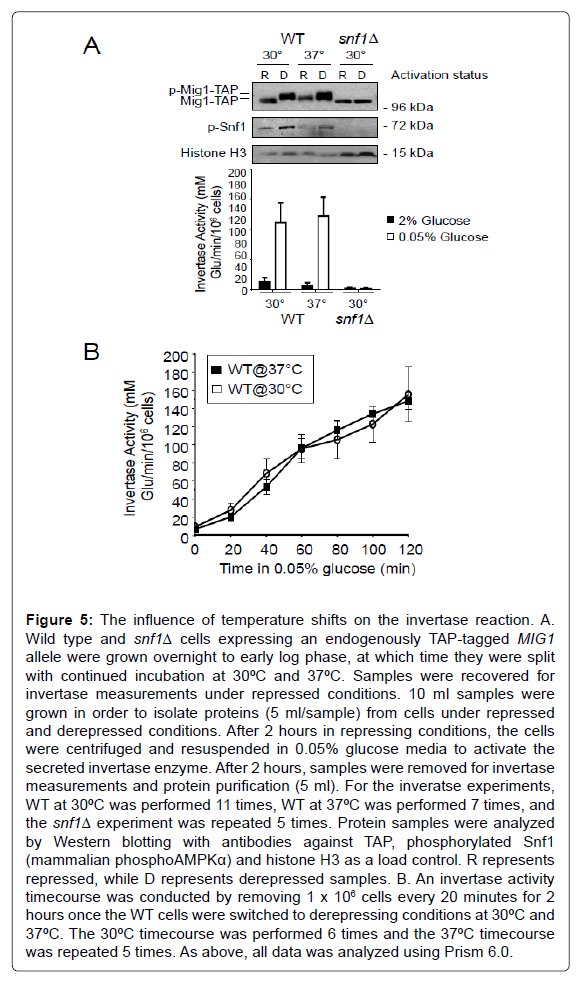
Figure 5: The influence of temperature shifts on the invertase reaction. A. Wild type and snf1Δ cells expressing an endogenously TAP-tagged MIG1 allele were grown overnight to early log phase, at which time they were split with continued incubation at 30ºC and 37ºC. Samples were recovered for invertase measurements under repressed conditions. 10 ml samples were grown in order to isolate proteins (5 ml/sample) from cells under repressed and derepressed conditions. After 2 hours in repressing conditions, the cells were centrifuged and resuspended in 0.05% glucose media to activate the secreted invertase enzyme. After 2 hours, samples were removed for invertase measurements and protein purification (5 ml). For the inveratse experiments, WT at 30ºC was performed 11 times, WT at 37ºC was performed 7 times, and the snf1Δ experiment was repeated 5 times. Protein samples were analyzed by Western blotting with antibodies against TAP, phosphorylated Snf1 (mammalian phosphoAMPKα) and histone H3 as a load control. R represents repressed, while D represents derepressed samples. B. An invertase activity timecourse was conducted by removing 1 x 10⁶ cells every 20 minutes for 2 hours once the WT cells were switched to derepressing conditions at 30ºC and 37ºC. The 30ºC timecourse was performed 6 times and the 37ºC timecourse was repeated 5 times. As above, all data was analyzed using Prism 6.0.
Several other parameters should also be considered when measuring invertase activation. For example, while using cells in early logarithmic growth ensures higher glucose concentrations for repressed conditions, cells in later stages of growth, such as stationary phase, have thicker cell walls which may retain the invertase enzyme and block access to its substrate [29]. It also appears that sugars that derepress SUC2 expression, such as inositol, may continue to do so even in the presence of concentrations of glucose (0.2%) that would normally repress its expression [30]. It was suggested that phosphatidylinositol (PI) may be involved in glucose derepression of secreted invertase activity. Furthermore, while it has been shown that deletion of MIG1 allows expression of SUC2 even in the presence of glucose, deletion of a gene encoding another transcription factor, GCR1 (Glycolysis Regulation), which binds to the SUC2 promoter, also renders SUC2 transcription unresponsive to glucose [31]. Thus, expression of SUC2 is regulated by a complex network of glucose responsive pathways.
This report describes a thorough step-by-step approach for determining activity of the invertase enzyme encoded by SUC2 within the yeast genome. There are few such reports available in the literature, thereby allowing a researcher new to the field to rapidly conduct this experiment and obtain reproducible values.
This work was supported by Natural Science and Engineering Research Council (NSERC) grants to TAAH and TGA, and a New Investigator infrastructure grant from the Canadian Foundation for Innovation (CFI) to TAAH. Liubov Lobanova is acknowledged for assistance with statistical analyses. The authors declare no conflicts of interest.