Journal of Geology & Geophysics
Open Access
ISSN: 2381-8719
ISSN: 2381-8719
Research Article - (2015) Volume 4, Issue 4
A preliminary estimate of the reserve of the marble deposit in Itobe area, central Nigeria was determined from both outcrop geological mapping and geophysical resistivity surveying. Two outcrops (designated as mass I and mass II) of the marble deposit occurring about 850 m apart along a NE–SW axis were identified. The areal extent, thickness and density of the marble have been used in computing the reserve of the marble deposit. The reserve of mass I is estimated at 1418.4 tons and that of mass II has been estimated at 142643.2 tons. The total reserve of the marble deposit is 144061.6 tons.
Keywords: Nigeria; Marble; Deposit; Mass
Marble, a major raw material for industries, is a crystalline, non-foliated metamorphic rock formed from the metamorphism of limestone (a carbonate sedimentary rock formed at the bottom of lakes and seas). The Itobe marble deposit is located about 1 km from Itobe town along the Ajaokuta-Anyigba road, Kogi State, central Nigeria. The study area lies between longitudes 6°40’ E and 6°48’E and latitudes 7°22’N and 7°30’ N (Figure 1).
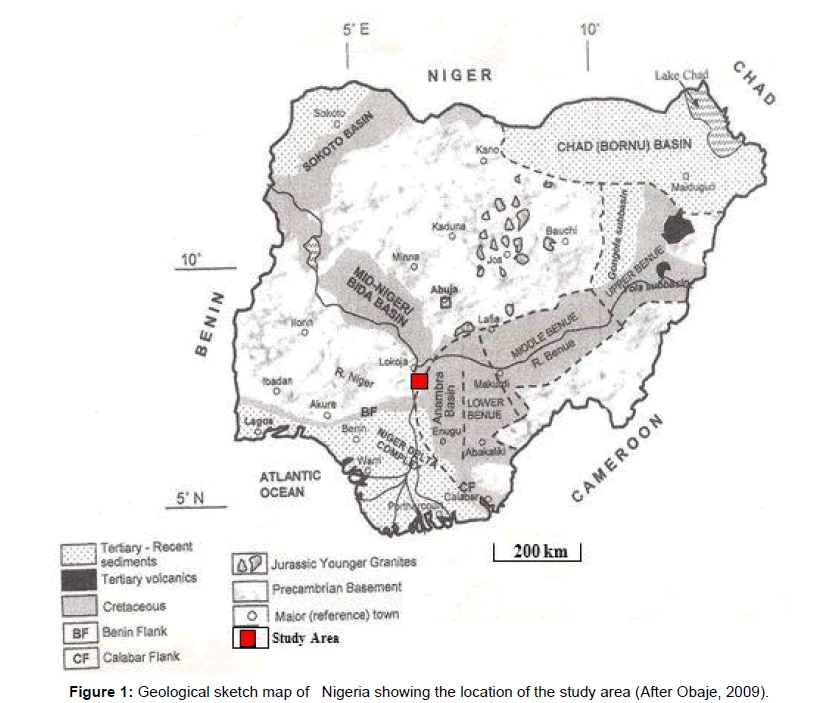
Figure 1: Geological sketch map of Nigeria showing the location of the study area (After Obaje, 2009).
The industrial uses of a marble deposit are determined largely by its chemical composition and the reserve of the deposit. Geological and geophysical investigation methods have been employed in the exploration of marble deposits. The electrical resistivity method of geophysical prospecting in particular has been employed to delineate the areal extent and thickness of marble deposits. The choice of the resistivity method was informed by the local resistivity contrast characteristics of marble deposits (102-2.5 × 10⁸ Ωm) compared to the immediate host rocks of schists (20-104 Ωm) and quartzites (10-2× 10⁸ Ωm) [1-4]. This study aims at estimating the reserve of the marble deposit in Itobe from both outcrop geological studies and geophysical resistivity investigations.
The marble deposit in Itobe is associated with crystalline rocks of the Precambrian Basement Complex. The marble deposit occurs within a host rock of quartz-mica schist and feldspathic quartzite. Two outcrops (designated as mass I and mass II) of the marble deposit have been identified in the study area (Figure 2). Mass I with a surface area of 0.84 m2, trends NE-SW with a strike azimuth of 033°. It is poorly exposed near Alo village, along the Anyigba-Itobe road. It is light grey in color and fine grained in texture. Mass II, which is about 800 meters from mass I on a NE-SW axis, is a much larger deposit, and outcrops on the Ayanka hill as massive boulders. It is medium grained in texture, dark grey in color and has an elevation of 132 m at the bottom and 138 m at the top. It has a sharp contact with the quartzmica schist to the east and the Feld spathic quartzite to the west.
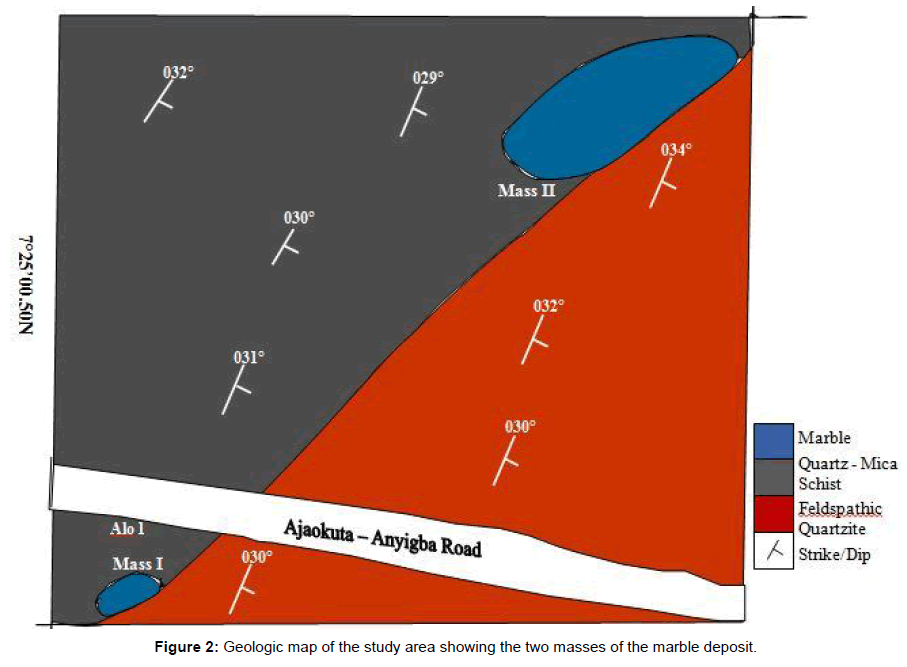
Figure 2: Geologic map of the study area showing the two masses of the marble deposit.
The lateral extent and thickness of the marble deposit was obtained both from outcrop geological and geophysical resistivity surveys. The Etrex Global Positioning System was used to measure the elevations at the bottom and top of the outcropping marble. The Vertical Electrical Sounding (VES) method using the Schlumberger configuration was employed to determine the thickness of the marble deposit. The horizontal profiling method using the Wenner configuration was employed to determine the lateral extent of the marble deposit (Figures 3 and 4).
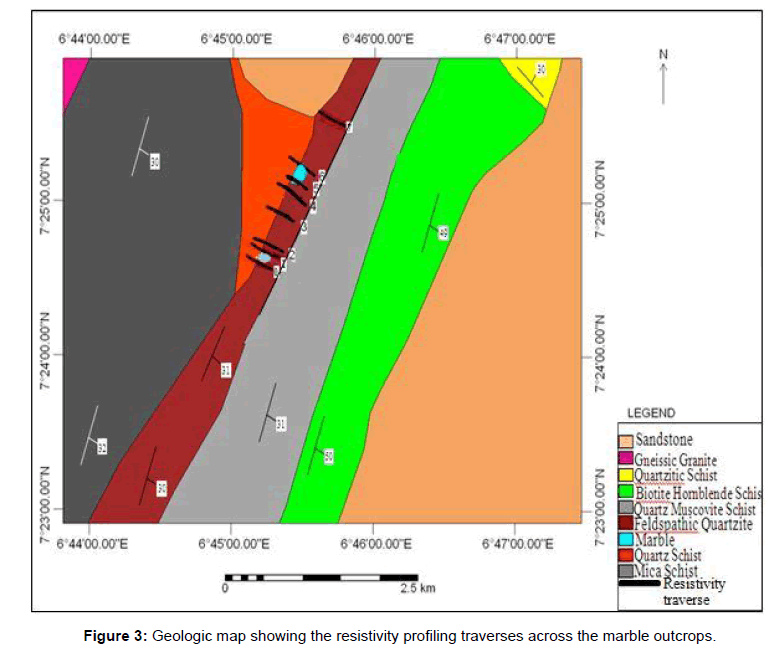
Figure 3: Geologic map showing the resistivity profiling traverses across the marble outcrops.
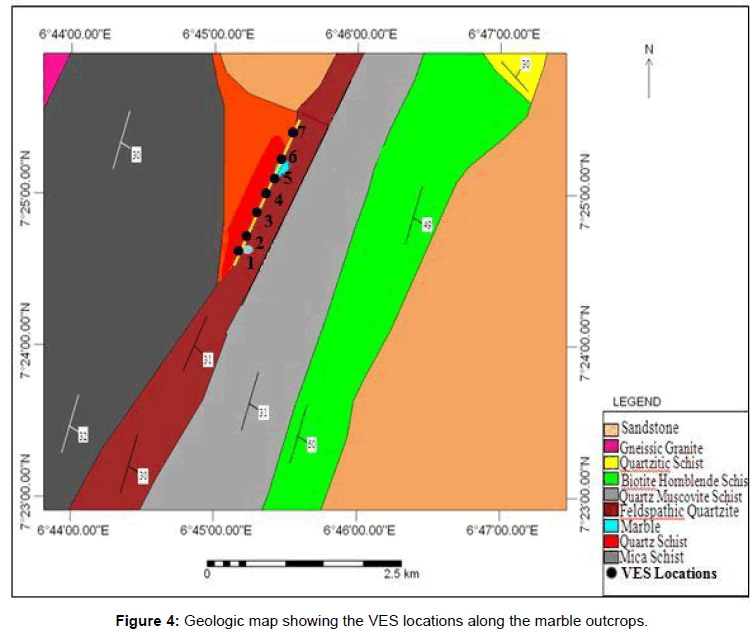
Figure 4: Geologic map showing the VES locations along the marble outcrops.
The density of the marble was determined by weighing a fresh and clean sample of the marble rock using a Top Weighing Balance, and the mass was noted. A well calibrated beaker was filled with water to a certain mark and the mark noted. The marble sample was lowered into the beaker containing water using a thin thread. The change in the volume of the water in the beaker, which is equal to the volume of the marble sample, was noted. The density of the marble sample was obtained by dividing the mass of the marble sample by the change in the volume of the water on immersion of the marble sample.
The estimated total reserve of the marble deposit was determined by adding the reserves of the individual masses (masses I and II). The reserve of each mass of the marble deposit has been computed using the block method [5]. The surface extent of mass I and mass II (Figures 5 and 6) were subdivided into blocks of regular geometries (rectangular block of 0.072 cm × 0.096 cm) and then summing up the area of the entire blocks. The reserve of each mass of the marble deposit is obtained as follows:
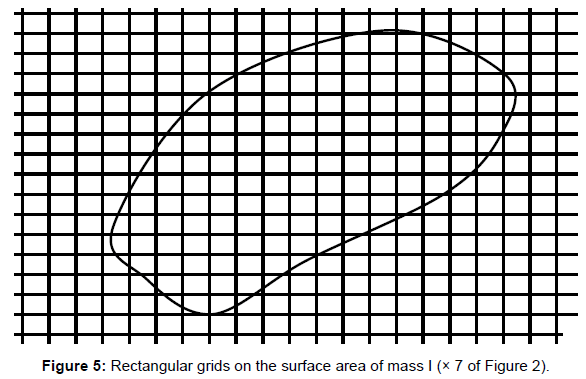
Figure 5: Rectangular grids on the surface area of mass I (× 7 of Figure 2).
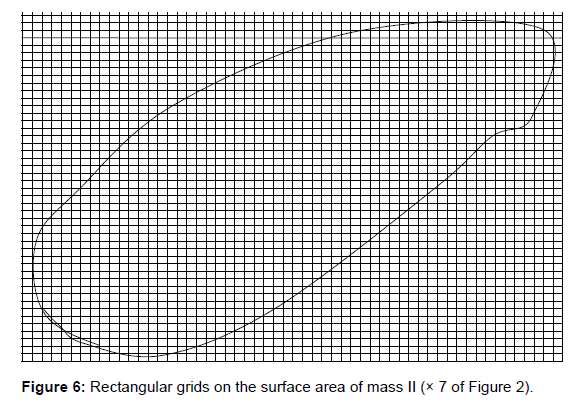
Figure 6: Rectangular grids on the surface area of mass II (× 7 of Figure 2).
Area of the marble outcrop (m2) × thickness of the marble outcrop (m) × the density of the marble (kg/m3)
The apparent resistivity data for the seven horizontal profiles carried out across the marble deposit in Itobe are presented in Table 1 below. The interpretation of the resistivity profiles is qualitative, and it involves identifying signatures characteristic of the marble. Figure 7 shows a correlation of the resistivity profiles along the seven traverses. The outcropping marble along traverses 5 and 6 is characterized by a relatively high resistivity (500-600 Ωm) in a background of low resistivity (6-250 Ωm) characteristic of the host rocks (mica schist and quartz mica schist). Similar geophysical patterns were observed over marble deposits in Igarra area of southwestern Nigeria [2,3]. The interpretation of the resistivity profiles across the marble deposit in Itobe using the above characteristic shows that there is no continuity between masses I and II of the marble deposit. The marble deposit in Itobe shows a NE-SW trend.
| Station Number (Si) |
Apparent Resistivity, (Ωm) Profile 1 |
Apparent Resistivity (Ωm) Profile 2 |
Apparent Resistivity (Ωm) Profile 3 |
Apparent Resistivity (Ωm) Profile 4 |
Apparent Resistivity (Ωm) Profile 5 |
Apparent Resistivity (Ωm) Profile 6 |
Apparent Resistivity (Ωm) Profile 7 |
|---|---|---|---|---|---|---|---|
| S1 | 46.70 | 7.61 | 14.61 | 6.91 | 7.23 | 6.60 | 49.47 |
| S2 | 39.10 | 13.51 | 5.94 | 5.66 | 7.23 | 5.66 | 41.49 |
| S3 | 84.92 | 16.69 | 8.01 | 3.46 | 8.17 | 3.46 | 64.18 |
| S4 | 98.44 | 15.65 | 17.63 | 2.51 | 13.83 | 7.23 | 58.08 |
| S5 | 55.76 | 16.22 | 18.26 | 6.91 | 25.14 | 7.54 | 65.37 |
| S6 | 55.19 | 21.66 | 21.69 | 4.71 | 25.46 | 503.0 | 13.39 |
| S7 | 22.88 | 27.85 | 25.14 | 4.71 | 506.0 | 524.0 | 17.92 |
| S8 | 35.20 | 28.73 | 44.00 | 4.71 | 518.6 | 530.0 | 17.85 |
| S9 | 60.22 | 22.32 | 19.80 | 25.14 | 512.3 | 20.12 | 33.32 |
| S10 | 60.22 | 23.57 | 24.83 | 25.14 | 24.83 | 23.26 | 23.70 |
| S11 | 85.43 | 24.20 | 24.20 | 25.14 | 25.14 | 23.89 | 24.70 |
| S12 | 94.42 | 30.49 | 24.83 | 25.46 | 25.14 | 25.41 | 20.24 |
| S13 | 96.18 | 30.80 | 30.49 | 25.77 | 25.46 | 30.17 | 98.06 |
| S14 | 37.72 | 30.49 | 31.12 | 29.23 | 30.80 | 30.49 | 38.34 |
| S15 | 38.34 | 30.80 | 32.37 | 30.49 | 31.12 | 30.49 | 40.23 |
| S16 | 40.23 | 30.49 | 31.12 | 30.80 | 31.12 | 30.49 | 23.26 |
| S17 | 22.63 | 30.17 | 31.74 | 30.80 | 31.43 | 30.80 | 22.00 |
| S18 | 16.34 | 43.69 | 30.80 | 31.74 | 30.80 | 30.49 | 19.49 |
| S19 | 23.26 | 43.37 | 30.49 | 31.12 | 31.12 | 30.49 | 23.89 |
| S20 | 20.12 | 47.46 | 44.32 | 30.80 | 30.49 | 30.80 | 20.12 |
Table 1: Horizontal resistivity profiling data in the study area.
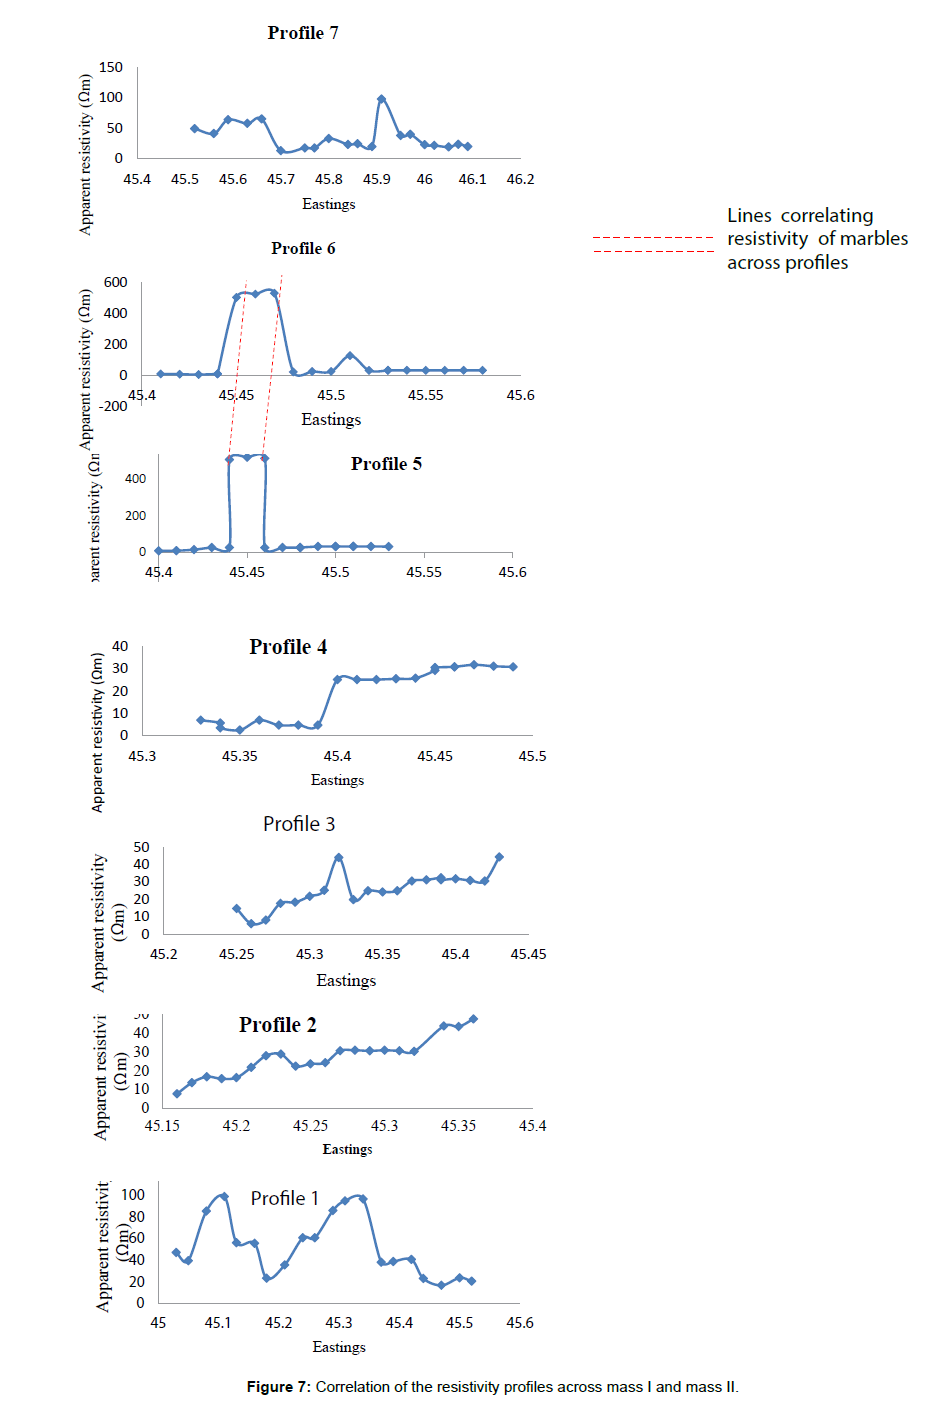
Figure 7: Correlation of the resistivity profiles across mass I and mass II.
`The resistivity sounding data obtained for eight vertical electrical sounding surveys carried out along the trend of the marble deposit are presented in Table 2, and the corresponding resistivity sounding curves are shown in Figures 8-15. The interpretation of the VES data involves the determination of the geoelectric layer parameters (resistivity and thickness) of the marble and the surrounding rocks (Table 3).
| AB/2 (m ) |
Apparent resistivity(Ωm) | AB/2 (m ) | Apparent resistivity(Ωm) | ||||||
|---|---|---|---|---|---|---|---|---|---|
| VES 1 Elevation =116 m |
VES 2 Elevaton=114m |
VES 3 Elevation=113 m | VES 4 Elevation =112 m |
VES 5 Elevation =117 m |
VES 6 Elevation = 118 m |
VES 7 Elevation =114 m |
VES 8 Elevation = 112 m |
||
| 1.0 | 1185 | 380 | 340 | 1100 | 1776 | 1.1 | 61 | 110 | 105 |
| 1.3 | 1000 | 300 | 284 | 985 | 1544 | 1.6 | 69 | 95 | 93 |
| 1.8 | 642 | 160 | 147 | 778 | 1154 | 2.3 | 80 | 78 | 75 |
| 2.4 | 398 | 130 | 95 | 700 | 822 | 3.4 | 99 | 70 | 60 |
| 3.2 | 177 | 96 | 80 | 589 | 570 | 5.0 | 105 | 80 | 50 |
| 4.2 | 100 | 81 | 70 | 486 | 389 | 7.3 | 119 | 05 | 60 |
| 5.6 | 77 | 43 | 61 | 403 | 324 | 10.7 | 122 | 142 | 69 |
| 7.5 | 67 | 70 | 61 | 274 | 263 | 15.8 | 130 | 180 | 85 |
| 10.0 | 74 | 75 | 69 | 184 | 260 | 3.2 | 150 | 250 | 120 |
| 13.3 | 84 | 85 | 75 | 132 | 285 | 4.1 | 190 | 320 | 170 |
| 18.0 | 81 | 90 | 120 | 300 | 0.0 | 255 | 400 | 240 | |
| 24.0 | 97 | 98 | 130 | 330 | 3.5 | 340 | 00 | 340 | |
| 32.0 | 110 | 150 | 340 | ||||||
Table 2: Vertical electrical sounding data in the study area.
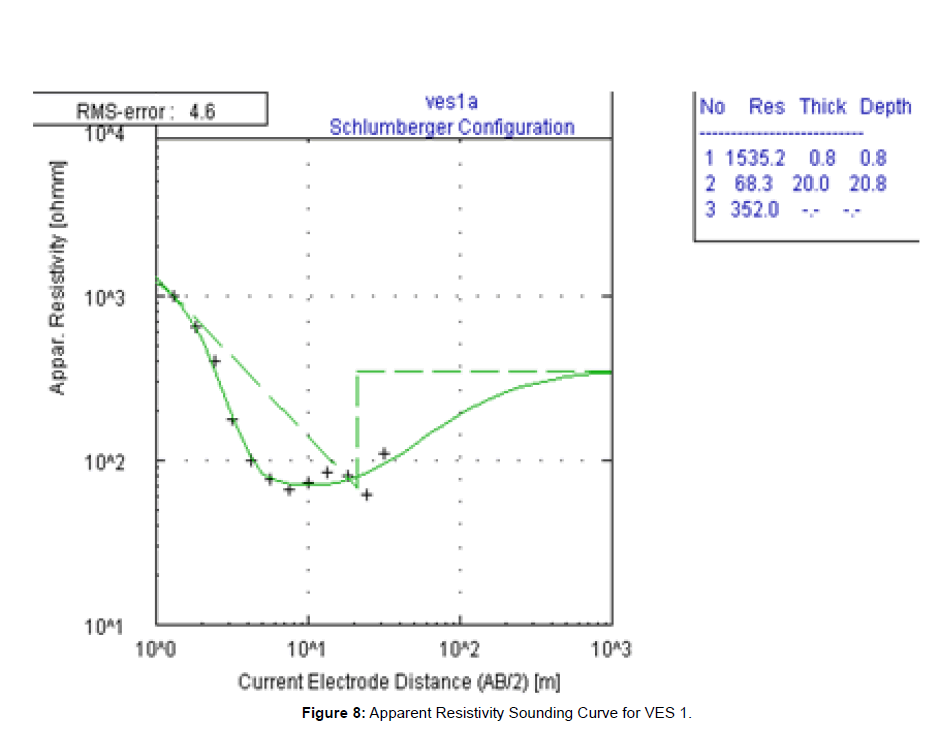
Figure 8: Apparent Resistivity Sounding Curve for VES 1.
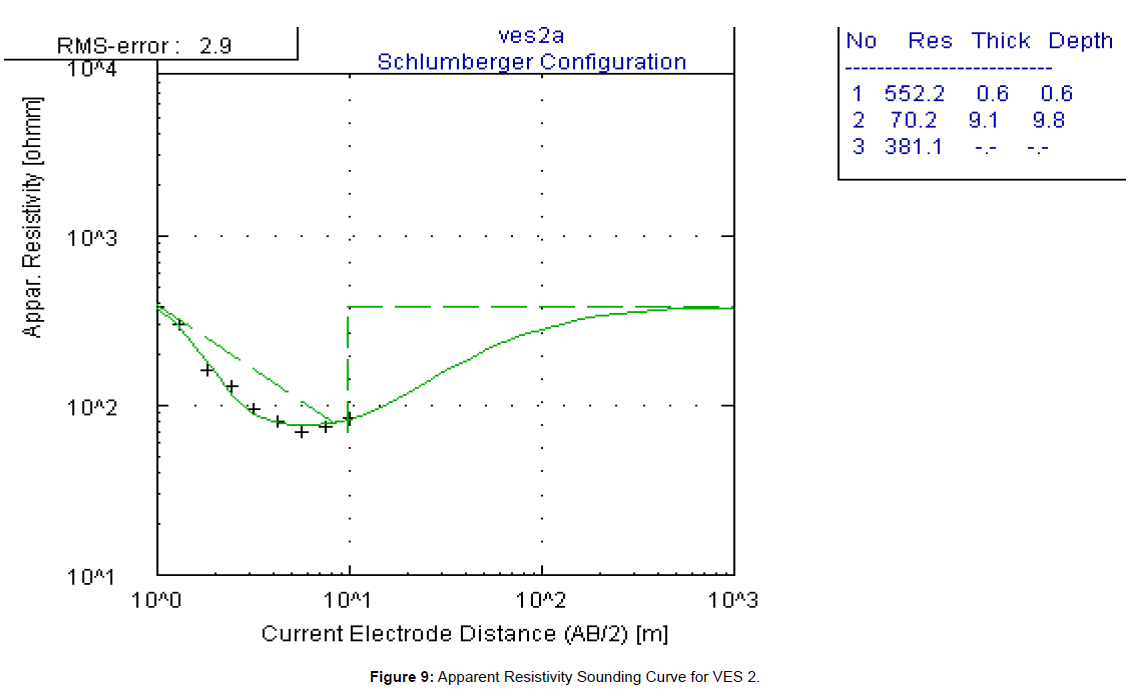
Figure 9: Apparent Resistivity Sounding Curve for VES 2.
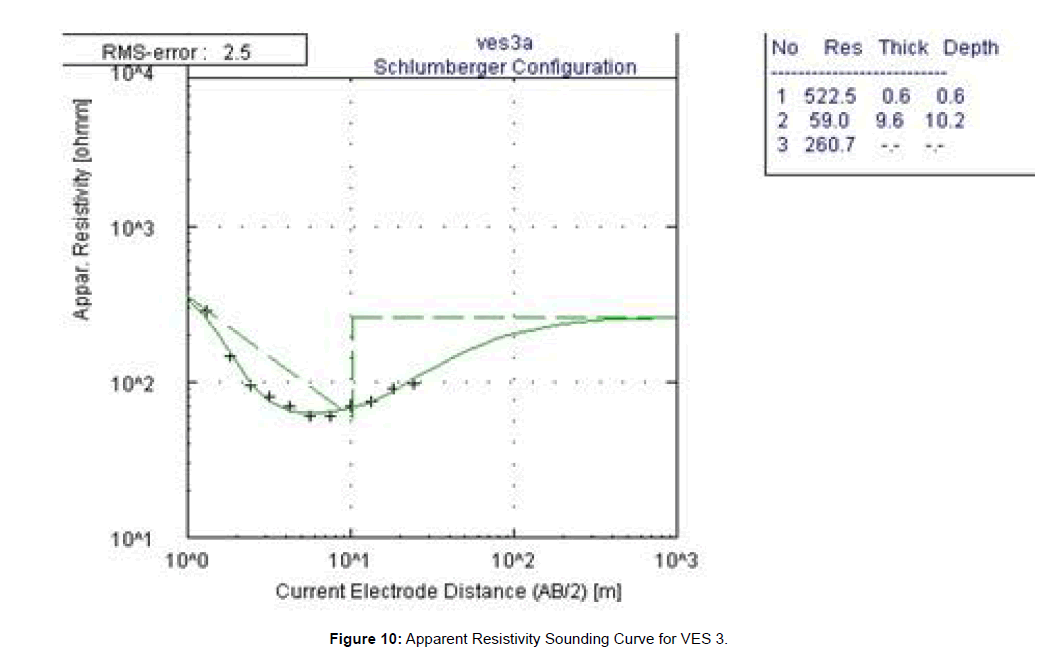
Figure 10: Apparent Resistivity Sounding Curve for VES 3.
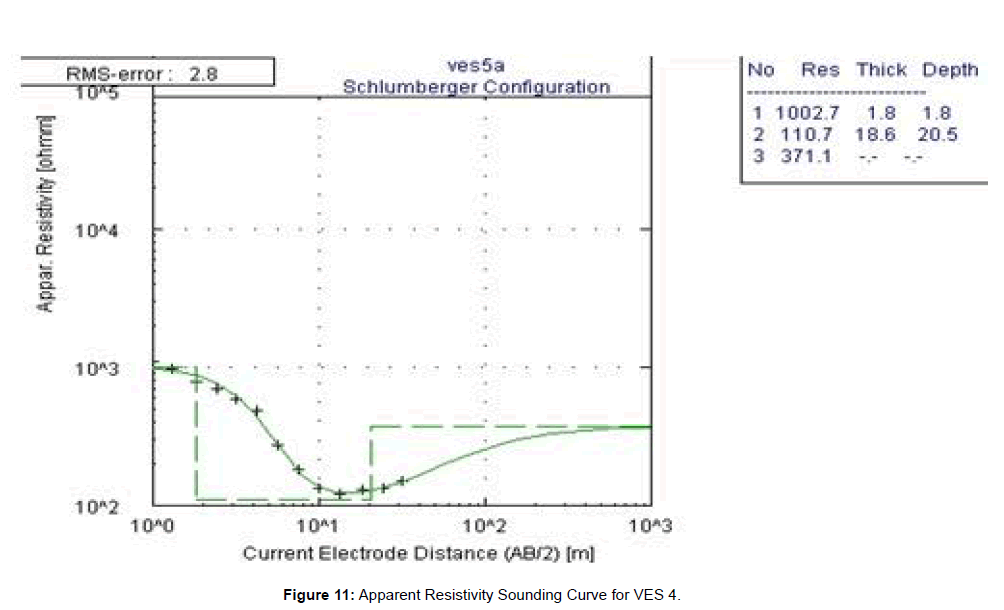
Figure 11: Apparent Resistivity Sounding Curve for VES 4.
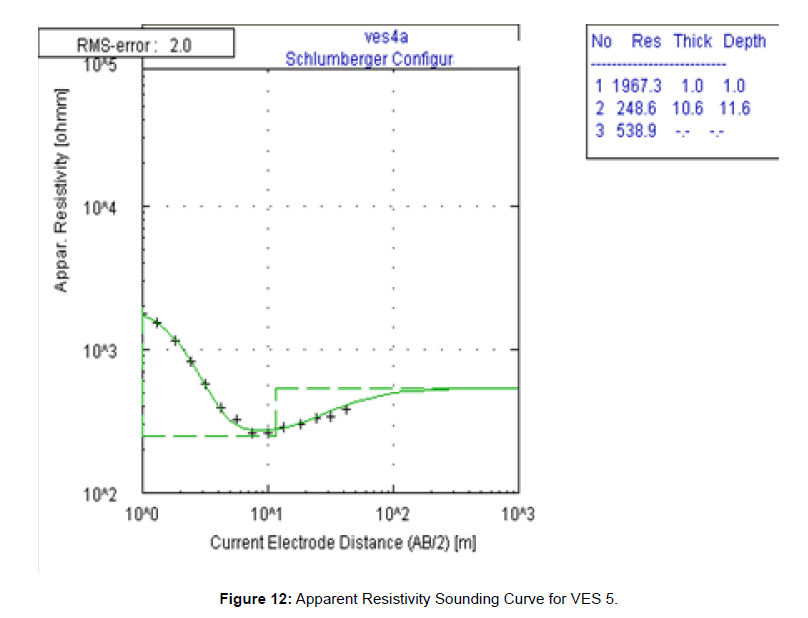
Figure 12: Apparent Resistivity Sounding Curve for VES 5.
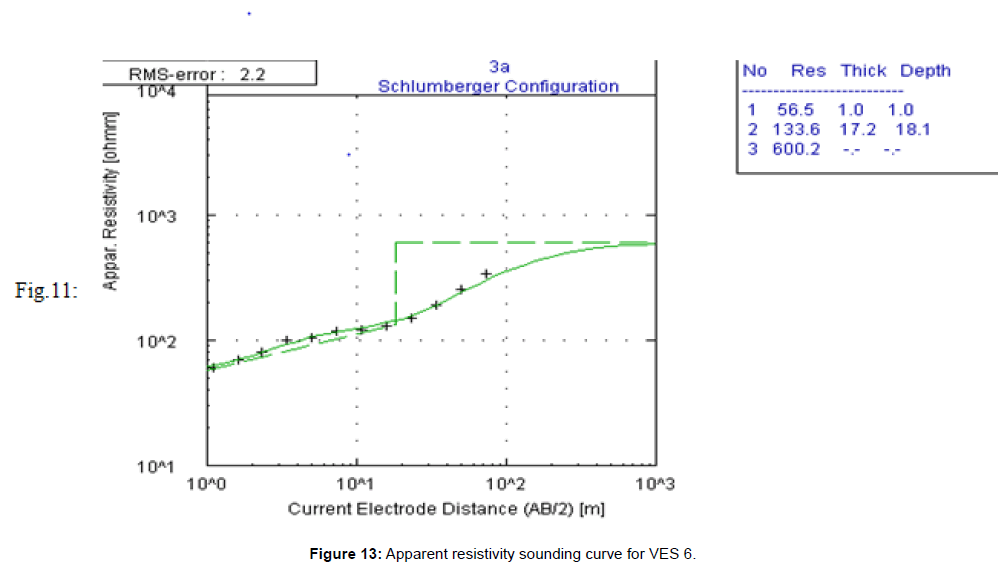
Figure 13: Apparent resistivity sounding curve for VES 6.
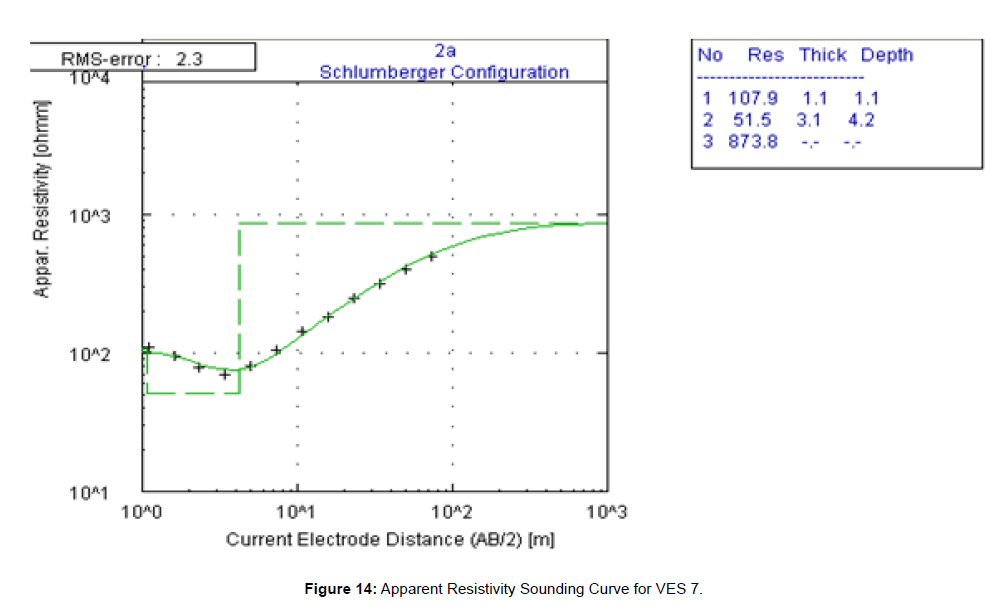
Figure 14: Apparent Resistivity Sounding Curve for VES 7.
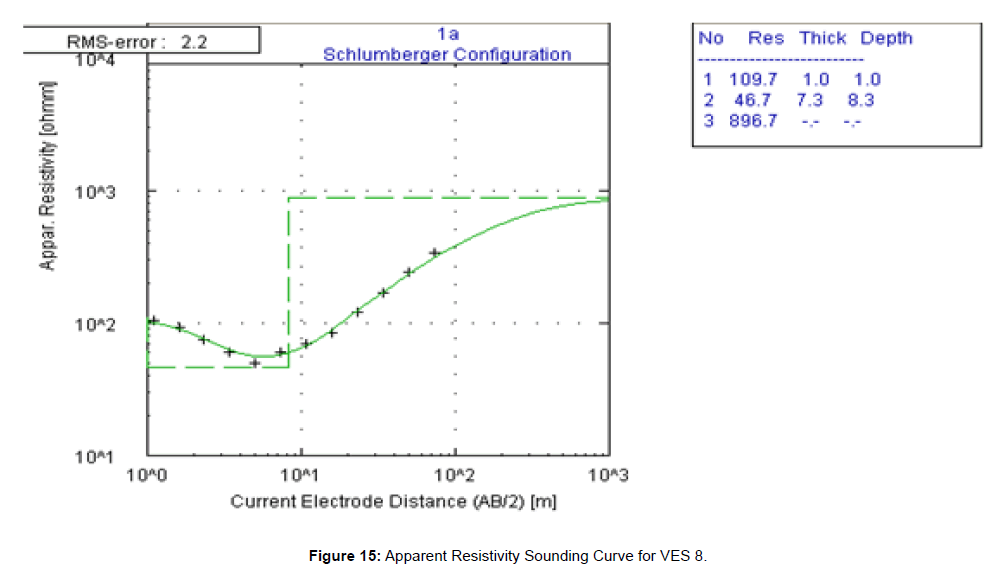
Figure 15: Apparent Resistivity Sounding Curve for VES 8.
| VES Location | RMS Errors | Layer Resistivity (Ωm) |
Layer Thickness (m) |
Depth to layer (m) |
||||||
|---|---|---|---|---|---|---|---|---|---|---|
| 1 | 2 | 3 | 1 | 2 | 3 | 1 | 2 | 3 | ||
| VES 1 | 4.6 | 1535.2 | 68.3 | 352.0 | 0.8 | 20.0 | | 0.8 | 20.8 | |
| VES 2 | 2.9 | 552.2 | 70.2 | 381.1 | 0.6 | 9.1 | | 0.6 | 9.8 | |
| VES 3 | 2.5 | 522.5 | 59.0 | 260.7 | 0.6 | 9.6 | | 0.6 | 10.2 | |
| VES 4 | 2.8 | 1002.7 | 110.7 | 371.1 | 1.8 | 18.6 | | 1.8 | 20.5 | |
| VES 5 | 2.0 | 1967.3 | 248.6 | 538.9 | 1.0 | 10.6 | | 1.0 | 11.6 | |
| VES 6 | 2.2 | 56.5 | 133.6 | 600 | 1.0 | 17.2 | - | 1.0 | 18.1 | |
| VES 7 | 2.3 | 107.9 | 51.5 | 873.8 | 1.1 | 3.1 | | 1.1 | 4.2 | - |
| VES 8 | 2.2 | 109.7 | 46.7 | 896.7 | 1.0 | 7.3 | | 1.0 | 8.3 | |
Table 3: Geoelectric layer parameters (resistivities, thicknesses and depth) in the study area.
The resistivity value for marble in the study area (obtained from the outcropping marble at VES 2 location), varies from 520 to 555 Ωm, depending on water content and porosity.
Three geoelectric layers have been recognized within the subsurface of the VES sounding locations. The geoelectric parameters of the resistivity sounding survey (Table 3) shows a thickness of 0.6 m for the outcropping marble (mass I) at VES 2 location. This marble unit is suspected to extend to VES 3 as shown by the resistivity values of the first geoelectric layer (552-523 Ωm) between VES 2 and VES 3 locations. This marble unit is underlain by a second geoelectric layer interpreted as mica schist with a resistivity ranging from 7050 Ωm, and a thickness ranging from 9.2-9.6 m. The third geoelectric layert, with a resistivity value ranging from 381-261 Ωm, is a highly weathered Basement rock. VES locations 5 and 6, in close contact with the outcropping marble in mass II is a lateritic layer with a resistivity of 1003 1967 Ωm and a thickness ranging from 1.0-1.8 m. It is underlain by a quartz-mica schist layer with resistivity values in the range (249-134 Ωm) and a thickness ranging from 10.617.2 m. Underlying the quartz-mica schist is the weathered Basement rock with a layer resistivity ranging from 539-630 Ωm. This is a more competent layer than that below mass I.
The average density value for the two marble outcrops in the study area is presented in Table 4.
| Sample Number | Mass I (kg/m3) | Mass II (kg/m3) |
|---|---|---|
| 1 | 2610 | 2430 |
| 2 | 2620 | 2470 |
| 3 | 2640 | 2550 |
| 4 | 2660 | 2580 |
| 5 | 2660 | 2450 |
| 6 | 2670 | 2440 |
| 7 | 2665 | 2560 |
| 8 | 2670 | 2490 |
| 9 | 2650 | 2570 |
| 10 | 2658 | 2575 |
| Mean | 2650.3 | 2511.5 |
| Standard Deviation | 20.8 | 61.2 |
Table 4: Density of the marble samples.
(i) Calculation of reserve of marble in mass I:
Area of mass I=Area of triangle + Area of rectangle
= 0.089856 m2+ 0.801792 m2
=0.891648 m2
Thickness of mass I=0.6 m
Density of the marble=2650.3 kg/m3
Reserve of mass I=0.892 m2 × 0.6 m × 2650.3 kg/m3=1418.4 tons
(ii) Calculation of reserve of marble in mass II:
Area of mass I=Area of triangle + Area of rectangle
=0.390528 m2 + 9.075456 m2
=9.465984 m2
Area of mass II=9.466 m2
Thickness of mass II=6.0 m
Density of the marble=2511.5 kg/m3
Reserve of ass II=9.466 m2 × 6 m × 2511.5 kg/m3=142643.2 tons
(iii) Total reserve of the marble in Itobe=reserve of mass I + reserve of mass II
=1418.4 tons + 142643.2 tons
=144061.6 tons
Field geological and geophysical investigations of the marble deposit in Itobe area, Kogi State, central Nigeria reveals the occurrence of two separate marble outcrops ( mass I and mass II) occurring 800 m apart along a NE–SW trend. The estimated reserve of the marble in mass I is 1418.4 tons and the estimated reserve of marble in mass II is 142643.2 tons. The total reserve of the marble deposit in Itobe is 144061.6 tons.