Chemotherapy: Open Access
Open Access
ISSN: 2167-7700
ISSN: 2167-7700
Research Article - (2025)Volume 12, Issue 4
One of the world's deadliest diseases is lung cancer. Based on a few features, machine learning techniques can help in the diagnosis of lung cancer. The performance of several classifiers: Support Vector Machine (SVM), Logistic Regression (LR), Naïve Bayes (NB), Random Forest (RF), and K Nearest Neighbor (KNN), was evaluated by the authors using the dataset available on Kaggle to create a systematic approach for the diagnosis of lung cancer disease based on readily observable signs and historical medical data without the requirement of CT scan images. The authors have proposed a novel approach for classification called PCWKNN, which is a modified version of KNN and uses Pearson correlation coefficient values to determine weights in a weighted KNN. The performance of the classifiers was evaluated using the hold-out validation method. SVM, LR, and RF were 96.77% accurate. NB obtained 95.16% accuracy. KNN achieved 91.93% accuracy. PCWKNN outperformed the employed classifiers and obtained an accuracy of 98.39%.
Lung cancer; Machine learning; PCWKNN; SVM; LR; NB; RF; KNN
The primary respiratory organs are the lungs. A lung is situated on both sides of the chest in the human body. The chest moves up and down as we breathe. That is because the lungs expand during intake and contract during exhale. Lungs carry out the process of adding oxygen to the blood. Blood high in carbon dioxide and poor in oxygen is delivered to the heart from the lungs. In the process of being "cleaned," the blood in the lungs takes in oxygen and excretes carbon dioxide. While inhaling allows oxygen to enter the lungs, exhaling removes carbon dioxide [1-3]. A tumor is a group of diseases that includes irregular cell growth and can expand to different areas within the body. However, not all tumors can cause cancer. A lung tumor may start anywhere in the lungs. It can harm any part of a person's respiratory system. It frequently takes a while for it to develop. Lung cancer, which affects the breathing system, is among the deadliest cancers identified. Most lung disease sufferers belong to the age group of 55 to 65 [4]. Nineteen types of cancers, including lung cancer, which has the highest fatality rate, can attack a healthy person. Lung cancer claims the lives of more than 1.7 million people annually [5]. According to the rate of death index, it accounts for 1.5% of all deaths worldwide and is ranked 7th [6,7].
Lung cancer starts inside the lungs, main airways, or windpipe. It can spread if it is not detected in its early stages. People who have any lung illness, such as emphysema, or who also have any chest illness or chest pain are more prone to lung cancer. The biggest risk concerns related to lung cancer for Indian men are excessive smoking or usage of beedis, tobacco, and cigarettes, which are also among the primary reasons for this cancer forming inside a man's body. These reasons are not as common among women, and so raises the possibility that there are other lung cancer risk concerns, such as susceptibility to radon gas and pollutants in the environment [8].
It is quite typical to diagnose lung cancer at its early stages because of no specific symptoms and is usually diagnosed at the advanced stage of patients [9,10]. A late diagnosis might result in cancer rapidly spreading to other body organs and becoming lifethreatening. According to studies, only 16% cases of lung cancer are detected at an early stage. Only 4% of late-diagnosed cases survive for five years [11].
Despite the convenience of cutting-edge medical facilities for efficient diagnosis and healing treatment, the death rate remains not entirely under control. As a result, it is essential to start taking preventative measures right away to ensure that the cancer's signs and consequences can be recognized quickly for accurate diagnosis [6]. The motivation behind this research is to help clinicians identify lung cancer in its earliest stages using readily observable symptoms and historical medical data without the need for CT scan images.
Supervised machine learning techniques are used to categorize diseases [12,13]. Using a predetermined dataset, researchers train the computer using supervised machine learning methods. They then use test data to evaluate how accurate the model is. This research paper proposes an approach for diagnosing lung cancer illness using algorithms for machine learning. Implementation was written in python to evaluate the method. The method was evaluated by the authors using the lung cancer data set from Kaggle. The technique has been put forth to improve upon the accuracy of current diagnostic techniques without the using CT scan pictures and based on easy-to-observe symptoms and medical history of the patient.
The offered research work's main contributions are as follows:
• The authors presented a novel classification method, called PCWKNN, in which weights in a weighted KNN have been determined by Pearson correlation coefficient values.
• Performance of standard classifiers: SVM, LR, NB, RF and KNN has been evaluated for lung cancer disease diagnosis.
• The efficiency of the suggested method for lung cancer disease diagnosis has been evaluated and compared to that of other employed classification methods.
The remaining part of the paper is organized as discussed below. The pertinent studies conducted by earlier researchers are described in section 2 of the paper. Section 3 introduces the materials and research methodologies are introduced in. The results are discussed in section 4. Conclusion and future perspectives are included in section 5.
The research of other researchers with a similar work is shown below. The researchers provided several studies for lung cancer classification based on their results.
Mezher et al. [9] have presented the SVM based on the Genetic Folding (GF) technique for classifying lung cancer. For the experiments, the authors employed the Kaggle-available dataset on lung cancer with its 15 prediction variables. The authors used the lung cancer dataset with 15 prediction attributes available on Kaggle for experiments. In the preprocessing stage, balancing was applied to the dataset. The authors obtained an accuracy of 96.2% using the GF technique.
Dritsas and Trigka [3] applied different machine learning algorithms on Kaggle-available dataset on lung cancer. The authors used Bayesian Network, NB, LR, SVM, J48, Random tree, RF, Rotation Forest model (RotF), AdboostM1, KNN, and multilayer perceptron classifiers on the dataset. Accuracy, AUC, precision, F-Measure, and recall metrics were used as performance criteria of classifiers. SMOTE technique was applied to balance the dataset. The authors concluded that RotF with RF as the base classifier performed best with 97.1% accuracy.
Dutta [14] used two datasets of CT scan images. The first dataset with 3754 images of 47 patients was used to diagnose lung cancer. The second dataset with 50 CT scan images of the whole lung was used to recognize benign types. The authors employed three classifiers: RF, NB, and SVM. For the first dataset used for diagnosing lung cancer, the authors obtained 94.6% accuracy uisng NB, whereas SVM and RF gave an accuracy of 90.9% and 92.3%. SVM provided the highest accuracy, i.e., 94.6% for the second dataset, whereas NB and RF provided 93.6% and 94.2% accuracy.
Jaiswal et al. [15] have identified lung cancer using LR, NB, DT, KNN, and SVM. The authors attained 94.59% as the highest accuracy using the dataset on lung cancer taken from the UCI repository. Accuracy utilizing LR, NB, DT, SVM, and KNN, respectively, was 94.59%, 87.78%, 81.08%, 89.18%, and 88.28%.
Asuntha et al. [16] applied SVM classifier and optimization techniques to detect the lung cancer. The dataset containing 6 CT images along with 15 MRI pictures of the lungs was used by the authors. The images were of 512X512 dimensions. Image pre-processing, enhancement of image, extracting feature, identifying lung cancer cells, and result diagnosis were the stages followed by the authors for the experiments. The authors achieved 89.5% accuracy.
Manju et al. [17] predicted lung cancer using the SVM classifier. The authors used the UCI available dataset on lung cancer. The dataset had 600 instances in a total of malignant, pre-malignant, and benign cases. For the purpose of lowering the dimensions of the data, the authors used the principal component analysis method. SVM provided an accuracy of 87%.
Shanthi and Rajkumar [18] used lung CT scan histopathological images to classify lung cancer. After identifying attributes from the dataset images, the authors utilized feature selection. They used the DT, neural network, and NB for classification and suggested a modified stochastic diffusion search algorithm for feature reduction. The authors discovered that the proposed method for feature reduction increases the accuracy of classifiers.
Alsinglawi et al. [19] have presented a study that shows how effective machine learning can predict the duration of stay in ICU hospitalization for patients with lung cancer. Due to the significant class imbalance of clinical patient record data, which presents a challenge to the predictive analysis task, the authors have examined appropriate class balancing strategies. The authors concluded that among the tested machine learning approaches, class balancing strategies, and feature selection techniques, the ensembled RF classification model demonstrated its ability to perform well under various feature selection methods.
Pradeep and Naveen [20] have used NB, SVM, and C4.5 classifiers to detect patient survival. The ORANGE tool was employed by the authors during installation. ORANGE tool is a graphical tool for data analysis with workflow support. This platform enables users to create workflows for performing data analysis. Using precision, AUC, and accuracy parameters on various training datasets with sizes in the range from 100 to 2200, the authors assessed the performance of the classifiers. They observed that C4.5 performed better than all the other classifiers on increasing the dataset's size.
Pradhan and Manaswini presented a hybrid machine learning classifier for an early lung nodule diagnosis model for CT scans and achieved 96.39% accuracy, 95.25% sensitivity, 96.12% specificity, and 96.05% AUC.
Tuncal et al., performed lung cancer diagnosis differently for men and women by utilizing data from World Health Organization gathered from 10 nations over 42 years. The authors used Backpropagation Learning Algorithm, Long-Short Term Memory Network, and Support Vector Regression (SVR). The authors discovered that SVR outperformed other algorithms.
Delzel et al., investigated the accuracy and low false positive rate of different classifiers in determining the state of nodules associated with lung cancer. The scientists used information from 200 patients' CT scans of lung nodules to determine whether or not each nodule was cancerous or benign. They employed 416 quantified imaging markers for this. They utilized a variety of feature selection techniques coupled with nonlinear, linear, and ensemble methods for classification. The authors used the partial least squares model, Elastic Net, LR, and LR with step AIC as linear approaches for classification. Neural Networks, KNN, and three types of Support Vector Machines (SVM), including the linear, polynomial, and radial kernels, are the nonlinear methods utilized for classification. The most effective method was a correlation-based mix of SVM and Elastic net. The authors found that the optimum diagnostic technique for identifying lung cancers is the combination of radiomic biomarkers and machine learning classifiers. The benefits of such a method include accurate classification and a low false positive rate.
Patra has applied machine learning to the lung cancer data available at the UCI repository to classify lung cancer. The author has employed various machine learning classifiers: Perceptron, NB, DT, LR, KNN, Radial Basis Function network (RBF), and SVM. The authors concluded that RBF performed best among the applied classifiers and gave an accuracy of 81.25%.
Hussein et al., presented the 3D Convolutional Neural Network (CNN) and unsupervised classification using SVM on the lung nodules dataset to accurately categorize benign and malignant cases. The authors obtained the highest accuracy of 91.26% using 3D CNN with multitask learning.
Makaju et al., worked on predicting lung cancer by using CT scans. The authors proposed a model with stages of image preprocessing, image segmentation, extracting feature, and classification. The authors implemented the model on images available at Lung Image Database Consortium. The authors used SVM for classification and obtained 92% accuracy.
The majority of research has been done on the use of CT scan pictures to predict lung cancer. Because of asymptomatic nature of initial lung cancer especially if exposed to repetitive radiation exposure and the expensive cost of CT scans, early-stage diagnosis is quite difficult. A model is required so that people will be able to make the initial decision and take preventative measures without the use of the CT scan procedure with the aid of the model to forecast lung cancer based on readily visible signs and past medical information. The authors of this study have put out a model for early lung cancer prediction without the requirement of CT scan pictures.
Dataset
The authors performed the experiments using the Kaggleavailable dataset on lung cancer. The dataset has 15 prediction features and one class attribute. There are two values for the class attribute: Yes and No. The value ‘Yes’ stands for the existence of lung cancer and the value ‘No’ stands for the absence of lung malignance. The dataset has 309 instances. Table 1 displays the prediction features of the lung cancer dataset.
| S. no | Feature |
|---|---|
| 1 | Gender |
| 2 | Age |
| 3 | Smoking |
| 4 | Yellow fingers |
| 5 | Anxiety |
| 6 | Peer pressure |
| 7 | Chronic disease |
| 8 | Fatigue |
| 9 | Allergy |
| 10 | Wheezing |
| 11 | Alcohol consuming |
| 12 | Coughing |
| 13 | Shortness of breath |
| 14 | Swallowing difficulty |
| 15 | Chest pain |
Table 1: Lung cancer dataset’s features.
Classifiers
The authors have used the following six classifiers to categorize lung cancer disease:
Support Vector Machines (SVM): With SVM, every dataset item is represented as a single point on a surface with the count of coordinates the same as the count of attributes, and afterward, a hyperplane that separates the classes of the data item along its edges, is detected. Every coordinate represents a feature in the n-dimensional system.
Logistic Regression (LR): When a value needs to be forecasted that is categorical, LR is employed. It is a supervised classification technique that deals with classification issues. The researcher can calculate the likelihood that a subject falls into a specific class using logistic regression. For classification, the regression model is used. The key characteristics of LR include its ability to solve nonlinear problems, vulnerability to overfitting, ease of implementation, and computational efficiency.
Naïve Bayes (NB): It is built on the Bayes Theorem theory and makes no assumptions regarding the interdependence of the predicting features. Despite being a simple classifier, it has the potential of outperforming sophisticated machine learning classifiers. It is a quick supervised classification method that works well for massive prediction and categorization on difficult and sparse data sets.
Random Forest (RF): There are numerous decision trees in RF. An independent random sample from the complete dataset is used to train each decision tree. Every tree generates a unique set of results after the training is completed. As a result, a majority vote can be used to determine the model's prediction.
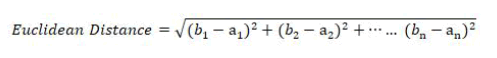
K Nearest Neighbor (KNN): While applying the KNN algorithm to forecast an output category for a collection of data input, the nearest k neighbors on the n-dimensional space of features generated using the training dataset are used. The most popular distance metric is the Euclidean distance. Input data is categorized using class label that most of the k closest neighbours share. Because of the impossibility to determine distance from the position that depicts a data instance having missing values, missing values need to be resolved before employing KNN. The computing cost is high since we need to determine the distance between each instance of test case data and each training set instance.
Pearson Correlation Weighted KNN (PCWKNN): The authors have proposed a novel approach for classification by improving KNN to use values of Pearson Correlation Coefficients as weights. Equation 1 is the Euclidean distance equation used by standard KNN to find the distance between two instances of the dataset (a1, a2, a3 ---an) and (b1, b2, b3 -----bn) where n is the count of predicting features in the dataset.
Equation 2 is the distance equation used by PCWKNN to find the Pearson Correlation Weighted Distance (PCWD) between two instances of the dataset (a1, a2, a3 ---an) and (b1, b2, b3 -----bn) with n number of prediction features. wi is the value of the correlation coefficient of prediction feature xi with the result variable.
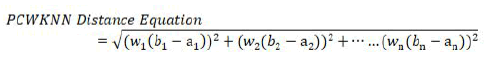
PCWKNN uses Pearson correlation coefficients as weights with the standard distance equation to give more weightage to the prediction features which are correlated higher with the result variable as compared to other features.
Figure 1 shows the proposed methodology for classification of lung cancer disease. Figure 2 depicts the flowchart of the adopted process for the classification of lung cancer disease using the proposed novel approach, i.e., Pearson Correlation Weighted KNN (PCWKNN) method. Figure 3 shows the flowchart of the steps for determining K nearest neighbors using PCWKNN. The function represented by the flowchart in Figure 3 has been called in the flowchart depicted in Figure 2. Hold out validation method has been implemented by PCWKNN to evaluate the performance. Figure 4 shows the flowchart for classification using classifiers other than PCWKNN, i.e., SVM, LR, NB, RF, and KNN.

Figure 1: Proposed methodology for classification of lung cancer disease.

Figure 2: Flowchart for classification of lung cancer disease using PCWKNN.

Figure 3: Flowchart for determining K nearest neighbours using PCWKNN.

Figure 4: Flowchart for classification using SVM, LR, NB, RF and standard KNN classifiers.
The pseudocode used to implement the PCWKNN-based classification algorithm shown in below.
The implementation pseudocode for steps of determining K nearest neighbours using PCWKNN as depicted discussed below.
The pseudocode for implementation of SVM, LR, NB, RF and standard KNN is described below.
Evaluation matrices
Utilizing the following performance matrices, performance was assessed. The assessment matrices were evaluated using the following parameters: true positives defined as count of accurately categorized positive classes, true negatives defined as count of accurately categorized negative classes, false positives defined as number of inaccurately classified positive classes, and false negatives defined called as count of inaccurately classified negative classes.
Accuracy: Accuracy is defined as the ratio of samples across all samples that are correctly categorized.
Accuracy=(Accurately categorized samples)/(Total samples) × 100
Sensitivity: The system's sensitivity describes its capacity for precise positive predictions.
Sensitivity=(True positive categorizations)/(True positive categorizations+False negative categorizations) × 100
Specificity: Specificity is the system's capacity to make precise negative predictions.
Specificity=(True negative classifications)/(True negative classifications+False positive classifications) × 100
Precision: Precision is the proportion of correctly classified positive samples to overall count of positive samples.
Precision=(True positive classifications)/(True positive classifications+False positive classifications) × 100
F-Measure: The F-Measure is the harmonic mean of precision and sensitivity.
F-Measure=2 × (Sensitivity × Precision)/(Sensitivity+Precision)
The authors performed experiments to diagnose the lung cancer disease using six classifiers: SVM, LR, NB, RF, KNN and PCWKNN. The authors performed the experiments using dataset of lung cancer existing on Kaggle. Table 2 shows the performance of classifiers. The authors used hold out validation method to perform the validation SVM achieved 96.77% accuracy, 50.00% sensitivity, 98.33% specificity, 50.00% precision and 50.00% F-Measure. 96.77% accuracy, 50.00% sensitivity, 98.33% specificity, 50.00% precision and 50.00% FMeasure was obtained by LR. NB got 95.16% accuracy, sensitivity of 50.00%, specificity of 96.67%, precision of 33.33%, and 40.00% F-measure. RF achieved 96.77% accuracy, 50.00% sensitivity, 98.33% specificity, 50.00% precision and 50.00% F-Measure. Standard KNN achieved 91.93% accuracy, 50.00% sensitivity, 93.33% specificity, 20.00% precision and FMeasure of 28.57%. PCWKNN obtained 98.39% accuracy, 98.36% sensitivity, 100.00% specificity, 100.00% precision and 99.17% F-Measure.
| Classifier | Accuracy | Sensitivity | Specificity | Precision | F-Measure |
|---|---|---|---|---|---|
| SVM | 96.77% | 50.00% | 98.33% | 50.00% | 50.00% |
| LR | 96.77% | 50.00% | 98.33% | 50.00% | 50.00% |
| NB | 95.16% | 50.00% | 96.67% | 33.33% | 40.00% |
| RF | 96.77% | 50.00% | 98.33% | 50.00% | 50.00% |
| KNN | 91.93% | 50.00% | 93.33% | 20.00% | 28.57% |
| PCWKNN | 98.39% | 98.36% | 100.00% | 100.00% | 99.17% |
Table 2: Performance comparison of classifiers.
Figure 5 shows the accuracy comparison for classifiers. PCWKNN has achieved the highest accuracy, so doctors can adopt the proposed method to classify lung cancer disease effectively.

Figure 5: Accuracy comparison of classifiers.
Figures 6-9 show the evaluation of different performance parameters of classifiers. It is evident from the comparison that PCWKNN has outperformed all other classifiers with respect to all performance parameters: Sensitivity, specificity, precision, and F-Measure.

Figure 6: Sensitivity comparison of classifiers.

Figure 7: Specificity comparison of classifiers.

Figure 8: Precision comparison of classifiers.

Figure 9: F-Measure comparison of classifiers.
The authors have represented a method for lung cancer disease classification. The authors presented a novel approach for classification, i.e., PCWKNN, which used values of Pearson correlation coefficients as weights in weighted KNN. The authors conducted the experiments using six classifiers: SVM, LR, NB, RF, KNN, and PCWKNN. SVM, LR, and RF achieved 96.77% accuracy. NB achieved 95.16% accuracy. KNN was 91.93% accurate. Using Pearson correlation coefficients as weights with KNN increased the accuracy, and PCWKNN provided the maximum accuracy, i.e., 98.39%. PCWKNN outperformed all other classifiers in regards to sensitivity (98.36%), specificity (100%), precision (100%), and F-Measure (99.17%) performance parameters also. The suggested technique can be successfully used by doctors to diagnose lung cancer.
In the future, the authors will put on PCWKNN to other datasets and evaluate its performance.
The authors of the work contribute equally in the whole work.
[Crossref] [Google Scholar] [PubMed]
[Crossref] [Google Scholar] [PubMed]
[Crossref] [Google Scholar] [PubMed]
[Crossref] [Google Scholar] [PubMed]
Citation: Sachdeva RK, Bathla P, Rani P, Lamba R, Ghantasala GSP, Nassar IF (2025) A Novel K Nearest Neighbor Classifier for Lung Cancer Disease Diagnosis. Chemo Open Access. 13:231.
Received: 11-Oct-2023, Manuscript No. CPOA-23-27507; Editor assigned: 13-Oct-2023, Pre QC No. CPOA-23-27507 (PQ); Reviewed: 27-Oct-2023, QC No. CPOA-23-27507; Revised: 17-Jan-2025, Manuscript No. CPOA-23-27507 (R); Published: 24-Jan-2025 , DOI: 10.35248/2167-7700.25.13.231
Copyright: © 2025 Sachdeva RK, et al. This is an open-access article distributed under the terms of the Creative Commons Attribution License, which permits unrestricted use, distribution, and reproduction in any medium, provided the original author and source are credited.