Journal of Depression and Anxiety
Open Access
ISSN: 2167-1044
ISSN: 2167-1044
Research Article - (2024)Volume 13, Issue 1
Cell’s bilayer phospholipid membranes work as insulators that separate the extracellular matrix and cytoplasm, creating a charge gradient across the cell membrane. Cell membrane capacitance, together with membrane resistance, impacts how fast the cell responds to the flow of ions currents. And for neurons, it affects how the neurons integrate electric signals and their synaptic efficacy. In this study, we performed logistic regression and used statistical analysis, and found a significant correlation with a relatively large R-squared value between depression and cell membrane capacitance.
Objective: This study aims to study if the lower cell membrane capacitance correlates with an increased rate of depression in participants aged 8-49 years old.
Data collection: Data used in this study were collected in the 1999-2000 and 2001-2002 CDC National Health and Nutrition Examination Survey (NHANES) database. 11,260 participants aged 8-49 years old in the 1999-2000 and 2001-2002 NHANES database were examined for Bioelectrical Impedance Analysis (BIA), which indicates the impedance analyzing components in this study including the ECF volume, percent body fat, and cell membrane capacitance. 1,707 participants aging between 20-39 years old in the 1999-2000 and 2001-2002 NHANES database signed up for a depression mental health examination, which indicates the diagnosis of depression in this study. Logistic regression and statistical modeling were performed to study the association between cell membrane capacitance and odds of depression.
Results: For unadjusted correlation between cell membrane capacitance and depression odds, with one standard deviation decrease in cell membrane capacitance, the depression odds will increase by 3.742 (95% CI 3.598-3.885) times.
For demographics data adjusted correlation between cell membrane capacitance and depression odds, with one standard deviation decrease in cell membrane capacitance, the depression odds will increase by 2.675 (95% CI 2.310-3.042) times.
For demographics data and bioelectrical impedance analysis data adjusted correlation between cell membrane capacitance and depression odds, with one standard deviation decrease in cell membrane capacitance, the depression odds will increase by 2.193 (95% CI 1.407-2.979) times.
For demographics data and bioelectrical impedance analysis data adjusted correlation between cell membrane capacitance and depression odds, with one standard deviation decrease in cell membrane capacitance, the depression odds will increase by 2.654 (95% CI 1.695-3.612) times.
Conclusion: This study shows the correlation between cell membrane capacitance and depression scores using data collected from the 1999-2000 and 2001-2002 CDC National Health and Nutrition Examination Survey (NHANES) database. Among participants aging from 8 to 49 years old, after adjusting for demographics data and bioelectrical impedance analysis data as covariance, with one standard deviation decrease in cell membrane capacitance analysis, an increase in odds of depression by 2.654 (95% CI 1.695-3.612) times was observed in this statistical analysis. The p-value of cell membrane capacitance in logistic regression after being adjusted was significant (<0.05) and was in the 95% confidence interval, so we may conclude that there’s a significant correlation between cell membrane capacitance and depression scores and the coefficient obtained from the logistic regression was significant and valid.
Membrane capacitance; Depression; Logistic regression; Statistical analysis; Correlation
Although the exact causes and mechanisms of depression are still unclear, several pathological hypotheses state that depression can be due to heredity factors, changes in neurotransmitter systems, changes in the amount of Brain-Derived Neurotrophic Factors (BDNFs), changes in the Hypothalamic-Pituitary-Adrenal (HPA) axis, and inflammatory system malfunctioning [1]. While the exact biological changes in the body of patients with depression are still not well-known, the whole-body cell membrane capacitance from a number of participants measured by a HYDRA ECF/ICF bio-impedance spectrum analyzer and the Cole model indicates a strong correlation between cell membrane capacitance and depression.
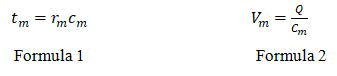
Cells’ bilayer phospholipid membranes work as insulators that separate the extracellular matrix and cytoplasm, creating a charge gradient across the cell membrane, making the cell membrane act as a cell capacitor in cells. According to the formula to calculate the time constant of a cell (formula 1), cell membrane capacitance affects the time constant of a cell, which influences how the cell membrane responds to the flow of ions channel currents and how a cell propagates and integrates electrical signal [2-4]. Some studies also show that changes in membrane capacitance and membrane resistance played an important role in causing slower conduction in unmyelinated nerve fibers [5,6]. Thus the neuronal energy consumption may be affected, and several studies have shown that patients with major depression have reduced blood flow and metabolism in the brain [7,8]. A correlation between cell membrane capacitance and odds of depression can be expected from this point of view. Furthermore, the cell membrane capacitance can also influence the cell’s voltage and, therefore, the cell’s excitability (formula 2), where Q represents the charge applied to change the capacitance of the cell membrane [9]. In this study, we found a strong and significant correlation between cell membrane capacitance and depression. Unfortunately, due to the fact that the data on membrane capacitance was obtained from the HYDRA ECF/ICF bio-impedance spectrum analyzer and the analyzer could only measure the whole body cell membrane capacitance by wrist-ankle measurement based on the Cole model, we were unable to conclude that the correlation between cell membrane capacitance and depression can test the neuroscientific hypothesis mentioned above [10]. Even so, we still hope to provide a possible new direction for further study of depression.
Participants and eligibility
In 1999-2000 and 2001-2002 NHANES, demographics data, including family income, education level, and military status, were collected among 21004 participants. Among these 21004 participants, 1705 signed up for mental health examination, and 1576 participants had valid depression scores that could be used for statistical analysis. And among these 1576 participants, 876 participants aging from 8-46 years were not pregnant and have valid data for cell membrane capacitance measured in nF.
Study design
By collecting data from the 1999-2000 and the 2001-2002 NHANES database and combining them together, logistic regression was performed and its data were adjusted by 4 layers based on different categories of covariates such as demographic data to show the relationship between cell membrane capacitance and depression.
Covariates
Covariate data was collected from 1999-2000 and 2001-2002 NHANES and was selected based on its known effect on depression and studies that indicate the factors that might influence depression [11]. Age, gender, race, military status, annual family income, annual household income, household reference person’s gender, household reference person’s age, household reference person’s education level, and household reference person’s marital status were collected from 1999-2000 and 2001-2002 NHANES demographics data. Participants’ age was continuous data ranging from 0-85; 0-84 represents participants’ age from 0-84 years old, and 85 represents participants’ age equal to or large than 85 years old at the time of the survey. Gender was collected as categorical data in which 0 represents female and 1 represents the male. The race was also collected as categorical data and was converted into 5 indicator variables: Mexican American, Other Hispanic, Non-Hispanic White, Non-Hispanic Black, and Other Race. Military status was collected as categorical data in which 1 represents the participant who served in the United States armed forces and 0 represents that this participant did not serve in the armed forces. Annual family income was collected as categorical data in which numbers ranging from 1-11 represent the ranges of annual family income from $0-$20,000. The larger numbers in 1-11 represent the higher annual family income and 12 represents that annual family income is over $20,000. The coding values for annual household income are the same as the coding values of annual family income. The household reference person’s gender was collected as categorical data in which 0 represents female and 1 represents the male. The household reference person’s education level was collected as categorical data in which 1 represents the education level is less than 9th grade, 2 represents the education level is 9th-11th grade, 3 represents the education level is high school graduated, 4 represents the education level is some college or AA degree, and 5 represents the education level is college graduate or above. The marital status of the household reference person was collected as categorical data in which 1 represents married, 2 represents widowed, 3 represents divorced, 4 represents separated, 5 represents never married, and 6 represents living with a partner. Body weight and Body Mass Index (BMI) were collected from 1999-2000 and 2001-2002 NHANES body measures. Body weight was collected as continuous data ranging from 3.1 kg to 193.3 kg. BMI was collected as continuous data ranging from 11.49 kg/m2 to 66.44 kg/m2. Percent body fat, estimated extracellular fluid volume, and quality of fit to Cole model were collected from 1999-2000 and 2001-2002 NHANES body impedance analysis. Percent body fat was collected as continuous data ranging from 3.2%-64.2%. Estimated extracellular fluid volume was collected as continuous data ranging from 4.83 L-29.69 L. Quality of fit to Cole model was collected as categorical data in which 0 represents excellent fit, 1 represents good fit, 2 represents marginal fit, 3 represents questionable fit, 4 represents bad fit, and 5 represents could not be fit.
Study the mutual effects of covariates and the independent variable
Since many studies have long found the correlation between percent body fat, extracellular fluid, cell membrane capacitance, and BMI, it is possible that these factors might work as confounders that may have direct impacts on the coefficient and p-value of cell membrane capacitance in the logistic regression [12]. We have multiplied each participant’s data of percent body fat, cell membrane capacitance together as one new covariate, extracellular fluid, and BMI together as new covariates to see if they have interactive effects on each other and thus had contributed to the odd of depression as a whole.
Cell membrane capacitance measurement
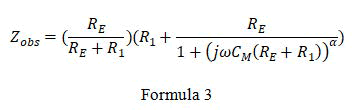
The 1999-2000 and 2001-2002 NHANES Bio-Impedance Spectroscopy (BIS) data was collected with a HYDRA ECF/ICF bio-impedance spectrum analyzer and the quality of frequency data was processed and evaluated through an external hydra modeling program, in which resistance, reactance, reciprocal impedance (Zobs) m and phase angle (θ) will be measure at each measured frequency. The Zobs and θ data were then fit to a Cole model (Cole) (formula 3) using iterative non-linear curve-fitting software and cell membrane capacitance will be solved from the Cole model. 98.0% of the data used in the Cole model to calculate cell membrane capacitance showed an excellent or good fit to the Cole model.
Statistical analysis
The statistical analysis was performed by python using Pycharm. Cell membrane capacitance, percent body fat, extracellular fluid volume, BMI was respectively measured in nF, percentage, L, and kg/m2. We added a negative sign before every cell membrane capacitance reading to show the positive association between lowering cell membrane capacitance and depression score. Since these data were not normally distributed, to standardize the data, we took the log of cell membrane capacitance, percent body fat, and extracellular fluid volume and transformed them into z-score to normalize the data by formula 4:
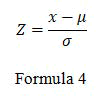
Where; x=Raw data for each participant. μ=Mean of the dataset. σ=Standard deviation of the dataset.
The body weight-stratified demographic
Since both existing studies and the data in this study have shown a strong correlation between body weight and cell membrane capacitance, we calculated the body weightstandardized rate in the depression score to cell membrane capacitance analysis by calculating the cell membrane capacitance score in three weight groups (3.1 kg-65 kg, 65 kg-85 kg, and 85 kg-193.3 kg). Depression prevalence analysis of demographic and body measurement data was also performed separately in the three weight-stratified cell membrane capacitance groups (Figure 1).

Figure 1: Four layered multivariable logistic regression.
The correlation between cell membrane capacitance and depression score was shown by adjusted logistic regression and adjusted multivariable logistic regression analysis. This study used four-layered multivariable logistic regression to study the interaction between cell membrane capacitance and covariates. The unadjusted logistic regression aims to study the raw association between cell membrane capacitance and depression score. The logistic regression adjusted to demographics data, including military status, education level, annual family income, and demographics data of household reference person, was performed to show how the demographics data affects the correlation between cell membrane capacitance and depression score. On the last level of logistic regression, the logistic regression adjusted to extracellular fluid, percent body fat, BMI, and the interactions between them was performed to show how the extracellular fluid, percent body fat, and BMI affect the correlation between cell membrane capacitance and depression score either as a single covariate or as several different covariates. The multivariable logistic regression adjusted to all covariates was then performed to test if there’s a correlation between cell membrane capacitance and odds of depression. We eliminated any data that showed missing information on any covariates to ensure the accuracy of the logistic regression model.
After excluding missing demographic, body measures, body impedance analysis data, and outliers, 876 participants' data was left in the analysis. In the 3.1 kg-65 kg (3.1 kg ≤ body weight ≤ 65 kg) group, 81 participants were classified as having the lowest cell membrane capacitance, 82 participants were classified as having middle cell membrane capacitance, and 84 participants were classified as having the highest cell membrane capacitance. In the 65 kg-80 kg (65 kg<body weight ≤ 85 kg) group, 129 participants were assigned to each of the lowest groups, 126 participants were classified as having the middle cell membrane capacitance, and 122 participants were classified as having the highest cell membrane capacitance. In the 80 kg-193.3 kg (85 kg<body weight ≤ 193.3 kg) group, 126 participants were classified as having the lowest cell membrane capacitance, 122 participants were classified as having middle cell membrane capacitance, and 51 participants were classified as having the highest cell membrane capacitance. Demographic and body weight for the 3.1 kg to 65 kg (3.1 kg ≤ body weight ≤ 65 kg) group are displayed in Table 1, for the 65 kg to 85 kg (65 kg<body weight ≤ 85 kg) group is displayed in Table 2, and for the 85 kg to 193.3 kg (85 kg<body weight ≤ 193.3 kg) group is shown in Table 3. From the tables, we can see that the participants are primarily non-Hispanic white, and for 65 kg to 85 kg and 85 kg to 193.3 kg groups, a positive relationship between cell membrane capacitance and the average age was observed. A strong relationship between gender and cell membrane capacitance was also observed for all 3 groups. Figure 2 is provided to give a better view of the relationship between gender and cell membrane capacitance (Table 1).
| Lowest (n=81) | Middle (n=82) | Highest (n=84) | |
|---|---|---|---|
| Average age, years | 28.56 (std=6.53) | 29.74 (std=6.54) | 27.91 (std=5.76) |
| Sex, males, n | 1 (1.23%) | 17 (20.73%) | 52 (61.9%) |
| Sex, females, n | 80 (98.77%) | 65 (79.27%) | 32 (38.1%) |
| Race, Mexican American, n | 19 (23.46%) | 24 (29.27%) | 39 (46.43%) |
| Race, other Hispanic, n | 4 (4.94%) | 4 (4.87%) | 5 (5.95%) |
| Race, non-Hispanic white, n | 42 (51.85%) | 39 (47.56%) | 29 (34.52%) |
| Race, non-Hispanic black, n | 10 (12.35%) | 11 (13.41%) | 9 (10.71%) |
| Race, other race, n | 6 (7.41% ) | 4 (4.88%) | 2 (2.38%) |
| Education level, high school diploma or higher | 61 (75.31%) | 58 (70.73%) | 56 (66.67%) |
| Military Status, served, n | 1 (1.23%) | 3-3.65% | 0% |
| Total number of people in the household >4, n | 18 (22.22%) | 18 (21.95%) | 28 (33.33%) |
| Average BMI, kg/m2 | 20.71 (std=2.34) | 22.36 (std=2.83) | 22.65 (std=2.39) |
Note: n is shown as numeric count for categorical variables; for linear variables (age and body weight), in group mean was taken and shown as average values. % is shown for the in-group percentage of each categorical variable. Std stands for standard deviation.
Table 1: Demographic data and body weight for the 3.1 kg to 65 kg (3.1 kg ≤ body weight ≤ 65 kg) group.
| Smallest (n=129) | Middle (n=126) | Largest (n=122) | |
|---|---|---|---|
| Average age, years | 28.63 (std=5.82) | 30.09 (std=5.95) | 30.47 (std=5.95) |
| Sex, males, n | 13 (10.08%) | 86 (68.25%) | 114 (93.44%) |
| Sex, females, n | 116 (89.92%) | 40 (31.75%) | 8 (6.56%) |
| Race, Mexican American, n | 25 (19.38%) | 36 (28.57%) | 40 (32.79%) |
| Race, other Hispanic, n | 10 (7.75%) | 4 (3.17%) | 8 (6.56%) |
| Race, non-Hispanic white, n | 70 (54.26%) | 61 (48.41%) | 46 (37.7%) |
| Race, non-Hispanic black, n | 21 (16.28%) | 23 (18.25%) | 23 (18.85%) |
| Race, other race, n | 3 (2.33%) | 2 (1.59%) | 5 (2.53%) |
| Education level, high school diploma or higher | 99 (76.74%) | 90 (71.43%) | 89 (72.95%) |
| Military status, served, n | 1 (0.78%) | 10 (7.94%) | 14 (11.48%) |
| Total number of people in the household>4, n | 32 (24.81%) | 41 (32.54%) | 29 (23.77%) |
| Average BMI, kg/m2 | 26.86 (std=3.40) | 25.86 (std=3.11) | 26.19 (std=2.70) |
Note: n is shown as numeric count for categorical variables; for linear variables (age and boday weight), in group mean was taken and shown as average values. % is shown for the in group percentage of each categorical variable. std stands for standard deviation.
Table 2: Demographic data and body weight for the 65 kg to 85 kg (65 kg<body weight ≤ 85 kg) body weight group.
| Smallest (n=84) | Middle (n=84) | Largest (n=84) | |
|---|---|---|---|
| Average age, years | 29.3 (std=5.68) | 29.84 (std=5.71) | 30.15 (std=5.36) |
| Sex, males, n | 21 (25%) | 53 (63.1%) | 8 (9.52%) |
| Sex, females, n | 63 (75%) | 31 (36.9%) | 76 (90.48%) |
| Race, Mexican American, n | 19 (22.62%) | 17 (25.76%) | 16 (19.05%) |
| Race, other Hispanic, n | 1 (1.19%) | 5 (7.58%) | 1 (1.19%) |
| Race, non-Hispanic white, n | 46 (54.76%) | 27 (40.91%) | 42 (50%) |
| Race, non-Hispanic black, n | 18 (21.43%) | 16 (24.24%) | 23 (27.38%) |
| Race, other race, n | 0% | 1 (1.52%) | 2 (2.38%) |
| Education level, high school diploma or higher | 64 (76.19%) | 47 (71.21%) | 62 (73.81%) |
| Military status, served, n | 3 (3.57%) | 4 (6.06%) | 13 (15.48%) |
| Total number of people in the household > 4, n | 28 (33.33%) | 12 (18.18%) | 23 (27.38%) |
| Average BMI, kg/m2 | 34.53 (std=5.09) | 32.54 (std=5.43) | 33.59 (std=5.15) |
Note: n is shown as numeric count for categorical variables; for linear variables (age and body weight), in group mean was taken and shown as average values. % is shown for the in-group percentage of each categorical variable. std stands for standard deviation.
Table 3: Demographic data for 85 kg to 193.3 kg (85 kg <body weight ≤ 193.3 kg) body weight group.

Figure 2: Relationship between gender and cell membrane capacitance.
The body weight-stratified depression score in three cell membrane capacitance groups
The number of depression-positive diagnoses was counted for each age group and cell membrane capacitance subgroups. The number of depression-positive diagnoses for 3 weight groups (3.1 kg ≤ body weight ≤ 65 kg, 65 kg<body weight ≤ 85 kg, 85 kg<body weight 193.3 kg) was displayed in Table 4. We observed that the subgroups with the lowest cell membrane capacitance have the largest number of depression-positive diagnoses for all 3 weight-stratified groups. Other trends are not noticed across the three weight-stratified groups.
| Lowest (n=81) | Middle (n=82) | Highest (n=84) | ||
|---|---|---|---|---|
| Depression-positive diagnosis | 3.1 kg ≤ body weight ≤ 65 kg | 9 (11.11%) | 5 (6.1%) | 6 (7.14%) |
| 65 kg<body weight ≤ 85 kg | 11 (8.53%) | 4 (3.17%0 | 6 (4.92%) | |
| 85 kg<body weight ≤ 193.3 kg | 8 (9.52%) | 4 (6.06%) | 4 (4.76%) | |
Note: Depression-positive diagnoses among lowest, middle and highest cell membrane capacitance group in 3.1 kg to 65 kg (3.1 kg ≤ body weight ≤ 65 kg) group.
Table 4: Depression-positive diagnoses among the lowest, middle and highest cell membrane capacitance group in 3.1 kg to 65 kg (3.1 kg ≤ body weight ≤ 65 kg) group.
The body weight stratified body impedance analysis data in three cell membrane capacitance groups
Some of the body impedance analysis data were shown in each body weight group. The average percent body fat and average extracellular fluid volume for 3 body weight groups (3.1 kg ≤ body weight ≤ 65 kg, 65 kg<body weight ≤ 85 kg, 85 kg<body weight ≤ 193.3 kg) was shown in Table 5. A negative relationship between average percent body fat and cell membrane capacitance is observed for all three groups and this relationship and a better view of this relationship is shown in Figure 3. Meanwhile, a positive relationship between average extracellular fluid volume and cell membrane capacitance is also observed across all three groups. A better view of this relationship is shown in Figure 4 no other trend was observed in this part of the analysis.
| Lowest (n=81) | Middle (n=82) | Highest (n=84) | ||
|---|---|---|---|---|
| 3.1 kg ≤ body weight ≤ 65 kg | Average percent body fat, % | 36.6 (std=5.63) | 31.82 (std=7.34) | 22.89 (std=8.47) |
| Average extracellular fluid volume, L | 11.95 (std=1.38) | 12.99 (std=1.43) | 14.1 (std=1.50) | |
| 65 kg<body weight ≤ 85 kg | Average percent body fat, % | 40.15 (std=7.89) | 28.77 (std=7.46) | 19.49 (std=6.89) |
| Average extracellular fluid volume, L | 14.76 (std=1.70) | 16.54 (std=1.80) | 18.19 (std=1.62) | |
| 85 kg<body weight ≤ 193.3 kg | Average percent body fat, % | 43.59 (std=7.55) | 30.76 (std=9.10) | 25.6 (std=8.49) |
| Average extracellular fluid volume, L | 18.1 (std=2.21) | 20.5 (std=2.12) | 22.1 (std=2.51) | |
Note: % is shown for the average percent body fat; std stands for standard deviation.
Table 5: Body impedance analysis data among the lowest, middle and highest cell membrane capacitance group in 3 body weight groups.

Figure 3: The logistic procedure.

Figure 4: The four layered multivariable logistic regression used linear Z transformed cell membrane capacitance.
The four layered multivariable logistic regression used linear Z transformed cell membrane capacitance as the dependent variable and used the depression score as the independent outcome. The unadjusted logistic regression was set as a reference. The comparison between partially adjusted logistic regression (Tables 6-9) to the reference logistic regression indicates that cell membrane capacitance interacts with percent body fat, extracellular fluid, body weight, and demographic/ bodily covariates in influencing odds of depression since there is a noticeable change in the value of coefficients. This observation makes us confident in proceeding to the fully adjusted logistic regression model. Furthermore, we calculated McFadden R2 based on formula 5 to provide a reference in comparing the data’s goodness of fit for a logistic regression model of differently adjusted models.
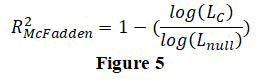
In this formula, LC denotes the maximized likelihood value from the current fitted model and Lnull denotes the corresponding value but for the model with only an intercept and no covariate.
Unadjusted logistic regression of cell membrane capacitance vs. odds of depression
After excluding any individual with missing cell membrane capacitance data or depression score data, 876 participants were included in the unadjusted logistic regression. When examining the correlation between cell membrane capacitance and depression score, one standard deviation in cell membrane capacitance will lead to decreased depression score (Table 6). One standard deviation decrease in cell membrane capacitance will lead to 3.742 (95% CI 3.598-3.885) times increase in the odds of depression. The P-value is below 0.05 for cell membrane capacitance, so there’s a significant correlation in this model between cell membrane capacitance and depression odds. R2McFadden in this model is 0.032, which indicates more covariates should be added to the model.
| Cell membrane capacitance parameter (β) | SEβ | Pr>Chi Sq | Multivariable-adjusted depression score (95%CI) per standard deviation decrease in cell membrane capacitance | |||||||
|---|---|---|---|---|---|---|---|---|---|---|
| Depression score | 1.3195 | 0.073 | 0.036 |  |
3.742 (3.598-3.885) | |||||
| 1.5 | 2 | 2.5 | 3 | 3.5 | 4 | |||||
Note: The cell membrane capacitance parameter indicates the coefficient of the cell membrane capacitance in the logistic regression. Pr>Chi Sq indicates the p-value of the coefficient; SEβ indicates the standard error of the coefficient.
Table 6: The coefficient for cell membrane capacitance from unadjusted Logistic regression output and the corresponding standard error, P-value, and odds ratio with 95% CI.
Logistic regression of cell membrane capacitance vs. depression score adjusted to education level, the total number of people in the household, military status, annual family income, and household reference person’s demographics data.
After excluding any individuals with missing education level data, the total number of people in household data, military status data, and cell membrane capacitance data, or the diagnoses of depression data, 876 participants were included in the logistic regression adjusted to education level. When examining the correlation between the cell membrane capacitance and depression score, one standard deviation decrease in cell membrane capacitance will lead to 2.675 (95% CI 2.310-3.042) times increase in odds of depression (Table 7). However, the p-value exceeds 0.05 for the cell membrane capacitance, so the observed correlations might be due to chance. R2McFadden in this model is 0.071. By comparing this to the R2McFadden of raw analysis, we can see that the data fits better in this model. This value also suggests that further adjustments are necessary.
| Cell membrane capacitance parameter (β) | SEβ | Pr>Chi Sq | Multivariable-adjusted depression score (95%CI) per standard deviation decrease in cell membrane capacitance | |||||||
|---|---|---|---|---|---|---|---|---|---|---|
| Depression score | 0.9840 | 0.187 | 0.598 |  |
2.675 (2.310-3.042) | |||||
| 1.5 | 2 | 2.5 | 3 | 3.5 | 4 | |||||
Note: The cell membrane capacitance parameter indicates the coefficient of the cell membrane capacitance in the logistic regression. Pr>Chi Sq indicates the p-value of the coefficient; SEβ indicates the standard error of the coefficient.
Table 7: The coefficient for cell membrane capacitance from unadjusted logistic regression output and the corresponding standard error, P-value, and odds ratio with 95% CI.
Logistic regression of cell membrane capacitance vs. depression score adjusted to education level, the total number of people in the household, military status, annual family income, household reference person’s demographics data, average BMI, two weeks sad, empty, depressed data, fat mass, quality of fit to the Cole model, and body impedance analysis data, including percent body fat, body weight, and extracellular fluid volume.
After excluding any individuals with missing education level data, the total number of people in household data, military status data, household reference person’s demographics data, cell membrane capacitance data, percent body fat, body weight, extracellular fluid volume, average BMI, or the diagnoses of depression data, 876 participants were included in the logistic regression adjusted to education level. When examining the correlation between the cell membrane capacitance and depression score, one standard deviation in cell membrane capacitance will lead to an increased depression score (Table 8). One standard deviation decrease in cell membrane capacitance will lead to 2.193 (95% CI 1.407-2.979) times increase in odds of depression. The P-value is at the 0.05 line for the cell membrane capacitance, which may suggest the observed correlation may be not significant enough. R2McFadden in this model is 0.453. By comparing this to the R2McFadden of raw analysis, we can see that this data fits better in this model. This value also suggests that further adjustments are necessary.
| Cell membrane capacitance parameter (β) | SEβ | Pr>ChiSq | Multivariable-adjusted depression score (95%CI) per standard deviation decrease in cell membrane capacitance | |||||||
|---|---|---|---|---|---|---|---|---|---|---|
| Depression score | 0.7853 | 0.401 | 0.050 |  |
2.193 (1.407-2.979) | |||||
| 1.5 | 2 | 2.5 | 3 | 3.5 | 4 | |||||
Note: The cell membrane capacitance parameter indicates the coefficient of the cell membrane capacitance in the logistic regression. Pr>Chi Sq indicates the p-value of the coefficient; SEβ indicates the standard error of the coefficient.
Table 8: The coefficient for cell membrane capacitance from unadjusted logistic regression output and the corresponding standard error, P-value, and odds ratio with 95% CI.
Logistic regression of cell membrane capacitance vs. depression score adjusted to all covariates and their interactions.
This layer of logistic regression of cell membrane capacitance vs. depression score adjusted to education level, annual family income, military status, household reference person’s demographics data, average BMI, and body impedance analysis data, including percent body fat, body weight, extracellular fluid volume, two weeks sad, empty, depressed data, fat mass, quality of fit to the Cole model, the product of cell membrane capacitance and percent body fat, the product of the z-scored of cell membrane capacitance and percent body fat and extracellular fluid volume, the product of the z-scores of cell membrane capacitance and the z-score percent body fat and extracellular fluid volume and body weight, and the product of the z-scored of cell membrane capacitance and the z-score total number of people in the household. After excluding any individuals with missing education level data, the total number of people in household data, military status data, household reference person’s demographic data, average BMI, cell membrane capacitance data, percent body fat, body weight, extracellular fluid volume, or the diagnoses of depression data, 544 participants were included in the logistic regression adjusted to education level, When examining the correlation between the cell membrane capacitance and depression score, one standard deviation in cell membrane capacitance will lead to increased odds depression (Table 9). One standard deviation decrease in cell membrane capacitance will lead to a 2.654 (95% CI 1.695-3.612) times increase in depression score. The p-value is below 0.05 (p-value=0.026) for the cell membrane capacitance, so we are confident to conclude that there’s a correlation between cell membrane capacitance and depression score. R2McFadden in this model is 0.490. By comparing this to the R2McFadden of raw analysis, we can see that this data fits better in this model.
| Cell membrane capacitance parameter (β) | SEβ | Pr>Chi Sq | Multivariable-adjusted depression score (95%CI) per standard deviation decrease in cell membrane capacitance | |||||||
|---|---|---|---|---|---|---|---|---|---|---|
| Depression score | 0.9759 | 0.489 | 0.046 |  |
2.654 (1.695-3.612) | |||||
| 1.5 | 2 | 2.5 | 3 | 3.5 | 4 | |||||
Note: The cell membrane capacitance parameter indicates the coefficient of the cell membrane capacitance in the logistic regression. Pr>Chi Sq indicates the p-value of the coefficient; SEβ indicates the standard error of the coefficient.
Table 9: The coefficient for cell membrane capacitance from unadjusted logistic regression output and the corresponding standard error, P-value, and odds ratio with 95% CI.
In this study, with a total of 11, 260 eligible participants aged 8-49, we observed a correlation that a decrease in one standard deviation of cell membrane capacitance will increase the odds of depression by 2.654 (95% CI 1.695-3.612) times. Several reasons can explain this observed correlation between cell membrane capacitance and higher odds of depression. First, cell membrane capacitance affects the time constant of a neuron, which influences how fast a neuron propagates electrical signal. This may cause changes in the normal function of neurons and their excitability, and changes in the Hypothalamic-Pituitary-Adrenal (HPA) axis may lead to a higher chance of having psychiatric disorders like depression. The second explanation is that since the time constant of a neuron may affect the energy consumption of a neuron by altering its firing rate, and several studies have shown that patients with major depression have reduced blood flow and metabolism in the brain it’s possible that a correlation will be observed between cell membrane capacitance and depression score and a lower cell membrane capacitance will lead to a higher odd of depression. The third explanation is that psychiatric disorders like depression may affect neurons' normal function and excitability, which may consequently affect the cell membrane capacitance. Another explanation is that there’s a strong correlation between cell membrane capacitance and body weight. The correlation between body weight and percent body fat and depression score was also observed in this study. Thus, either higher body weight may cause higher depression odds or higher depression odds cause higher body weight, and these factors may lead to changes in depression score.
With a P-value lower than 0.05 and R2McFadden of 0.490, we are confident that the observed correlation is statistically significant and not due to chance.
In conclusion, we observed a significant correlation between a per-standard deviation decrease in cell membrane capacitance and an increased depression by 2.654 (95% CI 1.695-3.612) times.
We only obtained limited numbers of covariates, where the history of psychiatric disorders, way of commute data, smoking, and alcohol drinking are missing; the significance of this study may change if these covariates are added to the logistic regression model in the future. Also, due to the fact that the data of cell membrane capacitance is calculated from the Cole model (Cole) using iterative non-linear curve-fitting software and the technique of measuring cell membrane capacitance is still developing due to the fact that the data on membrane capacitance was obtained from the Cole model and the analyzer could only measure the whole body cell membrane capacitance by wrist-ankle measurement, we were unable to conclude that the correlation between cell membrane capacitance and depression can test the neuroscientific hypothesis mentioned above. According to the fact that cell membrane capacitance will affect the excitability of neurons and how fast neurons propagate signals, cell type-specific data will enhance our method and can lead to better observations.
Due to this study's case-study nature, we cannot distinguish the direction of the correlation. In future studies, we believe the causal effect can be determined by a prospective study that analyses the correlation between cell membrane capacitance and clinically diagnosed depression score. A genetic study should also be performed to test the hypothesis that there’s a correlation between cell membrane capacitance and depression score..
Author Shaoyi Zhang is the research advisor of Xinrui Liu. All other authors declare that they have no conflicts of interest.
The first author of the research paper manuscript is Xinrui Liu, and the second author is Shaoyi Zhang. Author Shaoyi Zhang is the research advisor of Xinrui Liu.
There is no acknowledgement in this study.
As the first author of this work, I would like to declare that this research was solely funded by me. I have personally financed all aspects of this project, including data collection, analysis, and publication fees.
I would also like to note that this funding was obtained through personal resources, and there was no external financial support received for this work. Therefore, I can confirm that there are no conflicts of interest arising from this funding source.
[Crossref] [Google Scholar] [PubMed]
[Crossref] [Google Scholar] [PubMed]
[Crossref] [Google Scholar] [PubMed]
[Crossref] [Google Scholar] [PubMed]
[Crossref] [Google Scholar] [PubMed]
[Crossref] [Google Scholar] [PubMed]
[Crossref] [Google Scholar] [PubMed]
Citation: Liu X, Zhang S (2024) A Newly Observed Negative Association between Cell Membrane Capacitance and Depression Using Data Measured by a HYDRA ECF/ICF Bio-Impedance Spectrum Analyzer and Cole Model. J Dep Anxiety. 13:531.
Received: 05-Jun-2023, Manuscript No. JDA-23-24841; Editor assigned: 07-Jun-2023, Pre QC No. JDA-23-24841 (PQ); Reviewed: 21-Jun-2023, QC No. JDA-23-24841; Revised: 02-Oct-2023, Manuscript No. JDA-23-24841 (R); Published: 26-Mar-2024 , DOI: 10.35248/2167-1044.24.13.531
Copyright: © 2024 Liu X, et al. This is an open-access article distributed under the terms of the Creative Commons Attribution License, which permits unrestricted use, distribution, and reproduction in any medium, provided the original author and source are credited.