Journal of Biomedical Engineering and Medical Devices
Open Access
ISSN: 2475-7586
ISSN: 2475-7586
Research Article - (2016) Volume 1, Issue 3
Keywords: Atherosclerotic; Cardiovascular; Predilections; Haematocrit
Atherosclerosis is a cardiovascular disease characterized by increasing arterial inflammation, which causes the blockage of the arterial lumen and the reduction of blood supply to important parts of the human body. The initiation and development of atherosclerosis is driven by fluid-mechanical forces [8-12]. These forces are sensed by the endothelial cells and the resulting signals are either transduced into chemical responses or transmitted to the surroundings to regulate the cellular activity [1-4]. Therefore, changes in flow patterns caused by the blood corpuscular compounds might reveal new relevant modifications in both the magnitude and the distribution of the mechanical forces sensed by the endothelium. Hence, understanding variations in blood flow characteristics under physiological conditions might yield new insights on atheroma development.
Jung et al. [26] reported on changes in flow due to plasmaerythrocyte interaction, leading to important non- Newtonian effects, such as changes in the shear rate. However, in this study neither the arterial geometry nor the haematocrit is physiologically realistic. Prior research on geometrical features such as non-planarity and bifurcations indicates that the characteristics of the arterial network correlate with the flow patterns [27-29]. To assess whether computational models based on physiological haematocrit and arterial shape perform better than Newtonian models that neglect these characteristics of the in vivo arterial network, we addressed the coupled effects of the realistic arterial geometry and the non-Newtonian assumption. Indeed, both idealised models of artery and 3D image reconstruction-based realistic structures are used in our study to represent the arterial segments. Moreover, the physiological haematocrit is also used. Furthermore, while Zhao et al. [30] assess the effects of the blood particles in microcirculation, we simulate the effect of erythrocytes on flow patterns in large arteries which are predilections sites for atheroma development.
Therefore, we consider this study of importance, because it offers a realistic and clinically-relevant understanding of atherosclerosis development. In the literature, the reported changes in flow due to plasma-erythrocytes interactions [31-33] lead to non- Newtonian effects that we addressed taking into account the effects of different levels of particle concentration -- growing haematocrit. To the best of our knowledge, to date, there are few haemorheological studies that attempt to simulate the progression of atherosclerosis. Indeed, as suggested above, the great majority of general haemorheological flow analyses focuses on either experimentation or in computation at micro-circulation [29,30,33]. However, this does not provide significant advancement in the understanding of the mechanisms that drive atherosclerotic plaques development and its side effects, because atherosclerosis is the main contributor to cardiovascular diseases and it develops in large arteries. In this work, we introduce a multi-scale rheological model of blood-flow in large arteries, in order to understand the relevance of haemorheology in computational models of atherosclerosis. Indeed, an in-depth assessment of flow characteristics modified by the blood particles is presented. Our model comprises of an established multiphase technique [34,35], which is used to represent haemorheology; and a new immersed boundary (IB) method, to address the blood-artery interactions. This new fluidstructure interaction methodology for generalised incompressible flow derives from [18,36], was developed by the author in [37] and is here improved and coupled with the above described multiphase approach. The multiphase modelling derives from [34,35,38]. The coupling multiphase-IB is here applied to an in-depth investigation of erythrocytes-driven flow characteristics, in atheroma development. As mentioned previously, our computational predictions are supported by both computational and experimental findings from the literature [10-21]. The goal of this study is to address and resolve issues inherent to current computational models of blood flow, at predilection sites for atheroma development. We have performed both single-phase (plasma) and two-phase (plasma-erhytrocytes) simulations at predilection sites for atherosclerotic plaques development. We have found that the presence of erythrocytes can change the velocity distribution and its magnitude in a range between 5% and 45%, in function of the crosssectional particle volume fraction. This correlates with the shear rate and, consequently, with the shear forces sensed by the endothelium. These shear forces control an array of cellular activities [39-44]. Our results indicate that rising flow laminarization occurs as a result of increasing haematocrit, while the flow vorticity diminishes. On the contrary, both apparent viscosity and wall shear stress rise with rising particles volume fraction. This difference in the results indicates that blood rheology might be an important aspect of models of plaque progression leading to significant contributions in translational and clinical research. The remainder of this paper is structured as follows. Firstly, we will summarize the literature on atherosclerosis development that is relevant for the models presented here. Secondly, we will introduce the main methodologies used in our study. Thirdly, we will present and discuss the results on both the validation and the application of our computational model of haemorheology. Fourthly, we will conclude by pointing out the issues that we have addressed; and mention what could be explored in future research. The goal in following this structure is to show where we stand for in the current literature and illustrate both our motivations and contributions to the field.
Atherosclerosis
In the past decades, atherosclerosis and, more specifically, the mechanisms related to the development of atheroma have been the focus of numerous works. According to the literature, plaque develops preferentially near arterial branches and curvatures [22,23,26-29], in humans. Animal models of atherosclerosis require the induction of plaque formation by genetic modifications -- the physiological conditions necessary for the development of atherosclerosis are imposed through the use of transgenic species; the use of a fat rich diet, and the surgical reduction of the arterial diameter through the use of implanted cuffs, in regions that are not usually affected by plaque deposition. Moreover, as indicated above, animal models of atherosclerosis are commonly found in the literature, because the whole plaque’s developmental cycle can be observed and studied within a reasonable time-scale [22,29]. The goal in these animal model studies is to change flow patterns locally, in a way that the required biomechanical environment is artificially created. Researchers from diverse areas with different purposes – from finding bio-factors-related insights to uncover the mechanics of the circulation -- have presented a variety of hypothesis on the mechanisms driving plaque growth, at different stages. Such hypotheses refer to, for instance, low density lipoprotein (LDL) as a transporter of lipids from the liver to the circulation and how it interacts with the diseased endothelium, mainly in the initial stages of the disease. In humans, according to the literature, atherosclerotic plaques can be broadly divided into two main categories: vulnerable (aka. rupture prone, unstable) and stable (aka. fibrous) plaques [6,23,41]. As the plaque develops it invades the lumen when the plaque reaches about 40% of the arterial circumference. At or after this stage, vulnerable plaques rupture and the dripping bio-material can block blood flow in downstream narrower vessel segments, leading to heart attack, stroke and gangrene. Alsheikh-Ali et al. in a 2010 review paper [23] state that among the factors that primarily indicate a higher risk of rupture are a lipid core accounting to more than 40% of the total lesion area, a fibrous cap with a thickness less than 65 μm, a volume of macrophages of about 26%, and an intensive inflammatory process. On the other hand stable plaques are characterized by a thick cap consisting of collagen fibres covering the lesion [23]. In general, the main components of plaques are: necrotic cells, foam cells (thought to be lipid-loaded macrophages), lipids including cholesterol crystals collagen, smooth muscle cells, calcium, elastin and other immune cells. As mentioned, local flow disturbances have been associated with plaque development [8-12,25-29]. Flow regions that present physiologically high values of wall shear stress -- which in large human arteries is between 1.5 and 2 Pa -- induce endothelial cells alignment. This pattern is related to a healthy and functional endothelium, in which inter-cellular gaps are kept under normal levels. These regions are said to be athero-protective. Locations with enhanced migration of macromolecules and cells into the arterial wall are coincident with regions of low shear [40,41]. At those locations, endothelial cells alignment is no longer properly achieved and the process by which the cells are normally renewed (apoptosis) presents critical abnormalities, such as the acceleration of the cells removal, without their subsequent replacement. As a result, inter-cellular gaps are enlarged, which promotes the migration of macromolecules and cells that are related to plaque build-up. Oscillatory shear regions are associated with plaque stabilization [40,41]. At those locations, the plaques are characterized by a thicker fibrous cap, which makes them less prone to rupture [23]. At that stage in plaque development, the plaque growth might be already contained and the risk of plaque rupture reduced: plaques are said to be stabilized. The conclusion is that knowledge on bloodendothelium interaction is a fundamental part of the study of this disease. Among the biophysical processes that we are interested in, wall shear stress (WSS) is an important factor, because this is a key element in the evaluation of the influence of different flow patterns in arterial wall dynamics and, consequently, in plaque development [5-12]. WSS correlates with velocity patterns and are sensed by endothelial cells. These mechanisms contribute to cellular activity [5,7-9]. Additionally, the blood particles might change the flow characteristics [10-12,26-33,37]. Therefore, at sites of increasing cellular activity due to inflammation (vulnerable plaques), the blood particles via changes in WSS might affect the outcomes of atherosclerosis. In this work, we propose a model of haemorheology in which shear stress results from flow characteristics that are influenced by particles. The red blood cells (RBCs) represent about 45% of the total blood volume [45,46]. Therefore, about 4006 RBCs of 6 μm can be found, per cross section, in an 6 mm long and 500 μm thick (diameter) mouse arterial segment, which results in a significant number of blood particles within such a small volume. Indeed, in the mentioned mouse artery, a volume fraction or Hematocrit (Hct in %) of about 0.45 corresponds to about 4.2 million RBCs [37]. Once more, in this case, particles might change both the magnitude and the distribution of shear forces applied on the endothelial cells. The resulting signals are either transduced into chemical responses or transmitted to the surroundings to regulate cellular activity [5,7]. In vivo, the signalling processes driven by endothelial sensing mechanisms account for the non-Newtonian nature of blood. Otherwise, physiological regulation would not be possible, because a natural lack in accounting for the effects of the blood compounds in homeostasis would make humans genetically susceptible to develop atherosclerosis – and they are. However, how genetics influence the development of this disease is not yet fully understood. The former is already a reason why computational models of atherosclerosis might account for blood rheology, in order to be comparable with the in vivo phenomenon. Moreover, although predilection sites for atheroma development have been identified, the reason why plaque develops around those regions is not fully understood. Therefore, while in large vessels the effects of particles are usually neglected due to the characteristic length of the domain, non- Newtonian models that account to local changes in flow characteristics due to blood compounds might contribute to research on atheroma initiation. This is because, at those sites (branches and curvatures), we might expect blood particles to influence both the magnitude and distribution of near wall forces, as they might behave as fluidized particles [34,35] following the fluid streamlines. Our hypotheses about the relevance of representing haemorheology in macro-circulation is also based on the fact that when the endothelium becomes dysfunctional, and local homoeostasis is compromised, changes in mechanical forces due to particles may have an important effect on flow, locally, as the erythrocytes behave as fluidised particles, modifying the shear stress map. Indeed, while a significant increase in recirculation might occur in cases of severe stenosis, by adding the cumulative effects of particle, the net vorticity might be attenuated, if compared to single-phase patterns. Therefore, the behaviour of the blood particles and their interactions with the surroundings might change due to rising constriction. According to the literature [23], in late stages of plaque deposition, a reduction higher than 80% in the arterial cross-sectional area can be observed. This corresponds to more than 50% of reduction in the arterial diameter. Therefore, we infer that under disease conditions, the blood particles should not be neglected. Hence, this work might contribute to the current literature seeking to understand the mechanisms related to both the built-up of vulnerable plaques and the overall plaque progression.
The importance of the influence of the blood particles in atheroma formation
Blood is a shear thinning fluid, which means that its dynamic viscosity (μ) decreases in function of increasing strain rate (DU/Dy). Strain rate dependent viscosity can be a characteristic of non- Newtonian fluids. In Newtonian models, on the other hand, the blood viscosity is assumed constant (Classic Newtonian) or consider its time dependency (Generalized Newtonian) [45,47]. However, instantaneous strain rate approaches do not take into account the strain history [47]. In these models, the restoring forces are neglected and the elastic component of shear is not taken into account. This is valid if either the observation time is smaller than the system response time or the length of reference is significantly bigger than the system’s characteristic length [47]. Therefore, this depends on the level at which the system’s internal structure is observed. In those cases, forces arising from interactions between the system compounds can be neglected. In contrast, if the internal structure of the system influences time-space trends, a closer approximation to reality requires the combination of viscous (Newtonian) and elastic (Hooke) components, in order to mimic strain-stress relations. A way of doing the above was proposed by Maxwell in 1867 [47]. The model is currently named the Maxwell formulation. In it, both the instantaneous and the history dependent strain are combined. This considers dissipative effects and adds memory to the resulting stress equation. This sort of formulation represents non- Newtonian effects in a continuous manner. Overall, blood is represented as a single phase fluid, and extra terms are added to the stress-strain relation [47]. We decided to numerically mimic haemorheology via particulate blood flow. This approach allows the system to be resolved separately, and coupled at the end of each integration time step, which reduces the computational time complexity [18,36,37]. Moreover, disjointed resolutions have the advantage of providing a clear way of implementing the system particularities [18,34-38], using established computational fluid dynamics techniques. This reduces errors due to implementation and facilitates the identification of model inconsistencies. Moreover, good practices in programming lead to modular and, therefore, portable pieces of software, which can be easily adapted to different applications. However, during the coupling stage, imposing conservation constraints might be an issue. We have presented some alternatives for dealing with the most common drawbacks found in the literature, considering our subject of application. These alternative solutions will be presented in the Methodology Section.
The representation of non-Newtonian effects via multiphase flow techniques
The term Multiphase Flow is commonly used to refer to a flow of two or more non-miscible fluids or fluids (continuous phase) and particles (discrete phase). Following the work presented in Ref. [34,35], these flows can be classified according to their relative concentrations (volume fractions) and the characteristic length of the system. Usually, the continuous phase is a liquid or a gas and the discrete phase is made up of solids, encapsulated liquid, and gases. We follow a classification [34,35] that divides the phases into three main categories: dispersed, dense, and sparse. Throughout this work, the term dispersed will be used to refer to a flow regime in which the particles motion is predominantly governed by inertial, surface, and body forces, which implies both that the particles size is significantly smaller than the size of the whole domain and that the particle volume fraction makes the inter-particle free distance (characteristic length) to be large enough, to minimize the particle-particle interaction effects. The term dense (volume fraction beyond about 10%) will be used to refer to a flow regime in which the particles motion is dominated by particle-particle interactions, and the term sparse (volume fraction up to about 0.1%) will indicate the negligible effect of particles on the surrounding fluid, because of their low concentration. The computational time space resolution of a multiphase flow relates the description of the domain via the Eulerian or the Lagrangian representation, the phase coupling, and the phase details (particle tracking or bulk description for instance), which strongly interconnects specific flow regimes with the appropriate numerical approach [32,34,35]. Indeed, in sparse and dispersed regimes, the particles characteristics are usually represented through the Lagrangian approach, although the computational cost may occasionally become excessively high, whether the number of particles grows beyond some extent. In this case, the discrete phase can be statistically treated such that only sample particles are resolved over the whole domain [34,35]. Overall, in the Lagrangian representation, the particles characteristics are followed using the centre of mass of a particle or of a particles sampling, as reference [34,35]. In contrast, the Eulerian approach consists in the representation of particle characteristics at the continuous phase grid nodes [34,35], which is more suitable for large scale problems whether the whole phases can be represented as a continuum. A wide variety of methods can be used to simulate multiphase flows. To mention a few, the Direct Numerical Simulation (DNS) method [48] is a Lagrangian based approach that resolves the equation of motion of individual particles. Indeed, they are considered point-particles, leading to restrictions on their size, which has to be smaller than the characteristic grid spacing. Another usual technique is the Reynolds Averaged Navier-Stokes (RANS) equation method [49]. This approach is particularly suitable for dense regimes, where the characteristics of the discrete phase are averaged over a control volume. In the RANS method the discrete phase is treated as a continuum (Eulerian approach), which means that internal interactions might have minimum effects because of for instance a viscous-dominant flow regime. Resolution at the inter-phase region might be carefully addressed, to avoid the introduction of errors due to numerical diffusion [50]. A variation of the method tracks a set of representative particles and statistically derives the discrete phase properties resulting in an Euler-Lagrange approach [50]. Central to the modelling of multiphase flows is the concept of phase coupling, which can be addressed by means of uncoupled or coupled models [51]. The criteria for adopting an approach or another lies on the level of influence that the phases exert on each other and their internal behaviour [51]. Indeed, if local particle-fluid interactions or their macroscopic effects are negligible, the continuous phase behaves like a single phase flow and it is said to be uncoupled [51]. Otherwise, it is addressed by means of different levels of coupling. The appropriateness of the strategy to be adopted depends on both the flow regime [32-35,48-51] and the particles tendency to follow the fluid streamlines (Figure 1), which is addressed via the Stokes number [52]. Our approach assumes the continuous phase (the plasma) to be an incompressible Newtonian fluid. The discrete phase (the erythrocytes) is modelled in a dense regime. Therefore, our model uses a four-way coupling of twophases interactions (fluid-particle and particle-particle), as previously described in the literature [34,35,52] (Table 1).

Figure 1: The particles in flow behaviour as a function of the Stokes number St [52]. An equation derived from [52] relates the particle’s density (ρp), diameter (dp), and volume (v), with the fluid dynamic viscosity (µ) and the arterial diameter (dc), via the empirical constant  .
.
| Flow Regime | Stokes Number (St) | |
|---|---|---|
| St<1 | St>1 | |
| Sparse | One-way | One-way |
| Dispersed | One-way | Two-way |
| Dense | Four-way | Four-way |
Table 1: Coupling regimes as a function of both the flow regime and the Stokes number [34,52].
The representation of fluid-structure interactions via immersed boundary techniques
The so-called Immersed Boundary Method (IBM) aroused the interest of researchers working on numerical models of multiphase systems due to its capability of dealing with deformable bodies immersed in fluids. Peskin in [53] introduced the method to the solution of fluid domains discretized on uniform Eulerian meshes and solid domains represented by Lagrangian sets. The method was used to simulate intra coronary blood flow [53,54]. The motivation to use this methodology lies in the fact that solid and fluid domains are resolved separately and the global solution is reached by applying the non-slip condition at boundaries. Therefore, the coupling between the Eulerian and the Lagrangian domain consists in applying convolutions that distribute the Lagrangian forces onto the nearest Eulerian points. An alternative representation of the forcing scheme uses feedback mechanisms. This was proposed by Goldstein et al. in [55] and subsequently used in [56-58]. This strategy is based on a spring-dashpot model connected to the Lagrangian points. This is used to correct the error in the Lagrangian coordinates. The challenge is to estimate the appropriate time discretisation [18,58]. A direct formulation for the force was presented by Fadlun et al. in [59] to deal with the former. Overall, the stiffness matrix for the implicit time discretisation is modified to include the desired velocity at each Lagrangian point (collocation method). Uhlmann in [36] proposed a correction for the method presented in [49]. He combines both a projection-based approach for pressure correction as in [60] and a collocation method to adjust the stiffness matrix as in [61]. Spurious oscillations of force were observed during the interpolation of the Eulerian forces into the Lagrangian domain. To fix the problem, Uhlmann used Dirac Delta-like functions determining hydrodynamic smoothed forces that might preserve the global order of convergence of the spatial scheme. The method facilitates the incorporation of deformable and moving structures. However, this lies on uniform Cartesian grids, which is not convenient for modelling systems whose representation requires the use of heterogeneous meshes, as the ones we present here. Therefore, we introduce a method that extends the finest methodology proposed by Uhlmann in [36], to the resolution of systems that are discretized on heterogeneous meshes. Additionally, we couple both the pressure projection [60] and the interpolation of forces iteratively. This is to control the numerical diffusion due to an implicit time-lag, which is introduced by the fractional time step approach [36] that comprises the overall integration scheme.
The mathematical characterization of the blood as a multiphase flow
Our methodology comprises the separation of the system into two major parts, the fluid phase (plasma) and the particles phase. As the majority of particles in blood consists of red blood cells (RBCs), we omit the other components. In our approach, particles are treated in a Lagrangian framework and the particle-particle interactions calculated using sets of particles, which are distributed along the whole blood volume. Moreover, the Eulerian domain is discretized via a staggered grid, in which the scalar quantities are placed at each cell centre, while vectors are represented at the edges [36,37].
The fluid phase: The fluid phase (plasma) is here modeled via the Newtonian incompressible Navier-Stokes equations. These equations read as follows.
Conservation of Momentum:
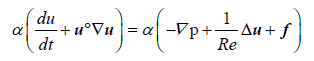 (1)
(1)
Conservation of Mass:
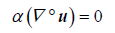 (2)
(2)
Throughout this work we will use the term f to represent different source terms. Here, this term represents the frictional contributions to the momentum (Equation 1). Moreover, the terms Re, u, α, p, and t are the Reynolds number, the fluid velocity, the fluid volume fraction, pressure, and time, respectively.
As indicated above, the source terms arising from forces exerted by the particles are included in the right-hand- side of the Equation 1. These forces are interpolated at each fluid cell, by considering the volume occupied by particles, and the net contribution added under the form of f. These source terms are calculated as in Equation 3.
Source Terms [36,37]:
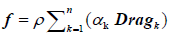 (3)
(3)
The terms ρ, αk and Dragk are the fluid density, the particles volume fraction at a fluid mesh cell k, and the drag force calculated at a fluid mesh cell k, respectively. The calculation of the forces arising from fluid-particles interactions are shown in Section 3.1.2. This includes the drag force.
Physiological data from [10] is used to characterise the plasma. The values of reference are indicated in Table 2.
| Model Assumptions | |
|---|---|
| Parameters | Values of Reference (Fluid) |
Density |
1060 |
Dynamic Viscosity |
0.0037100 |
| Kinematic Viscosity (pa*s) | 0.0000035 |
Table 2: Values of reference to characterise the plasma [10].
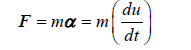
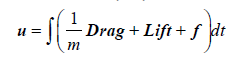
The particles phase: Particles (the erythrocytes) are modelled as soft spheres, in a Lagrangian framework, and the Newtonian second law of motion applied in the characterisation of their behaviour (Equations 4, 5 and 6) [34,35].
 (4)
(4)
 (5)
(5)
 (6)
(6)
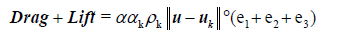
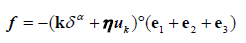
The terms F, m, α, ρk, αk, α, u and uk are the net force acting on particles, the mass of the particle, the acceleration of the particle, the particle’s density, the particles’ volume fraction at a fluid mesh cell k, the fluid volume fraction, the fluid velocity, and the particle’s velocity, respectively. The terms e1, e2 and e3 indicate the components of the fluid-particle contact forces [35]. Table 3 shows the relevant biophysical characteristics of the particles. As indicated above, the forces acting on particles and their counterparts acting on both the fluid and the arterial wall are the drag and the lift (Drag and Lift), plus any relevant sinks and sources (f) that vary with the model assumptions. Here, the term f represents the contact forces arising from both particle-particle and particle-wall collisions, which also generate a torsion in the e3 direction. This will be described in the collision part.
| Model Assumptions | |
|---|---|
| Parameters | Values of Reference (Wall) |
| Density |
1125 |
| Diameter (m) | 0.000006 to 0.000008 |
| Friction Coefficient | 0.1 |
| Coefficient of Restitution | 0.9 |
| Youngs Modulus (Pa) | 4.4e+3 |
| Poisson Ratio | 0.49 |
| Volume Fraction | 0.45 |
Table 3: Values of reference to characterise the erythrocytes [62].
The collisions: The particles deformation and the collisional forces result from both elastic and viscous components [35,62,63]. Similarly, forces due to particle-wall collisions are calculated using a springdashpot model [35,63]. These results in only part of the pre-collisional configuration being restored. A schematic view of two particles colliding is show in Figure 2. represents the resulting deformation due to collision (overlapping). This geometrical notion is used to formulate the equation that governs both the particle-particle and the particle wall collisions. The mathematical representation of the collisions are described in Equation 7 [35], which we use to model both the particles deformation and the particles interactions with themselves and the arterial wall. A classical spring- dashpot model of viscoelasticity is defined by setting α=1 in Equation 7 [35].
 (7)
(7)

Figure 2: A cross-sectional cut illustrating the particles collision plan [35]. The radius and centre of two particles (d and l) colliding are represented via the variables rd, rl, xdand xl. The normal and the tangential directions in reference to the canonical system of reference are represented by n(c2e2) and t(c1e1) -- e1 and e2 are the canonical vectors, and c1 and c2 represent linear transformations in the plan of reference. The variable δ.
The terms f and k in Equation 7 are respectively the collisional net force and the elasticity coefficient (Youngs modulus) throughout each material direction -- which varies in heterogeneous systems. The particles’ deformation due to collision is modelled via the overlapping δ. Overall, the term k δ α in Equation 7 represents elastic effects. The term η uk in Equation 7 represents the viscous effects. The parameter uk represents the components of the collisional system velocity (particle-particle or particle-wall), and η is the coefficient of restitution [35,63], which represents the mechanical energy that is preserved (not dissipated) during collision. This term accounts for the fact that the particles reaction to the contact forces is not fully applied back on their counterparts-the viscous effect. Finally, the terms e1, e2 and e3 indicate the components of the resulting contact force-directional term.
Overall, the coefficient of restitution, the Youngs modulus, and the Poisson ratio of the wall - Table 4; together with the particles properties (Table 3) dictate the rate of dissipation and restitution during collisions.
| Model Assumptions | |||||||||||||||||||||||||||||||||||||||||||||||||||||||||||||||||||||||||||||||||||||||||||||||||
|---|---|---|---|---|---|---|---|---|---|---|---|---|---|---|---|---|---|---|---|---|---|---|---|---|---|---|---|---|---|---|---|---|---|---|---|---|---|---|---|---|---|---|---|---|---|---|---|---|---|---|---|---|---|---|---|---|---|---|---|---|---|---|---|---|---|---|---|---|---|---|---|---|---|---|---|---|---|---|---|---|---|---|---|---|---|---|---|---|---|---|---|---|---|---|---|---|---|
| Parameters | Values of Reference (Wall) | ||||||||||||||||||||||||||||||||||||||||||||||||||||||||||||||||||||||||||||||||||||||||||||||||
| Coefficient of Restitution | 0.9 | ||||||||||||||||||||||||||||||||||||||||||||||||||||||||||||||||||||||||||||||||||||||||||||||||
| Friction Coefficient | 0.1 | ||||||||||||||||||||||||||||||||||||||||||||||||||||||||||||||||||||||||||||||||||||||||||||||||
| Friction Coefficient | 0.1 | ||||||||||||||||||||||||||||||||||||||||||||||||||||||||||||||||||||||||||||||||||||||||||||||||
| Youngs Modulus(Pa) | 3.61e+5 | ||||||||||||||||||||||||||||||||||||||||||||||||||||||||||||||||||||||||||||||||||||||||||||||||
| Poisson Ratio | 0.49 | ||||||||||||||||||||||||||||||||||||||||||||||||||||||||||||||||||||||||||||||||||||||||||||||||
Wall Thickness (as a function of the radius
Results and DiscussionValidating the multiphase technique (shape-based assessment) Firstly, we presented results from computational simulations on idealised models of both a severe M2 and a mild M1 stenosis. These results are comparable with theoretical values from a control-volume approach [71]. However, the difference in results rises with increasing constriction (Tables 5 and 6), which indicates that the theory of the boundary layer (TBL) would be a most suitable approach for estimating the flow characteristics in complex geometries [77]. This was confirmed though the numerical assessment of the application of the TBL (Table 4). A summary on how to calculate the Wall Shear Stress using the TBL can be found in [77]. The figures have shown that in a mild stenosis M1-Table 5; the peak WSS varies c. 0.05% with varying axial refinement. This indicates that axial refinement does not critically affect the present set of simulations. Additionally, comparing our results with data from the literature [10,12], we found a difference of c. 6.5%. However, Reese et al. [12] reported on 10% to 20% of discrepancies among numerical results found in the literature. Therefore, we infer that our methodology reproduces numerical data accurately. The above reported discrepancies increase with increasing Constriction-Table 6. Indeed, the numbers indicate that for a severe stenosis, with a peak reduction in cross-sectional area of about 80%, the differences in results are c. 41%. This increases further by increasing the Reynolds number. Therefore, the theory of the viscous boundary layer [77] was applied in the calculation of the WSS-Table 7. Computing the WSS on the basis of the near wall characteristics via the shape index [12] seems to be a more suitable approach. This has a prominent effect on results. Indeed, the formerly reported differences in data due to rising cross-sectional area reduction and Reynolds number are much diminished - Table 7. Certainly, our results mimic numerical results from the literature [10,12] in c. 97%, regardless both Reynolds number and shape. An experimental approach based on intracoronary ultrasound and angiographic images was applied by Stone et al. in [78-80] to correlate WSS patterns, progression of stable coronary arterial diseases (SCAD), and vascular remodelling, looking at the estimation of arterial regions where plaque accumulates. They found that constrictive remodelling was restricted to zones of low WSS, with and without plaque growth. Our simulations have correctly identified these regions, on the adopted geometrical models. This is important because we need to assure the correct identification of different flow characteristics, as they are associated with arterial wall re-modelling. Indeed, according to Stone et al. in [80], expansive re-modelling in low WSS locations correlates with active plaque progression. Therefore, we infer that our methodology correctly capture the flow characteristics that are thought to be relevant in atheroma (aka. atherosclerotic plaque) progression.
Table 5: Composition of the available CaPO4-containing sealer materials [510].
*Numerical WSS of reference: 0.8480 [10]; Courant Friedrichs Lewy (CFL) number=0.5; Radial Refinement (NFS)=1.1; ED outside the constriction=8.
Table 6: Peak wall shear stress in a severe stenosis M2. The peak WSS (Pa) at the throat is calculated using different mesh refinements defined by the parameters ED and NSF [78]. The Reynolds number is 100.
Table 7: The peak wall shear stress (WSS) at the throat, compared to the literature values, on both a mild M1 and a severe M2 stenosis: Re={100, 500}.Peak WSS (Pa). Validation - The iterative immersed boundary method Secondly, simulations of flow past an obstacle (model FC) were used to validate our novel immersed boundary approach (Table 8).We report trends similar to what is found in the literature [13-21] -- c. 94% of accuracy calculating the Strouhal number (St); c. 90% of accuracy computing the drag coefficient (Cd); and c. 97% of accuracy mimicking the lift coefficient (Cl). Overall, the values on Table 8 indicate similar levels of recirculation. Our Strouhal number indicates that the characteristics of wakes forming downstream of the immersed structure correspond to what is reported in the literature [13-21]. This correlates with the computed lift coefficient which reflects the frequency of oscillation of the periodic phenomenon resulting from the flow disturbances due to the immersed structure. Additionally, as expected, our predictions do not indicate that any resonance might occur. Resonance is a well-known physical phenomenon [20,21]. In models of flow past obstacles, this may occur when the frequency of oscillation of the vortex forming downstream of the immersed body reaches the natural frequency of oscillation of the immersed body. This causes the immersed structure to oscillate with greater amplitude and may lead to the collapse of the entire system [20,21]. The former results are in agreement with our convergence study, which shows that both the time (Figure 6a) and the space (Figure 6b) order of convergence of the iterative IB method are preserved. Moreover, the figures show the effectiveness of the proposed scheme avoiding numerical diffusion. In Figure 6a the solid-dots indicate the accuracy of the resolution with the iterative IB pressure projection coupling shown in Section 3.2 (Equation 15) and the stars represent the uncoupled solution, without the adjustment of the IB forcing for heterogeneous meshes. The latest does not preserve the global order of convergence, differing from the most accurate predictions in about 2 orders of magnitude (Figure 6a)- from c. O(dt3) to c. O(dt). As discussed previously, this is a suitable approach if homogeneous finite difference meshes are used [36]. However, if mesh heterogeneities are introduced, to better fit specific parts of the immersed structure, the conventional IB approach becomes inaccurate-Figure 6a. Therefore, the characteristics of the numerical integration are not preserved. As a consequence, the resolution could diverge, or the achieved solution could not represent the behaviour of the physical system accurately.  Figure 6: Loglog plot of the infinity norm L∞ of the residual velocity normal to the fluid-solid boundary in function of time and space. a) Loglog plot in function of time. The solid-dots represent the results achieved using the iterative IB and the stars represent the results from the application of the classical IB. b) Loglog plot in function of mesh spacing h. The stars represent the iterative IB scheme. In both diagrams, support lines are used, because their slops help identifying the order of convergence of the achieved results.
Table 8: Validation of the bespoke immersed boundary approach. The following flow features were compared to the literature at Re=200: the Strouhal number (St), the drag coefficient (Cd), and the lift coefficient (Cl). Thirdly, the influence of the blood particles was assessed using our multiscale approach. Results on single phase flow simulations are compared with data from [10] – Figures 7 and 8. We found similar trends. Figure 7a shows the normalised pressure drop at the arterial stenosis M1. The minimum value is registered at the minimum crosssectional area  Figure 7: Comparison of single-phase and multiphase pressure values around the site of a mild arterial stenosis. The site of stenosis is at=O. a) Reference pressure values in function of location from Huang et al. [10] (red triangles), compared to our single-phase flow (blue line), and to our plasma-erythrocytes (red line) pressure value results. b) Pressure values in function of location from an extended geometry – black dots illustrates the plasma- erythrocytes pressure values and red triangles indicate the single-phase pressure results (plasma).  Figure 8: Comparison of single-phase and multiphase flow velocities and flow patterns around the site of a mild arterial stenosis (model M1). a) Normalised centreline velocity at the arterial mild stenosis in function of location: reference values from Huang et al. [10] (red triangles), our single-phase flow results (blue line), and our plasma- erythrocytes results (red line). b) Normalised vorticity distribution map: multiphase (top) and single-phase (bottom) flow conditions. The normalised centreline velocity in Figure 8a peaks at the maximum constrictions. The reported result corresponds to the value stated in the literature [10] in c. 90%. The location of peak velocity matches (Figure 8) the minimum pressure registered (Figure 7). The above single phase (plasma) results are compared to data from two-phase (plasma-erythrocytes) flow simulations - Figures 7 and 8. The addition of blood particles (erythrocytes) had a pronounced effect on the flow characteristics. First, the pressure drop is attenuated in c. 30%, at the maximum constriction, as seen in Figure 7. We infer that this is caused by the flow deceleration due to particles. Moreover, the focal nature of the observed phenomenon suggests that the distribution of particles modulates flow laminarization, as peak concentration might be registered around the maximum constriction. Second, the figures show that the two-phase peak velocity is c. 28% lower compared with the single phase peak value - Figure 8a. This affects recirculation - Figure 8b. In presence of particles, recirculation develops much slower -- Figure 8b top; which compares to rising viscous effects. We expect this to result in differences in both the wall shear stress and the apparent viscosity. Single phase patterns are much more pronounced - Figure 8b bottom. Figure 8 suggests that the Newtonian blood flow assumption leads to recirculation growing faster and the viscous phenomena being weakened. Figure 9 illustrates differences in phase velocities, along the arterial segment. Near the inlet, both the fluid and the particles phase velocities are about the same, because the particle injection is set using the fluid inlet velocity profile - Figure 9a. The more the flow progresses towards the stenosis, the more the fluid and the particles velocities differ. Regardless of the fact both velocity profiles become flatter - Figure 9b, at the maximum constriction (Figure 9c), the particles velocity almost completely plateau out. Finally, downstream of the constriction Figure 9d, this gradually adjusts to the fluid velocity. The data gathered in this study suggests that arterial narrowing due to atherosclerotic plaque deposition causes a focal peak in particle concentration. This has fostered debate on whether the accumulation of erythrocytes could lead to significant differences in flow trends, at the location where plaque forms. Therefore, the key features that Figures 7, 8, and 9 convey, motivated further investigation. In the literature, much of the current debate revolves around flow characteristics related to inflammatory signalling pathways [39,43,44]. Erythrocytes might modulate mechanical forces that drive inflammation. Indeed, we observed that the velocity distribution and, consequently, the shear map correlates with the particle distribution (Figure 10), at predilection sites for atherosclerotic plaques deposition. Arterial inflammation is a physiological process that is regulated by endothelial wall shear stress [80]. Therefore, changes in either the intensity or the distribution of shear forces sensed by the endothelium might affect the mechanisms driving inflammation. We registered differences varying from c. 5% to c. 45% in the axial velocity, as shown in results from the single phase (Figure 10a) versus the two-phase (Figure 10b) simulations. This correlates with the distribution of particles (Figure 10c). In a realistic model, it is crucial to take into account the influence of the blood particles on atherosclerosis initiation and development, regardless the local particularities. Indeed, there is overwhelming evidence corroborating the notion that under disease condition, focal changes in arterial geometry and, consequently, in flow features might require the inclusion of the blood particles in the resulting computational model. Changes in flow characteristics due to particle-particle and particle-wall dynamics was formerly reported by Sugiyama et al. in [31]. They correlate particle-particle and particlewall interactions with the particle initial arrangement, flow rate and apparent viscosity in a Poiseuille flow. There, the initial arrangement of the particles resulted in different sequences of interactions, which affected the particle shape and motion. Therefore, the initial conditions might also modify the instantaneous flow rate. The findings reported by Sugiyama et al. provided insights on the role of the erythrocytes in blood flow. Our results focus on growing haematocrit. As formerly reported, the figures might vary with changes in the particles’ initial configuration [31]. However, we have not assessed flow under different particle injection conditions. The above mentioned phenomena result from the momentum interchange between the particles and the flow, which is not considered in Newtonian approaches. Indeed, data from direct numerical simulations of flow past solids were analysed by Zastawny et al. in [32]. There, shape-based correlations were designed to study fluid- structure interactions and the resulting drag, lift, and torque. Their findings support our results by illustrating the variation of mechanical forces due to solids embedded in the fluid. However, their analysis does not focus on macro-circulation, which is an important element of flow studies related to the development of atherosclerosis. As stated previously, haemorheological studies found in the literature usually focus on micro-circulation. Looking at the macro-circulation, we have found that rising haematocrit correlates with increased flow laminarization (Figure 11b), as a consequence of both, decreasing velocity (Figure 11b) and increasing shear stress (Figure 11a). This was observed by comparing both the non-Newtonian (Figure 11 - Hematocrit (Hct) ≠ 0) with the Newtonian blood flow simulations (Figure 11 - Hematocrit (Hct)=0). Indeed, the apparent viscosity (Figure 11a) rises in function of the Haematocrit. These changes in flow features indicate an increase in the viscous effects because of both the raise in shear stress and the flow laminarization, which is mechanically induced by the erythrocytes due to the plasma-erythrocytes interactions. Therefore, these results provide confirmatory evidences that the findings shown in Figures 7-10 might motivate research on the role of haemorheology in models of atherosclerosis. Jung et al. [33] compared the results of a single and a two-phase transient 3D non-Newtonian simulation on an idealized model of human coronary artery curvature considering pulsatile effects. As in [33], we also identified an increase in apparent viscosity (Figure 11a) correlating with flow laminarization (Figure 11b), as mentioned above. This corresponds to a peak erythrocytes concentration (Figure 10). Additionally, our results suggest that in non-Newtonian simulations, wakes forming downstream of the stenosis might be much weaker (Figure 11b) - (decreasing vorticity); if compared to Newtonian simulations (Figure 11b) - (Hct=0.0). This is a consequence of the decreasing velocity (Figure 11b). Therefore, the erythrocytes might be a key factor in the evaluation of localised haemodynamical trends and, consequently, in modulating focal inflammation. Figure 11 illustrates differences of about 8% comparing Newtonian and non-Newtonian blood flow features. This apparently low variation might represent a significant change in cellular activity that modulates arterial inflammation, because cellular functions highly depend on time-space changes in mechanical forces, which are sensed by the endothelium [5,7-9]. Therefore, the reported deviations in the flow characteristics, and the consequent changes in both the intensity and the distribution of mechanical forces (Figures 10 and 11) along an arterial segment might affect plaque deposition. However, we are aware that on the basis of the evidences currently available, it seems fair to affirm that changes in flow due to the blood particles have a pronounced effect on inflammatory signalling pathways. Further evidences supporting this hypothesis may lie in experimental research combining cell biology, microfluidics, and computation.  Figure 9:Comparison of fluid phase (plasma) and particle phase (erythrocyte) normalised axial velocities in function of normalised radius r at different cross-sectional location along the arterial segment M1-The arterial radius R is the normalisation factor: a) close to the inlet x/X=-5; b) near the beginning of the arterial constriction x/X=-2; c) at the minimum cross-section (stenosis) x/X=0; d) downstream of the stenosis x/X=2.  Figure 10: Rheological flow in a mouse carotid artery (model MA), at Re=58: Cross-sectional view of the stream-wise velocity. a) single-phase flow velocity in m/s; b) multiphase flow velocity in m/s; c) fluid distribution at an arterial crosssection (0 - 100%) (Image sent to the World Biotechnology Conference 2016).  Figure 11: Blood flow simulations on a mouse carotid artery (model MA), Re=58. The haematocrit (Hct) varies from 0.0 (single-phase) to 0.45 (physiological): a)Evolution of normalised peak wall shear stress (wss/WSS) and the normalised peak apparent viscosity (μ_(ap)) in function of the haematocrit content; b) Normalised vorticity (ω/Ω), the normalised x-component of velocity (u/U) and the jet Reynolds number (Re_jet) plotted against haematocrit content. The y-axis represents the variation of the normalised variables shown in the legends. Conclusions, Final Remarks and Future ResearchIn this work, we presented a multi-scale haemorheological computer-based model of blood flow in arterial segments affected by the abnormal deposition of metabolites such as lipids in the context of atherosclerosis development. We have developed two modelling techniques: a multiphase flow approach for haemorheology and an immersed boundary methodology. We have validated both of these techniques [10-21] and overcame fluid flow modelling related numerical drawbacks reported in the literature [31,36,53-61]. The two bespoke modelling techniques were coupled to obtain an integrated realistic multi-scale computational fluid dynamics technique that describes physiological blood flow conditions relevant to atherosclerosis development. Validation: The multiphase technique we presented results from DNS simulations in arterial segments, for both a mild and a severe stenosis. The results are comparable to numerical data from the literature [10-12] and pronounced similarities were observed. Moreover, we found that the theory of the boundary layer [77] might be the most suitable approach for estimating the flow characteristics in complex geometries. Additionally, our computational model was improved via a mesh sensitivity study, which included the application of the viscous boundary layer theory [71]. This supported defining the characteristics of the computational domain and, consequently, the adjustment of the mesh characteristics. Comparing the results of Newtonian and non-Newtonian simulations, we found that the velocity distribution and, consequently, the shear map correlates with the particle distribution. Indeed, changes in flow characteristics due to particle-particle and particle-wall dynamics correlated with both the flow rate and the apparent viscosity. Our results focused on growing haematocrit. However, we infer that the initial arrangement of the particles might result in different sequences of interactions, which might affect the particles shape and motion. Therefore, the initial conditions might also modify the instantaneous flow rate. Hence, the assessment of flow under different particle injection conditions might be the subject of future research. Validation: The iterative immersed boundary method we validated a new methodology for simulating the interactions between fluids and solid structures [13-21]. The methodology comprised of a fractional-step method with pressure projection to impose the mass conservation constraint, which was carried out iteratively, and coupled with the interpolation of forces, which arouse from the fluid- structure interactions. In many applications and particularly in models of blood flow in diseased arteries, precision in determining the mechanical forces resulting from the flow characteristics is important. Therefore, we assured that mass was not spuriously created or consumed. Indeed, our methodology guaranteed that the force and torque were interpolated among the Lagrangian (solids) and the Eulerian (fluid) domains integrally. Our results were comparable to numerical data from the literature where similar levels of recirculation were observed [13-21]. Moreover, the computed Strolhal number indicated that wakes forming past the obstacles and the characteristics of the resulting von Karman Vortex Street were analogous to what is found in the literature. Indeed, our results indicated similar levels of disturbances resulting from the balance between the lift and the drag forces. Moreover, the computed lift coefficient reflected the frequency of oscillation of the periodic phenomenon, resulting from flow variations. These disturbances were induced by the immersed structure. Regarding future improvements, to speed up convergence, a pre-conditioner might be implemented using functional-based matrix treatment, to avoid breakdowns. Moreover, the inclusion of mathematical terms that account for mass transport and the concentration of chemical species might be of relevance, while evaluating the signalling pathways that contribute to inflammation. Moreover, continuous models of blood rheology may be tested. The application of a new multi-scale approach resolving non- Newtonian blood flow in diseased arteries Our simulations correctly identified regions of low Wall Shear Stress (WSS) that correlates with vascular remodelling, with and without plaque growth. This is important because re-modelling in low WSS locations correlates with plaque progression [79]. Therefore, we infer that our methodology correctly capture the flow characteristics that are associated with plaque progression. The reported differences in flow rate and apparent viscosity resulted from the momentum interchange between the particles and the flow, which is not considered in Newtonian approaches. Here, we conducted an in-depth analysis of particulate blood flow and discussed its relevance in understanding atheroma formation. We found that rising haematocrit correlates with increasing flow laminarization, resulting from decreasing velocity and increasing shear stress, if compared with Newtonian blood flow [10-12]. This corresponded to a peak in the concentration of the erythrocytes. Additionally, our findings indicated that in non-Newtonian simulations, wakes forming downstream of the stenosis might be much weaker in non-Newtonian blood flow simulations. Therefore, the erythrocytes might be a key factor in modulating mechanical forces that drive focal inflammation. As formerly stated, mechanical forces affect both homeostatic functions that maintain a functional endothelium, and drive abnormal signalling pathways, under disease conditions. The wall shear stress correlates with velocity patterns and is sensed by endothelial cells [5-8,80]. This mechanism contributes to cellular activity. Therefore, at arterial segments experiencing increasing cellular agglomeration and activity due to inflammation, the blood particles alter flow characteristics and might affect the outcomes of atherosclerosis. This phenomenon is here simulated computationally. The results suggested that haemorheology might be considered in computational models of atherosclerosis. AcknowledgementsThe author is grateful to all those who provided service and advice. Dr. Kis (Imperial College London and the Institute for Integrated Economic Research) is thanked for revising the manuscript. Dr. Simeoni is thanked for kindly receiving the author during a research visit at the University of Sao Paulo (USP). Dr. Mehta (Imperial College London) is tanked for providing the MRI information that allowed the author to computationally build up the structural model MA. Mr. Rochford (Imperial College London), Mr. James (GridPro - www.gridpro.com), Mr. Burbidge (Imperial College London), and Mr. Smet are thanked for the technical support. This work is partially supported by the Santander Mobility scheme, the Ministerio de Ciencia y Innovacion de España (MICINN), the FAPESP (Brazil), and the EU/ UK governance. References
Citation: Pereira GC (2016) A Multiscale Haemorheological Computer-Based Model of Atherosclerosis: An In-Depth Investigation of Erythrocytes-Driven Flow Characteristics in Atheroma Development. J Biomed Eng Med Devic 2:119.
Copyright: © 2016 Pereira GC. This is an open-access article distributed under the terms of the Creative Commons Attribution License, which permits unrestricted use, distribution, and reproduction in any medium, provided the original author and source are credited. | |||||||||||||||||||||||||||||||||||||||||||||||||||||||||||||||||||||||||||||||||||||||||||||||||
 . Downstream of the stenosis, the normalized pressure increases. However, flow does not recover to the fully developed peak value observed upstream of the stenosis. We infer that this results from a shorter downstream arterial segment. To overcome this drawback, the computational domain was extended to account for the flow-based re-entrance region. As a result, the flow progresses towards the expected fully developed pattern-Figure 7b.