Advanced Techniques in Biology & Medicine
Open Access
ISSN: 2379-1764
ISSN: 2379-1764
Research Article - (2023)Volume 11, Issue 1
By predicting the implementation of intelligent lockdown before the onset of waves, this research offers an efficient method to address the COVID-19 pandemic. This study introduces unified Autoregressive Integrated Moving Average (ARIMA) and Seasonal Autoregressive Integrated Moving Average (SARIMA) models that are capable of predicting lockdowns in more than 200+ nations. The proposed model was trained over 18,000 dataset of 237 nations and has a response time of 2.5 months. The auto-ARIMA model was used to pick the initial variations of the model parameters and then the optimal model parameters were found based on the best match between the forecasts and test data. The models reliability was evaluated using the analytical methods Auto Correlation Function (ACF), Partial Auto-Correlation Function (PACF), Akaike Information Criterion (AIC) and Bayesian Information Criterion (BIC). These models are trained using data acquired from World Health Organizations data repository. The two ARIMA and SARIMA models are clearly gaining an advantage over other studies by having a rapid response time. Besides, a brief comparison of trained ARIMA and SARIMA models are presented and the ARIMA model gained an upper hand due to its accuracy. Additionally, the models are able to predict confirmed death and confirmed cases of COVID. This research shows to be highly beneficial for decision-making about the implementation of smart-lockdowns and could provide another dimension to time-series analysis, which is strongly dependent on models having better response time.
ARIMA; SARIMA; Smart-lockdown; Autocorrelation function; Partial autocorrelation function; COVID-19
The novel coronavirus was first identified in Wuhan, China in December 2019. The first case of the disease was reported to the World Health Organization (WHO) on December 31, 2019. COVID-19 is caused by the Severe Acute Respiratory Syndrome Corona Virus-2 (SARS-CoV-2). It belongs to the coronavirus family, which comprises viruses that may infect both animals and humans. The virus is considered to have started in bats and spread to humans. This highly infectious strain of corona virus has already infected over 485,243,022 cases globally and killed 6,137,553 deaths. The previous corona viruses, SARS and MERS, were not as infectious and persistent as the COVID-19 as it has been called. The uncertainty and lack of clarity further exacerbated the issue and many nations were infected with the virus. The virus is extremely infectious and causes death due to respiratory failure. The virus’s distribution has differed between nations due to variances in epidemiological circumstances and diagnostic capabilities. Many nations throughout the world have been affected by Covid-19. The virus has infected people of all ages in practically every country. Germany, France, Italy, Spain and the United States have been hit the worst [1].
The proposed machine learning model in this study is a generalized model that means it is capable of making predictions for over 200+ countries having same parameters which is trained over World Health Organization’s data consisting of data for 237 countries, the only requirement to develop this model is a dataset that contains attributes as stated in the meta-data [1]. This study is a novel application of the time series forecasting for COVID-19 data. Additionally, this model only focuses on forecasting lockdown periods, thus less data is required for training since the model won’t be forecasting on daily basis thereby increases the response time.
A lot of work has been accomplished in the related areas of research. In the study, there is significant utility in having a prognosticative model for COVID-19 mortality that’s primarily based entirely on demographics and underlying conditions, and that doesn’t need initial symptoms or biopsy findings [2]. There are many beneficiaries of such a model. Specifically, this can facilitate telemedicine for patients who test positive, warn patients unaffected by COVID-19 of potential risks, and undertake precautions. It can be utilized by the government to put intelligent lockdown techniques into place. Research is conducted to build a short-term predictive model tracking disease cases using the Poisson distribution for the number of daily incidences and the gamma distribution for the serial period to predict the future occurrence of COVID-19 [3]. Second, calculate the reproduction amount on the assumption that it would remain consistent for a brief period of time. Finally, create hypothetical incidence cases based on the posterior distributions of the current rate of transmission assuming this rate remains unchanged or changes by a small amount. The following is a study to predict the spread of COVID-19 in the United States under various resumption strategies. The model predicts that the number of COVID-19 cases will initially increase exponentially at the onset or shortly after the resumption of the infectious event, but then settle into a stable, slightly diminishing protracted stage of disease transmission. In contrast to standard Susceptible Infected Recovered (SIR) models, this pattern is consistent with the number of COVID-19 cases reported in the United States. A prediction for the incidence of new COVID-19 cases is based on various social distance criteria. It concludes that reducing social distance will significantly increase the number of COVID-19 cases [4]. And a comparative study in to analyze and forecast the COVID-19 outbreak in India [5]. In India, the adopted states of Maharashtra, Andhra Pradesh, Tamil Nadu, Karnataka and Uttar Pradesh. Three categories of forecasts were made using the ARIMA and prophet time series forecasting models: reported cases, fatalities, and recovered cases. Followed by much more such research on COVID-19 data.
The usage of ARIMA and SARIMA model in studies shown in Table 1 are similar to the study in this research paper, but the results are different and focus on forecasting lockdown periods i.e. start and end time of lockdowns during the crisis (Table 1) [6-9].
| S.No. | Reference Paper | Remarks |
|---|---|---|
| 1 | [6] | Study conducted on 16 countries to forecast the spread, recovery and confirmed death cases due to novel coronavirus. This paper suggests the use of new Autoregressive Integrated Moving Average (ARIMA)/Seasonal Autoregressive Integrated Moving Average (SARIMA) models for each country individually. The discussed models required 7 months (January 22 to August 3, 2020) response time. |
| 2 | [7] | This study includes a comparison between Gated Recurrent Units (GRU), Long-Short Term Memory (LSTM), ARIMA and SARIMA to forecast the trend of COVID-19. Response time for the models reported in this research is 6 months. |
| 3 | [8] | This study reports the use of ARIMA model to forecast the COVID-19 confirm cases trend for 5 countries including India, Russia, Spain, US and Brazil. Total infected cases from the stated five nations are used for training in a daily time series approach from February 15 to June 30, 2020, i.e. response time of 4.5 months. |
| 4 | Proposed | Study conducted on 235 countries (as stated in WHO data repository) and developed a unified ARIMA/SARIMA model that works efficiently for 200+ countries. The said models were trained over 18,000 dataset of 237 nations, i.e. response time of 2.5 months approximately. |
Table 1: Models reported with similar studies for COVID-19 forecasting.
This paper is organized as follows. After a brief introduction to the research problem, a theoretical framework on ARIMA and SARIMA is presented in Section 2. Theoretical Framework discusses the mathematics and applications of ARIMA and SARIMA respectively. Section 3 introduces the Methodology for the research. The initial step to select the parameters of the proposed ARIMA and SARIMA model using ACF and PACF is discussed. Followed by model design and descriptions of ARIMA and SARIMA model respectively. Section 4 presents the observations for the ARIMA and SARIMA forecasts. Finally, section 5 concludes the paper by presenting results and future scope of this study. The APPENDIX presented the verified results for countries such as Brazil, South Africa, Chile, Ghana and Canada.
This study focuses on the Auto-Regressive Integrated Moving Average (ARIMA) and Seasonal Auto-Regressive Integrated Moving Average (SARIMA) machine learning algorithms to create a machine learning model which is capable of forecasting lockdown periods for novel coronavirus (Figure 1).

Figure 1: Representation format of Auto-Regressive Integrated Moving Average (ARIMA) and Seasonal Autoregressive Integrated Moving Average (SARIMA) Model.
Autoregressive integrated moving average (ARIMA): Developed in 1970, the Box-Jenkins forecasting system is sometimes called ARIMA. In essence, it is an extrapolation technique that forecasts the underlying variable using past time series data. The ARIMA model must be identified, estimated, and evaluated, which are the three processes in the model estimation process [9]. Any variable’s future value is regarded in this as a linear function of its preceding values and errors, which are expressed as (Figure 2).

Figure 2: Flowchart depicting the entire Box-Jenkins model training process.
Autoregressive Model, a statistical model known as the AR model illustrates how one variable depends on a previous time period. In this model, the data Xt is dependent on its prior values. For instance, the model MA(p) , can be written as p of its previous values.
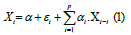
Where, εt is the error and α1, α2, α3,..., α4 are coefficients. The order p for the MA(p) model can be chosen based on the PACF plot’s significant spikes. The slow decay of the ACF plot is another sign of the AR process.
Moving Average (MA), the weighted average of prior errors is used by the MA(q) model to determine its forecast value. In time series data, it is mathematically derived that the MA model has the capacity to comprehend patterns and trends. For instance, MA(q) for a data Xt can be described as
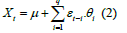
where, μ is the series’ mean, θ1, θ2, θ3,..., θq are coefficients, and εt-1, εt-2 , εt-3 ,..., εt-q are errors with a normal distribution having zero mean and standard deviation to be unity. (also known as white noise). In comparison to the AR model, we can determine the value of q if the ACF plot has a significant cut after lag q for model MA(q) . The slower decay of the PACF plot is another indication of the MA process. Now, an ARMA( p, q) equation can be formulated to be
Now an integration operator d can be introduced, defined as follows, to help deal with non-stationary data.
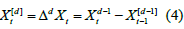
where d is the order of differencing and Xt[0] = Xt.
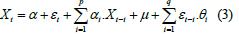
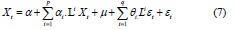
Now that we can fit an ARMA( p, q) model to Xt[d] instead of Xt , we get the equation for ARIMA( p,d,q).
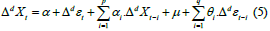
Here, Xt is the value predicted for the variable, which is calculated by adding the total of its arbitrary error term εt that occurred in the ‘ t ’ time period and its lag variables in the previous ‘ t ’ time period. The coefficients are αi and θj. Here, p and q stand in for the moving average and autoregressive lags, respectively. The Moving Average component (MA) is represented by the second half of the equation, while the Autoregressive part (AR) is represented by the first half of the equation from α0 to αp.Xt-p. Consequently, the whole equation is known as the ARMA( p,q) model. The level at which the dependent variable Xt stays static is indicated by the symbol I (d) , which stands for the order of integration. In order to account for the dependent variable’s lag, the random error from estimation, and the sequence in which the variable becomes steady, ARIMA models are stated as ARIMA( p, d,q) . Plotting a correlogram with the Partial Autocorrelation Function (PACF) and Autocorrelation Function (ACF) will reveal the order of and q [10].
An equation for ARIMA(5,1,5) can mathematically be represented as,

Applications of ARIMA: There have been earlier studies on COVID-19 data to forecast the spread using various supervised learning methods and other hybrid models [11,12]. In this paper, the ARIMA model has been used to forecast the time period at which a lockdown must be imposed over various regions/ countries. One of the studies that have been completed on COVID-19 data using the ARIMA model is to forecast the spread of COVID across nine countries [13].
ARIMA model is popular for its usage in forecasting stocks. In, the automatic ARIMA algorithm is discussed to forecast stock returns from 50 stocks of the Indian National Stock Exchange’s minute-wise records [10]. And in the author recreates the ML model for stock market prediction to that of a weekly version of SAARC (India, Sri Lanka, Pakistan) countries using a hybrid model of ARIMA and RNN which decomposes the time-series into its linear and non-linear data components of stock prices [14]. Additionally, research of fifty-six equities from seven sectors is done in the report [15]. The stocks chosen are all listed on the National Stock Exchange (NSE). The set empirical study will use data from the last 23 months. The ARIMA model’s accuracy in forecasting stock prices was tested. The best ARIMA model was chosen using AIC. This study also looked at how changing the time span of earlier or past data affected accuracy. The research provides a hybrid technique for predicting stock prices that makes use of the ARIMA and SVMs models’ particular strengths. The organized selection of optimal parameters of the hybrid model is of significant relevance for future research [16].
There have been many other uses of the ARIMA Model in the latest AI technology. The ARIMA model is used to predict rainfall in certain regions using various parameters, there is a study of the ARIMA Model predicting the rainfall of the climatological station of Banjarbaru with the help of the Kalman Filter, even so, the ARIMA Model is used to an extent of making hybrid models with Long Short Term Memory (LSTM) to forecast drought using SPEI data [17,18].
Amongst the most important tools used by policymakers throughout the world is to make decisions concerning the forecasting of energy consumption in emerging nations. Most early research in Turkey used multiple statistical modelling techniques. But on the other side, time-series forecasting typically results in better outcomes since expected demographic and economic features typically deviate from the actual results. This study used ARIMA, and SARIMA methods to predict Turkey’s primary energy consumption from 2005 to 2020 [19].
A study to develop a forecasting machine learning model to forecast inflation in Kenya is presented in [20]. And in the light of both monetary and revenue-based policymaking, inflation forecasting is critical. In Kenya, like in any other nation, inflation projections are envisioned to allow the Central Bank of Kenya (CBK) to maintain some control over future inflation. In order to model and forecast inflation in Kenya, the use of both ARIMA and GARCH approaches in this work. The results indicated that inflation will rise.
Forecasting demand is a crucial part of supply chain management. It is one of the most essential planning techniques a firm may apply in the future because of its link to other business activities. An ARIMA model for forecasting demand for completed goods in grocery stores is being developed using the time-series Box- Jenkins method [21]. Numerous models are built using historical demand data, and four performance metrics: standard error, maximum likelihood, Schwartz Bayes’ criterion, and Akaike’s criterion are used to determine which model has the best performance. ARIMA (1, 0, 1) is the chosen model to minimize the four previous criteria. The outcomes point to the possibility of using this model to simulate and estimate future needs in the food manufacturing industry. In this sector, these results will give managers reliable criteria for making decisions.
Seasonal autoregressive integrated moving average: SARIMA is an extended algorithm that has a seasonal component along with the Auto-Regressive Integrated Moving Average (ARIMA) method. The model assumes that the WHO COVID-19 data comprises trends, seasonal components, and irregular terms.
For ARMA( p,q) equation we will use L operator, which denotes
the lag operator, where 
The equation can be further represented by a polynomial operator, here polynomial operator results in
 , thus we obtain
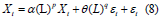
It can be assumed that ARIMA( p, d,q) equation will turn out to be

Now, using seasonal lags and an ARMA(P,Q) model on the differenced values, we can extract any remaining structure. In other words, we use Ls rather than the standard lag operator L . Once more, P and Q are seasonal time lags.
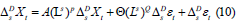
We can now apply another ARIMA( p, d, q) model to ΔDsXt by multiplying the seasonal model by the new ARIMA model in order to remove any remaining seasonality and obtain a mathematical representation of SARIMA( p,d,q)( P,D,Q, S) . Thus, the equation for SARIMA(5,1,5)( 1,0,2,9) can be formulated by replacing the values in the equation (11).

The SARIMA models are created using the approaches described in this article. The order of seasonal differencing is determined by the OCSB test [22]. Then the order of differencing is established by the KPSS unit-root test [23]. The order of the autoregressive and moving average components, p , q , P , and Q, is then measured by traversing the model space using stepwise processes. Finally, the best model is selected using tests based on AIC or BIC and estimated residuals from Oliveira et al. [24-27].
Applications of SARIMA: The study on the SARIMA model has shown that this model has various uses in forecasting data related to-Weather and Temperature forecasting, fire frequency or accidents forecasting, healthcare industry, Tourism, and the financial sector [28-32]. Talking about the healthcare industry, the current paper deals with the analysis and forecasting of region-wise smart lockdowns. Paper describes a SARIMA Model capable of forecasting monthly temperature values in Ghana’s northern area [28]. The SARIMA (1,0,0) (1,0,0) (12) is the bestfitting model, according to the results. The model produced will aid in the development of future agriculture and tourist initiatives in the region.
A study to look into the implementation of the SARIMA model is conducted to predict the fire accident frequency as studied in reference Ma et al., [29]. Here the authors have worked on the China Fire Service Data from 2004 to 2018 and developed an optimized predictive model SARIMA (1,1,1) (1,1,1) (12). It is claimed to have increased the accuracy of the model by 11.5% with a root mean square of the predicted data from 2018 to 2019 to be 2826.93. This result may provide a better understanding of fire aggregation laws and provide theoretical support for fire protection and fire protection activities by fire departments.
Qi et al., [30] is a comparative study of SARIMA and Seasonal Auto-Regressive Fractionally Integrated Moving Average (SARFIMA) to predict the incidence of Haemorrhagic Fever with Renal Syndrome (HFRS). Its conclusion states the better predictive performance of SARFIMA over SARIMA with 6.7% Root Mean Square Error which is 5% less than the SARIMA model. Moreover, there are studies that are able to predict the dengue cases in Campinas, State of São Paulo, Brazil [33]. The model is based on the monthly incidence of dengue from 1998 to 2008. And is tested using data gathered between January and December 2009. SARIMA (2,1,2) (1,1,1) (12) was found to be the model that best suited the data. The number of dengue cases in a given month may be anticipated using the number of dengue cases one, two, and twelve months before, according to this model. The anticipated 2009 numbers are quite similar to the actual ones. And a study is conducted in KwaZulu-Natal, South Africa to predict monthly malaria cases [34]. The research was conducted utilizing a two-part clinically confirmed monthly malaria case dataset. The training dataset was used to create a SARIMA model using the Box-Jenkins technique from January 2005 to December 2013, while the testing dataset was used to evaluate the forecast given by the best-fit model from January to December 2014. As a consequence, the SARIMA (0,1,1) (0,1,1) (12) model may be used to model and predict monthly malaria incidences in KZN.
Cross-correlation functions are used to create comparative structures using different models in monthly natural gas production and consumption forecasts to evaluate relationships between extrinsic variables. In addition, for the first time in a literature review of study [35], SARIMA model for monthly predictions of US natural gas production and consumption will be tested using the proposed method. The performance of the model is compared with SARIMA(p,d,q)*(P,D,Q)S. The Root- Mean-Squared Error (RMSE) and Mean Absolute Percentage Error (MAPE) results show that the best-fit model is superior. This strategy forecasts monthly natural gas production and consumption in the United States by 2025.
A technique to predict the detection duration of different objects used in the reported smart home context. Prognosis will help quantify an elderly person’s health and alert them to routine or abnormal behavior in daily activities. Seasonal Automatic Regression Integrated Average (SARIMA) procedures are used in health modelling to predict the functioning of common objects used by an elderly person living alone [36].
The purpose of the paper’s research is to determine the utility of analytics models in developing a system capable of providing an approximate estimate of future pollution levels within a reasonable confidence interval [37]. For time-dependent data, conventional linear regression approaches are shown to be inadequate. In this context, a time series forecasting technique is employed to estimate future levels of several contaminants with a high degree of confidence. The experimental investigation of forecasting for Bhubaneswar City’s air pollution levels shows that the suggested strategy employing SARIMA and the Prophet model is successful.
Some Machine Learning Models have also been trained in hybrid mode with the SARIMA Algorithm. For forecasting the daily tourism arrivals at Macau SAR, China, the SARIMA-LSTM Hybrid model (using 2-year tourism data) is developed by the authors in reference Wu et al., [31] which claims to outperform the previously used SARIMA model for the same purpose. In addition, the hybrid SARIMA-FFNN model was tested to predict Kediri money inflows and outflows using hidden layers selected by the minima of Mean Absolute Percentage Error (MAPE) and Root-Mean-Squared Error (RMSE). The hybrid SARIMA-FFNN shows excellent predictive performance [32].
A hybrid model study that combines the benefits of both strategies is provided [38]. This model, executed in four steps, (SARIMA-ANFIS) incorporates a Seasonal Auto-Regressive Integrated Moving Average (SARIMA) and a new hybrid model, the Adaptive Neurophagy Inference System (ANFIS). In the first step, the data is pre-processed for linear component modelling. In the second stage, the SARIMA model estimates linear and nonlinear factors. In the third phase, the linear and non-linear components of the decomposed inflow and the validity of the parameters of the SARIMA model are examined in a specific fitting test. After selecting the component’s sovereign, ANFIS models the non-linear component in the fourth step. This technique uses ANN modelling (SARIMA-ANN model) instead of ANFIS. The results show that the accuracy of ANFIS is more than ANN and SARIMA coupled-ANN models, making SARIMA-ANFIS the best of all. A similar study in is employed where a new hybrid approach SARIMA-GEP combines a Seasonal Autoregressive Integrated Moving Average (SARIMA) model with a Gene Expression Programming (GEP) model to predict monthly reservoir inflows [39].
The data for this study was acquired from World Health Organization (WHO). Figure 3 is the metadata for the COVID data being used to analyze and develop forecasting machine learning models.

Figure 3: Meta-data for WHO COVID-19 dataset used in this study.
ACF and PACF
The data is tested for ACF and PACF plots. This is a very crucial step in getting the values of AR(p), I(d), and MA(q) to build the optimized model. Although the Automatic ARIMA function is used that finds out the best-fit model by minimizing the Akaike Information Criterion (AIC), Figure 4 shows the full implementation of the automatic ARIMA function which shows the testing of various ARIMA models. Calculations of the graph for the Auto-Correlation Function (ACF) and Partial Auto- Correlation Function (PACF) are made [40].

Figure 4: Testing of various Autoregressive Integrated Moving Average (ARIMA) models by Automatic ARIMA function.
ARIMA using ACF and PACF for new cases and new deaths: The ACF and PACF plots are depicted in Figures 5-8, for ARIMA model that helps in determining the initial parameters for the ARIMA model (Figures 5-8).

Figure 5: Simple Autocorrelation Function (ACF) plot for new deaths data.

Figure 6: Simple Partial Autocorrelation Function (PACF) plot for new deaths data.

Figure 7: Simple Autocorrelation Function (ACF) plot for new cases data.

Figure 8: Simple Partial Autocorrelation Function (PACF) plot for new cases data.
SARIMA using ACF and PACF for new cases and new deaths: The ACF and PACF for SARIMA model are presented for new deaths and new cases data to calculate the initial parameters for the model, as shown in Figures 9-12.

Figure 9: Autocorrelation Function (ACF) plot to check seasonality for new deaths data.

Figure 10: Partial Autocorrelation Function (PACF) plot to check seasonality for new deaths data.

Figure 11: Autocorrelation Function (ACF) plot to check seasonality for new cases data.

Figure 12: Partial Autocorrelation Function (PACF) plot to check seasonality for new cases data.
Model design for ARIMA and SARIMA
The statistics of the trained ARIMA and SARIMA model as depicted in Figures 13-16, where ar.L1, ar.L2, ar.L3, … corresponds to α1 ,α 2 ,α 3 , … from the equations (6) and (11) i.e. they belong to linear parameters of Autoregressive (AR) component. Similar to AR component, ma.L1, ma.L2, ma.L3,… belongs to Moving Average (MA) component from linear parameters and sigma2 represents error. However in Figures 15 and 16, ar.S.L9 belongs to non-linear parameters of AR components representing seasonality to be 9 and ma.S.L9 and ma.S.L18 represents MA of non-linear components. Moreover, it is clearly mentioned that the ARIMA and SARIMA models took 18,000 data for confirmed cases and confirmed deaths for 237 countries and the model is judged on the basis of AIC, BIC and Hannan-Quinn Information Criterion (HQIC) (Figures 13-16).

Figure 13: ARIMA model summary for death as the dependent variable.

Figure 14: ARIMA model summary for cases as the dependent variable.

Figure 15: SARIMA model summary for deaths as the dependent variable.

Figure 16: SARIMA model summary for cases as the dependent variable.
After finding the appropriate parameters to work with the ARIMA and SARIMA models, these models were then trained using those parameters. Otherwise the automatic ARIMA function gave us the ARIMA (5,1,5)(0,0,0,0) as the best-fit model. Elsewhere, Figures 13 and 14 have the complete ARIMA model summary of deaths and cases due to COVID as the dependent variables respectively.
The SARIMA model summary with Deaths as the dependent variable on which the model has been trained for SARIMA (5,1,5) (1,0,2,9) as shown in Figure 15. And a SARIMA model with the same parameters is developed over new cases as the dependent variable.
ARIMA model description: There is a need to calculate the order (p, d, q) of an autoregressive moving average sequence for building a dependable forecasting ARIMA model, and studies [41-45] tell us different algorithms to determine the order of ARIMA model. These suggest an iterative/recursive approach to determine the order of the ARIMA model [46,47] or the use of a pattern identification approach using the autocorrelation function else by minimizing the AIC [48,49].
Following the selection of a specific model from the general class, effective statistical techniques are used to ascertain the model’s parameters. To estimate parameters, the most widely used computer programs use a non-linear least-squares technique, maximum likelihood, or harmony search algorithm as used in the study [24,41].
AIC = (-2)log(maximumlikelihood) +2
(number of independently adjustedparameters within themodel) (7)
BIC = (-2)log(maximumlikelihood) +2(number of samplesused for fitting) (8)
One can calculate the maximum likelihood for the ARIMA model to perform the statistical task for model verification [41]. Furthermore, we require some objective function that will evaluate model performance on a validation set in order to determine the ideal pairing of p and q. Normally, this task in accomplished by Akaike Information Criterion (AIC) and Bayesian Information Criterion. Calculations of both techniques are based on the maximum likelihood for the autoregressive model [26]. The latest automatic ARIMA model uses AIC to find the best-fit model.
The next step is to fit/train the best-fit autoregressive model as studied in [27]. Once a suitable model has been fitted to the data, it may be extrapolated to get predictions of future time series data. It’s also feasible to construct confidence intervals around these point projections if one considers normalcy.
SARIMA model description: Before a SARIMA function is implemented; various tests were conducted to analyse the data set. These tests are separated into stages. Firstly, the data is preprocessed to make sure that it is in the appropriate form so that a time-series-based analysis can be conducted over it. Next, the data is processed via ACF and PACF functions to check for reliability of the data in the case of AR(p), I(d), and MA(q) factors. Later comes the stage where OCSB Test and KPSS unit-root tests occur. Now, let the various algorithms perform training over various parameters of the SARIMA model and find the best-fit model based on parameters. The last stage is to train the best fit model for SARIMA and forecast the values against the test data. This stage will determine the results that are obtained, whether it is up to the expectations or failed to meet the expectations. One can verify this by Root Mean Square Error, R-squared function, Mean Squared Error, etc. As discussed for the ARIMA, the same steps are employed to build a SARIMA model capable of forecasting. One can also use Akaike’s information criterion, maximum likelihood, or harmony search algorithm [24, 41] to obtain the parameters that will determine the best-fit model.
Observation
Observations from the resulting graphs show the forecasted result along with actual values. The forecasted result of the ARIMA and SARIMA model are shown in Figures 17 and 18 respectively. One can observe that the predicted result suggests smart lockdown at various time intervals that will help control the spread of the novel coronavirus. The observations also show that the same ARIMA and SARIMA model parameters can be used to predict the results of models with deaths occurring due to COVID Virus as the dependent variable. Predictions made by the ARIMA and SARIMA models are depicted in Figures 19 and 20.

Figure 17: ARIMA model’s prediction based on COVID cases for India. 

Figure 18: SARIMA model’s prediction based on COVID cases for India. 

Figure 19: ARIMA model’s prediction based on death for India. 

Figure 20: SARIMA model’s prediction based on death for India. 
Time-series analysis and machine learning are used to make predictions about the spread and fatalities of the novel coronavirus. This information can be used to alert stakeholders and prepare for potential spikes in cases. It can also help with planning lockdowns and informing citizens, which is especially important in countries with high population of migrant workers, such as India and China. The goal is to use this information to assist people and government agencies in managing the pandemic effectively.
The ARIMA and SARIMA machine learning models produced resulting graphs which can predict the spike of new deaths and new cases due to the COVID pandemic. Based on this prediction, the models have forecasted the time periods to execute smartlockdowns. These are step-line graphs and the severity to implement a lockdown depends on the size of each step. The feature that can inform us about the urgency of lockdown implementation can either be numerically computed or computationally acquired from the given forecasted result. The bigger the size of the step means our machine learning model forecasted that there will be a severe spread of cases and consecutive deaths thus a need to impose lockdown in the upcoming time period is required. Refer to APPENDIX and confirm the results of nations such as Brazil, Ghana, Canada, Chile and South Africa.
Future scope
This study to develop Machine Learning models capable of forecasting the lockdown periods for the spread of new cases as well as death cases of diseases such as novel coronavirus which spreads via air medium that makes this disease capable of widespread. This study proves to be very useful in predicting the lockdown periods which alerts the people about the potential threat from the disease. It is believed that such methodology must be adopted if such pandemic occurs in future.
It has been emphasized that gathering sufficient training data is essential for the machine learning model to be accurate and generalizable. However, precedence to the quality, not quantity, of the data is given. The forecasted data from the model has the feature of determining severity of situation based on the size of each step. Determining the step size requires more computation power.
Time-series analysis and machine learning can be used to forecast the SARS-CoV-2 spread and deaths. The predictions can alert stakeholders and enable them to prepare for potential increases in cases. In addition, this information can help plan lockdowns and inform citizens, which is particularly significant in countries with a large population of migrant workers like India and China. The aim is to utilize this information to aid individuals and government organizations in effectively managing the pandemic.
This research proposes an effective method to address the COVID-19 pandemic by predicting the implementation of intelligent lockdowns in over 200 countries using unified ARIMA and SARIMA models. The models were trained on data from 237 countries and had a response time of 2.5 months. The models’ reliability was evaluated using analytical methods. They have a rapid response time and predict both confirmed cases and deaths due to COVID-19.This study add a new perspective to time-series analysis and aid decision-making regarding implementation of intelligent lockdowns.
We would like to thank, Dr. Umang Soni, the Department of Manufacturing Processes and Automation Engineering, Netaji Subhas University of Technology, for guiding us for this research. I would also like to thank Dr. Arti M.K., HOD of the Electronics and Communication Department, Netaji Subhas University of Technology (East Campus), for her efforts in contributing to this research work.
This research did not receive any specific grant from funding agencies in the public, commercial, or not-for-profit sectors.
The authors declare that they have no known competing financial interests or personal relationships that could have appeared to influence the work reported in this paper.
The COVID-19 data that support the findings of this study are available in/from WHO COVID Repository, https://covid19. who.int/data.
[Crossref]
[Crossref] [Google Scholar] [PubMed]
[Crossref] [Google Scholar] [PubMed]
[Crossref] [Google Scholar] [PubMed]
[Crossref] [Google Scholar] [PubMed]
[Crossref] [Google Scholar] [PubMed]
[Crossref] [Google Scholar] [PubMed]
[Crossref] [Google Scholar] [PubMed]
[Crossref] [Google Scholar] [PubMed]
[Crossref] [Google Scholar] [PubMed]
[Crossref] [Google Scholar] [PubMed]
[Crossref] [Google Scholar] [PubMed]
[Crossref] [Google Scholar] [PubMed]
Citation: Chhabra H, Chauhan A (2023) A Comparative Study of ARIMA and SARIMA Models to Forecast Lockdowns due to SARS-CoV-2. Adv Tech Biol Med. 11:399.
Received: 06-Feb-2023, Manuscript No. ATBM-23-21713; Editor assigned: 09-Feb-2023, Pre QC No. ATBM-23-21713 (PQ); Reviewed: 23-Feb-2023, QC No. ATBM-23-21713; Revised: 02-Mar-2023, Manuscript No. ATBM-23-21713 (R); Published: 09-Mar-2023 , DOI: 10.35248/2379-1764.23.11.399
Copyright: © 2023 Chhabra H, et al. This is an open-access article distributed under the terms of the Creative Commons Attribution License, which permits unrestricted use, distribution, and reproduction in any medium, provided the original author and source are credited.
Sources of funding : This research did not receive any specific grant from funding agencies in the public, commercial, or not-for-profit sectors.