PMC/PubMed Indexed Articles


Indexed In
- Open J Gate
- Genamics JournalSeek
- Academic Keys
- JournalTOCs
- CiteFactor
- Ulrich's Periodicals Directory
- Access to Global Online Research in Agriculture (AGORA)
- Electronic Journals Library
- Centre for Agriculture and Biosciences International (CABI)
- RefSeek
- Directory of Research Journal Indexing (DRJI)
- Hamdard University
- EBSCO A-Z
- OCLC- WorldCat
- Scholarsteer
- SWB online catalog
- Virtual Library of Biology (vifabio)
- Publons
- Geneva Foundation for Medical Education and Research
- Euro Pub
- Google Scholar
Useful Links
Share This Page
Journal Flyer
Open Access Journals
- Agri and Aquaculture
- Biochemistry
- Bioinformatics & Systems Biology
- Business & Management
- Chemistry
- Clinical Sciences
- Engineering
- Food & Nutrition
- General Science
- Genetics & Molecular Biology
- Immunology & Microbiology
- Medical Sciences
- Neuroscience & Psychology
- Nursing & Health Care
- Pharmaceutical Sciences
Research - (2019) Volume 10, Issue 7
The Impact Crude Plant Extracts: As Potential Biofertilizers and Treatment against Tomato Plant Infection
Peter Mudiaga Etaware1*, Elizabeth Ufuoma Etaware2, Olaoluwa O Olaoluwa3, Oyetunji OJ1, Olapeju O Aiyelaagbe3 and Adegboyega C Odebode12College of Food Technology, Yaba College of Education, Yaba, Lagos, Nigeria
3Department of Chemistry, University of Ibadan, Ibadan, Nigeria
Received: 27-Feb-2019 Published: 23-May-2019, DOI: 10.35248/2157-7471.19.10.481
Abstract
Tomato cultivation in Nigeria and around the world is seriously threatened by disease infection. Soilless cultivation and gene engineering are modern innovations used worldwide to ensure production of quality disease-free vegetables; yet annual crop loss still persists. In 2011, a commercial vegetable farm in Apẹtẹ, Ibadan, Nigeria was totally ravaged by a fleet of disease infection. 36 infected tomato samples were annihilated from 6 cultivars for laboratory analysis. Crude plant extracts were employed as treatments. The test plants were arranged in 4 × 3 × 2 × 3 × 3 (experimental plots) and 4 × 3 × 3 (control plot) layouts. The tomato plants were basically infected by fungal diseases. The disease symptoms were totally eradicated by the applied botanicals (100% healthy tomato plants). There was an appreciable increase in plant heights of the treated tomato plants (30.9 cm, 30.2 cm, 27.5 cm and 26.5 cm respectively) compared to those in the control plots (24.1 cm, 22.3 cm, 23.3 cm and 18.6 cm, respectively). The results obtained so far showed that plant extracts was an effective alternative for the systemic and hazardous chemicals used in tomato plant disease management.
Keywords
Experimental plots; Control plot; Soilless cultivation; Gene engineering; Crude extracts
Introduction
Tomato (Lycopersicon esculentum Synonym: Solanum lycopersici) is a vegetable crop with high vitamin A, vitamin C, Lycopene, and potassium content [1]. The cultivation, distribution, and consumption of fresh tomato is threatened globally by several factors among which are lack of disease resilient varieties, poor postharvest handling, no affinity for durability, poor storage facilities and processing techniques etc. Today, numerous transgenic varieties and genetically modified hybrids are produced worldwide [2], yet, annual crop loss is still on the increase.
In an attempt to solve the problem of annual tomato crop loss to disease infection, a disease ravaged vegetable field spanning over ten hectares of arable farmland, situated in the heart of Apẹtẹ (a suburb located in Ibadan, Oyo State, Nigeria) was investigated by a group of researchers from the University of Ibadan in August, 2011. Samples collected were subjected to disease diagnosis and treatment using Jatropha curcas and Mangifera indica. It has been reported that the control of pathogens on both stored and cultivated tomato was achieved by the use of pesticides [2], Research conducted in recent years have shown that most of these pesticides contain harmful chemicals (or heavy metals) that are either systemic or hazardous, causing long term harmful effects on both plants and animals [3]. This is as a result of bioaccumulation of heavy metals in the treated plants to form lethal doses, which are further transferred by consumption to the tissues and organs of primary, secondary or tertiary consumers that feed on these treated plants directly or indirectly.
These are facts that suggest the urgent need for natural solutions in the control of plant diseases. Hence, the much anticipated dynamism in plant disease control can be achieved if these botanicals gain their rightful status as disease preventive and curative agents, fostering food security in Africa and the world at large with a clean and healthy environment devoid of hazardous substances. Therefore, this research was setup to investigate the possibility of absolute control of tomato plant diseases using simple botanical formulations that are cost effective and less cumbersome to prepare.
Materials and Methods
The study area
The research location was in Apẹtẹ village, Ibadan, Oyo State, Nigeria with GPS coordinates 07°26’57’’ N (Latitude) and 03°52’20’’E (Longitude). The size of the study area was 10 hectares (100,000 m2) interspersed with different cultivars of tomato and pepper plants and few tree crops (Pawpaw, Mango, Oil Palm), Cassava, Pineapple, and Maize plants cultivated to provide some degree of shading. The average annual rainfall for the study area was 788–1884 mm with 26.6°C mean temperature and an average annual relative humidity of 80%.
Farm assessment
The farm was assessed in August, 2011 by a team of research scholars from the Plant Mycology and Pathology unit of the Department of Botany, University of Ibadan. The tomato plants were inspected in the field for the presence of visible disease symptoms. The fruits were inspected for bruises, water soaked lesions, dark spots, and the presence of visible mycelia growth emanating from the activities of the pathogens. The leaves and leaflets were closely examined for necrotic lesions and signs of senescence. The tomato shoots were examined also for the presence of swellings, flaccidity and dropping or wilting. Finally, the roots of some tomato plants with physical deformity were washed and examined to see if there was gall or wart formation (basically incited by Nematodes). Infected shoot, root, fruit and soil samples were collected for analysis in the laboratory.
Sample collection
Thirty-six tomato shoots and fruits were collected from six unidentified cultivars of tomato plants. They were carefully labeled and each placed in a sterile polyethylene bag. Soil samples were also collected from the root rhizosphere of infected tomato plants, placed in a sterile collection jar, labeled appropriately and stored in a vessel containing icepacks (for preservation of the soil flora). The samples were transported to the Pathology and Mycology research laboratory of the Department of Botany, University of Ibadan for disease diagnosis and further analysis.
Disease diagnosis
Infected leaf samples were cut into small pieces of 5mm radial diameter using a sterile 5mm cork borer, surface sterilized in 75% ethanol and rinsed in three separate changes of sterile distilled water, to eliminate traces of ethanol, they were then inoculated using direct plating technique into replicates of freshly prepared (full strength i.e., 39 g/L) potato dextrose agar medium (PDA).
The stems and roots of the infected tomato shoots were surfaced sterilized by swabbing with 10% sodium hypochlorite. They were then later cut longitudinally to expose the vascular bundles. The already exposed stems and roots were further cut into smaller units of 5mm vertical length, sterilized in 75% ethanol, rinsed in three successive changes of sterile distilled water and then plated on freshly prepared potato dextrose agar (for fungal growth) and nutrient agar (for Bacteria growth). The cultured samples were incubated at room temperature (25 ± 2°C) for 24-48 h (for bacterial growth) and 7 days (for fungal growth).
Microbial load of the infected soil
The soil samples collected from the root rhizosphere of the infected tomato plants were air dried for 24 h at 25 ± 2°C in an aseptic chamber. Each soil samples (1 g) was suspended in 10 ml of sterile distilled water for 30 min on a rotary shaker. One ml from each solution (stock) was titrated into 9 ml of sterile distilled water in a test tube and rocked gently to aide homogenization (Dilution factor 10-1). The procedure was repeated sequentially to obtain dilution factor of 10-2, 10-3, 10-4, and 10-5, respectively.
Inoculation was done using the pour plate technique/method. One ml from each dilution factors (10-2, 10-3, 10-4, and 10-5) was aseptically introduced into freshly prepared media (PDA and Nutrient Agar). The medium was gently swirled and decanted to remove excess water. It was then incubated at 25°C ± 2°C) for between 24-48 h (for Bacterial growth) and 7 days (for fungal growth) in an incubator.
Extraction of crude extract using GC-MS
The active ingredients were extracted using Gas Chromatography Mass Spectrophotometry (GC-MS) in the Department of Chemistry, University of Ibadan, Nigeria.
Procedure
• Jatropha curcas (Physic Nut) [4]: Root and Bark
• Mangifera indica (Mango): Leaves
Preparation of plant parts
• The root and bark of Jatropha curcas, and the leaves of Mangifera indica were washed using sterile distilled water and air dried in sterile chamber.
• A total of 10g of the plant part was weighed, crushed to crumbs using a sterile mortar and pestle before it was pulverized to powder using an electric grinding machine.
• The fine powder was measured into an Erlenmeyer flask (1000 ml capacity) and treated with 70% ethanol (C2H5OH) until the powder was fully immersed by the solvent.
• The mixture was incubated for 24 h and filtered through Whatmann filter paper No. 41 along with sodium sulphate (Na2SO4) and absolute alcohol to remove sediments.
• The filtrate was concentrated by bubbling Nitrogen gas through the solution.
• Lyophilized tissues were processed immediately.
Organic extraction
• A known amount of lyophilized tissues (typically 300-500 mg) was transferred into a glass vial with cap and 10 μL of internal standard 5α-cholest 7en-3β-ol (1 mg/ml stock) was added to the vial with 3.75 ml of CHCl3 to 7.50 ml of Methanol (1:2). The mixture was vortex vigorously.
• An additional 1.25 ml of CHCl3 and de-ionized water (dH2O) was further added to the mixture in the vial before the mixture was vortex once again.
• The bottom organic phase was transferred to a fresh vial with the help of a pipette. The solvent was allowed to evaporate completely at 35°C.
• Critical step: Weighing of the tissue was done immediately to avoid thawing.
Alkaline hydrolysis
• A total of 500 μL of 6% methanolic KOH (w/v) was added to the dried residue and incubated at 85°C for 30 min to 1 h. 250 μL of dH20 and 750 μL of n-heptane was added to it before vortexing.
• After vortexing, the mixture was allowed to stand for some time till the layers were separated. The upper phase was then transferred to a fresh vial. The step was repeated twice and n-heptane was allowed to evaporate completely (16-24hrs).
Derivatization
To the dried residue, 100 μL of derivatization reagent (80 μL BFSTA + 20 μL TMCS) was added and incubated at 65°C for 1hr before it was injected into the GC-MS machine.
GC-MS analysis
The filtrate was fed into a Perkin-Elmer GC Clarus 500 system comprising AOC-20i auto-sampler and a Gas Chromatography interphased to a Mass Spectrophotometer (GC-MS) equipped with an Elite-5MS (5% diphenyl per 95% dimethyl polysiloxane) fused to a capillary column (30 × 0.25 μm ID × 0.25 μm df). An electron ionization system was operated in electron impact mode with ionization energy of 70eV. Helium gas (100%) was used as the carrier gas at constant flow rate of 1mL/min, an injection volume of 2 μL was employed (10:1). The injector temperature was maintained at 300°C, the ion-source temperature was kept at 250°C. For the analysis, 1 μL of the sample was injected in the split mode in the instrument using Rtx5MS-30m column with 0.25 mm ID and 0.25 μL df. The analysis was performed using the following temperature program:
• 1min of isothermal heating at 100°C followed by heating at 300°C for 20 min
• Mass spectra were recorded at 2 scan/sec with scanning range of 40 to 850 m/z
• Quantify each component based on peak areas and normalization based on the internal standard
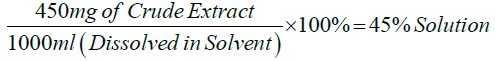
Crude extract formulation
Mass (mg) of Crude extract was dissolved in equal Volume (ml) of Solvent (20 ml of Methanol + Complementary Volume (ml) of Distilled Water) to produce 100% Conc.
Note: the crude extract was initially dissolved in 20 ml of Methanol to aide homogenization before sterile distilled water was added.
Mathematically,
Laboratory analysis (In vitro)
An empirical formulation of 10 ml plant extracts (at various concentrations) and 90 ml of already prepared potato dextrose agar was used as the treated substrate. The resulting mixture was vigorously stirred together and aseptically dispensed into sterile petri-dishes. A sterile 5 mm cork borer was used to aseptically introduce the pathogen(s) unto the core of the treated substrate(s). The inoculated cultures were incubated at room temperature for 7 days, during which radial growth measurements were taken daily. Percentage mean mycelia inhibition was recorded and calculated as follows:
Mathematically,
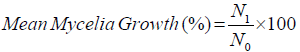
Where,
No= Diameter of mycelia of each pathogen in the control experiment
N1= Diameter of mycelia of each pathogen in the treatment
Treatment and control layout for field experimentation (In vivo)
The setup for the experiment was Completely Randomized Design (CRD). The treatment plot for the test tomato plants were arranged according to the injected pathogens, tomato varieties, treatment applied, levels of concentration of the applied treatment and the experiment was replicated in triplicates. While the tomato plants in the control Plot had no treatment.
Source of tomato seeds
Tomato seeds used for the experiment were obtained from the National Center for Genetic Resources and Biotechnology (NACGRAB).
Procedure for tomato plant inoculation
Equal volume (50 ml) of Spore suspension containing 3.2 × 10⁶ spores per ml was aseptically introduced around the root rhizosphere of each tomato seedlings after raising them in the nursery for three weeks. The tomato seedlings were then allowed to stabilize for 24 h before the introduction of the plant extracts. The plant extracts (50 ml) was introduced via the same route to the root rhizosphere of the already infected tomato seedlings within the experimental plots, while the control plot was left unaided.
The plants were left to stabilize for another day. Observations were conducted weekly. The experiment was allowed to run for a period of Three months, during which growth parameters were recorded for each plant weekly alongside other agronomic parameters.
Data analysis
Data collected were organized into graphs (Qualitative data) and tables (Quantitative data) using Microsoft Excel workbook 2007. Quantitative data were represented as means and standard deviation. Analysis of variance (ANOVA) was conducted using CoStat 6.451 with advanced features of SAS 9.0 Statistical Software. The homogeneity of means was determined using Duncan Multiple Range Test (DMRT).
Results and Discussion
Laboratory analysis (In vitro)
The experiment conducted showed that 15% conc. of plant extracts (Mangifera indica and Jatropha curcas) totally inhibited the radial mycelia growth of Aspergillus sclerotirium from the beginning of the assay at Day 1 (1.7 ± 0.05 and 1.7 ± 0.24 cm, respectively), through Day 3 (3.2 ± 0.38 and 3.8 ± 1.12 cm, respectively), to Day 5 (3.2 ± 0.95 and 3.8 ± 0.40 cm, respectively), till the experiment was terminated at Day 7 (3.1 ± 0.90 and 3.8 ± 0.58 cm, respectively), compared to the control setup for the experiment for the various days i.e., Day 1 (2.6 ± 1.68 cm), Day 3 (5.1 ± 1.41 cm), Day 5 (5.9 ± 0.61 cm) and Day 7 (6.3 ± 0.54 cm), respectively at p < 0.05 (Table 1). Other organisms were significantly affected too, but total inhibition of the radial mycelia growth of the pathogens by minimal contact with botanicals on culture media was the main objective of this research.
| 15% Conc. | |||||
|---|---|---|---|---|---|
| Botanicals | Fungal Isolates | 1st Day(cm) | 3rd Day(cm) | 5th Day(cm) | 7th Day(cm) |
| Jatropha curcas | A. fumigatus | 1.8 ± 0.17 bc | 3.7 ± 0.59 de | 4.4 ± 1.00 e | 4.1 ± 1.02 f |
| A. terreus | 1.7 ± 0.06 bc | 4.2 ± 0.59 c | 5.6 ± 1.91 c | 5.2 ± 1.66 c | |
| A. glaucus | 1.9 ± 0.48 b | 3.2 ± 0.94 g** | 3.1 ± 0.96 i | 2.4 ± 0.43 j*** | |
| A. sclerotirium | 1.7 ± 0.24 bc | 3.8 ± 1.12 d | 3.8 ± 0.40 g | 3.8 ± 0.58 g | |
| Mangifera indica | A. fumigatus | 1.9 ± 0.35 b | 3.8 ± 1.30 d | 3.5 ± 0.74 h | 2.9 ± 1.00 i |
| A. terreus | 1.6 ± 0.08 c | 3.5 ± 0.31 ef | 4.1 ± 0.70 f | 4.1 ± 0.68 f | |
| A. glaucus | 1.7 ± 0.13 bc | 3.4 ± 0.50 fg** | 4.3 ± 1.30 ef** | 4.4 ± 1.53 e** | |
| A. sclerotirium | 1.7 ± 0.05 bc | 3.2 ± 0.38 g | 3.2 ± 0.95 i | 3.1 ± 0.90 h | |
| Control | A. fumigatus | 1.9 ± 0.40 b | 3.8 ± 0.95 d | 4.7 ± 2.54 d | 3.9 ± 1.23 g |
| A. terreus | 1.8 ± 0.53 bc | 3.6 ± 0.93 def | 4.9 ± 1.40 d | 4.8 ± 1.93 d | |
| A. glaucus | 1.2 ± 0.22 d | 8.5 ± 0.00 a | 8.5 ± 0.00 a | 8.5 ± 0.00 a | |
| A. sclerotirium | 2.6 ± 1.68 a | 5.1 ± 1.41 b | 5.9 ± 0.61 b | 6.3 ± 0.54 b | |
Means with the same alphabets within a column are not significantly different statistically at p < 0.05 using Duncan Multiple Range Test (DMRT). The level of inhibition of mycelia growth of each pathogen on the culture medium is indicated by the number of (*) sign present compared to the control. Data collected were represented as “Means ± Standard Deviation (SD)” only
Note:* -Slightly significant,**-Moderately significant,***-Highly significant
Table 1: Mycelia mass reduction of tomato plant pathogens using crude plant extracts at low concentration.
The radial mycelia growth of A. Sclerotirium, A. glaucus and A. terreus were totally inhibited by the application of 30% concentration of the botanicals (Table 2). A. Sclerotirium was reduced from 2.6 ± 1.68 to 1.7 ± 0.15 cm by the medicinal effect of M. indica and 1.6 ± 0.26 cm by J. curcas at the commencement of the experiment (p < 0.05), from 5.1 ± 1.41 to 3.2 ± 0.38 cm (by M. indica) and 3.8 ± 1.12 cm (by J. curcas) at Day 3, and 6.3 ± 0.54 to 3.1 ± 0.90 cm (by M. indica) and 3.8 ± 0.58 cm (by J. curcas) at the end of the experiment (Table 2). The mycelia mass of A. glaucus was reduced from 8.5 ± 0.00 cm to 2.6 ± 0.47 cm (at Day 3), 2.3 ± 0.39 cm (at Day 5) and 2.1 ± 0.38 cm (at Day 7), respectively by the extracts of M. indica and 3.6 ± 0.54, 3.7 ± 0.76 and 3.7 ± 0.62 cm by J. curcas; while the mycelia mass of A. terreus was reduced from 3.6 ± 0.93 to 2.4 ± 0.48 cm (at Day 3), 4.9 ± 1.40 to 2.2 ± 0.45 cm (at Day 5) and 4.8 ± 1.93 to 1.6 ± 0.53 cm (at the end of the experiment) as recorded in Table 2.
| 30% Conc. | |||||
|---|---|---|---|---|---|
| Botanicals | Fungal Isolates | 1st Day(cm) | 3rd Day(cm) | 5th Day(cm) | 7th Day(cm) |
| Jatropha curcas | A. fumigatus | 1.7 ± 0.12 bcd | 2.8 ± 0.42 e | 3.4 ± 1.07 f | 3.3 ± 1.01 e |
| A. terreus | 1.7 ± 0.06 bcd | 3.6 ± 0.52 c | 4.1 ± 1.11 d | 3.8 ± 1.23 d | |
| A. glaucus | 1.6 ± 0.10 cd | 3.6 ± 0.54 c** | 3.7 ± 0.76 e** | 3.7 ± 0.62 d** | |
| A. sclerotirium | 1.6 ± 0.26 cd | 1.9 ± 0.66 g*** | 1.8 ± 0.62 j*** | 1.7 ± 0.54 gh*** | |
| Mangifera indica | A. fumigatus | 1.8 ± 0.05 bc | 3.6 ± 0.48 c | 3.0 ± 0.18 g | 2.9 ± 0.34 f |
| A. terreus | 1.6 ± 0.21 cd | 2.4 ± 0.48 f | 2.2 ± 0.45 i | 1.6 ± 0.53 h** | |
| A. glaucus | 1.5 ± 0.18 d | 2.6 ± 0.47 ef*** | 2.3 ± 0.39 i*** | 2.1 ± 0.38 *** | |
| A. sclerotirium | 1.7 ± 0.15 bcd | 3.0 ± 1.49 d | 2.9 ± 1.05 h | 1.9 ± 0.57 g*** | |
| Control | A. fumigatus | 1.9 ± 0.40 b | 3.8 ± 0.95 c | 4.7 ± 2.54 c | 3.9 ± 1.23 d |
| A. terreus | 1.8 ± 0.53 bc | 3.6 ± 0.93 c | 4.9 ± 1.40 c | 4.8 ± 1.93 c | |
| A. glaucus | 1.2 ± 0.22 e | 8.5 ± 0.00 a | 8.5 ± 0.00 a | 8.5 ± 0.00 a | |
| A. sclerotirium | 2.6 ± 1.68 a | 5.1 ± 1.41 b | 5.9 ± 0.61 b | 6.3 ± 0.54 b | |
Means with the same alphabets within a column are not significantly different statistically at p < 0.05 using Duncan Multiple Range Test (DMRT). The level of inhibition of mycelia growth of each pathogen on the culture medium is indicated by the number of (*) sign present compared to the control. Data collected were represented as “Means ± Standard Deviation (SD)” only
Note:* - Slightly significant,**-Moderately significant,***-Highly significant
Table 2: Mycelia mass reduction of tomato plant pathogens using Crude plant extracts at medium Concentration.
The application of 45% plant extract of both M. indica and J. curcas was effective in the inhibition of the radial mycelia growth of all the pathogens isolated from the diseased tomato plants (Table 3). The best levels of mycelia inhibition were recorded thus for A. sclerotirium and A. glaucus by J. curcas (2.8 ± 1.10 and 2.2 ± 0.76 cm respectively) and M. indica on A. terreus (1.6 ± 0.53 cm), A. sclerotirium (2.2 ± 0.91 cm) and A. glaucus (2.2 ± 0.40 cm), with a minimum of two-third (2/3) of the mycelia mass reduced by the effect of the extracts (Table 3).
| 45% Conc. | |||||
|---|---|---|---|---|---|
| Botanicals | Fungal Isolates | 1st Day(cm) | 3rd Day(cm) | 5th Day(cm) | 7th Day(cm) |
| Jatropha curcas | A. fumigatus | 1.7 ± 0.08 b | 3.6 ± 0.44 d | 3.7 ± 0.61 e | 3.3 ± 0.77 e |
| A. terreus | 1.7 ± 0.12 b | 3.7 ± 1.16 d | 4.0 ± 1.83 d | 3.0 ± 0.95 f | |
| A. glaucus | 2.4 ± 0.89 a | 4.7 ± 1.70 c | 3.3 ± 0.81 f** | 2.8 ± 1.10 f*** | |
| A. sclerotirium | 1.8 ± 0.13 b | 2.5 ± 0.66 g** | 2.4 ± 0.84 g** | 2.2 ± 0.76 g*** | |
| Mangifera indica | A. fumigatus | 1.2 ± 0.15 c | 3.3 ± 1.19 e | 3.9 ± 1.28 de | 2.8 ± 0.90 f |
| A. terreus | 1.1 ± 0.10 c | 1.9 ± 0.72 i | 2.3 ± 0.87 g** | 2.1 ± 0.92 g | |
| A. glaucus | 1.1 ± 0.10 c | 2.1 ± 0.19 h*** | 2.3 ± 0.34 g*** | 2.2 ± 0.40 g*** | |
| A. sclerotirium | 1.2 ± 0.08 c** | 2.9 ± 0.66 f | 2.3 ± 0.90 g** | 2.2 ± 0.91 g*** | |
| Control | A. fumigatus | 1.9 ± 0.40 b | 3.8 ± 0.95 d | 4.7 ± 2.54 c | 3.9 ± 1.23 d |
| A. terreus | 1.8 ± 0.53 b | 3.6 ± 0.93 d | 4.9 ± 1.40 c | 4.8 ± 1.93 c | |
| A. glaucus | 1.2 ± 0.22 c | 8.5 ± 0.00 a | 8.5 ± 0.00 a | 8.5 ± 0.00 a | |
| A. sclerotirium | 2.6 ± 1.68 a | 5.1 ± 1.41 b | 5.9 ± 0.61 b | 6.3 ± 0.54 b | |
Means with the same alphabets within a column are not significantly different statistically at p < 0.05 using Duncan Multiple Range Test (DMRT). The level of inhibition of mycelia growth of each pathogen on the culture medium is indicated by the number of (*) sign present compared to the control. Data collected were represented as “Means ± Standard Deviation (SD)” only
Note:* Slightly significant,** Moderately significant,***Highly significant
Table 3: Mycelia mass reduction of tomato plant pathogens using Crude plant extracts at high Concentration.
Field experimentation (In vivo)
The disease occurrence on the experimental plots treated with 30% conc. of the medicinal extract of M. indica within the first week of application was totally reduced to 0% (Figure 1). Experimental plots with tomato plants treated with other formulations of M. indica and J. curcas gave 25 and 50% disease outbreak compared to 100% disease incidence recorded in the control plot (Table 4) after transplant. A total of 100% disease eradication was observed in the experimental plot of tomato plants treated with 30% M. indica (Figure 2) and 45% J. curcas during the second week of observation (Table 5). Also, it was observed that 75% success was achieved in the experimental plots treated with 15 and 45% J. curcas (Table 5) after two weeks post-nursery planting (Figure 3).
| Tomato Pathogens | Jatropha curcas | Mangifera indica | Control | |||||||||||
|---|---|---|---|---|---|---|---|---|---|---|---|---|---|---|
| Variables | 15% | 30% | 45% | 15% | 30% | 45% | 0% | |||||||
| Inc | Sev | Inc | Sev | Inc | Sev | Inc | Sev | Inc | Sev | Inc | Sev | Inc | Sev | |
| A. fumigatus | Yes | + | No | - | No | - | Yes | + | No | - | Yes | + | Yes | +++ |
| A. terreus | Yes | + | No | - | Yes | + | No | - | No | - | No | - | Yes | +++ |
| A. sclerotirium | No | - | Yes | + | No | - | No | - | No | - | No | - | Yes | ++ |
| A. glaucus | No | - | No | No | - | No | - | No | - | No | - | Yes | +++ | |
| Net Occurrence | 50% | 25% | 25% | 25% | 0% | 25% | 100% | - | ||||||
| Disease Eradication | 50% | 75% | 75% | 75% | 100% | 75% | 0% | - | ||||||
Table 4: Disease assessment after the first week (+ Nursery period) of treatment administration in the experimental plots.
| Tomato Pathogens | Jatropha curcas | Mangifera indica | Control | |||||||||||
|---|---|---|---|---|---|---|---|---|---|---|---|---|---|---|
| Variables | 15% | 30% | 45% | 15% | 30% | 45% | 0% | |||||||
| Inc | Sev | Inc | Sev | Inc | Sev | Inc | Sev | Inc | Sev | Inc | Sev | Inc | Sev | |
| A. fumigatus | Yes | + | Yes | + | No | - | No | - | No | - | Yes | + | Yes | +++ |
| A. terreus | Yes | + | Yes | + | No | - | No | - | No | - | No | - | Yes | + |
| A. sclerotirium | No | - | Yes | + | No | - | Yes | + | No | - | No | - | Yes | + |
| A. glaucus | Yes | + | Yes | + | No | - | No | - | No | - | No | - | Yes | +++ |
| Net Occurrence | 75% | 100% | 0% | 25% | 0% | 25% | 100% | |||||||
| Disease Eradication | 25% | 0% | 100% | 75% | 100% | 75% | 0% | |||||||
Inc- Disease Incidence
Sev- Disease Severity
Symbol - Inference
+ Not too Severe Occurrence
++ Mildly Severe Occurrence
+++ Severe Occurrence
Table 5: Disease assessment after the second week (+ Nursery period) of treatment administration in the experimental plots.

Figure 1: The map of the research location.

Figure 2: The percentage level of healthy tomato plants produced after re-infection with pathogens and treatment with botanicals at varying concentrations after the first week of experimentation.

Figure 3: The percentage level of healthy tomato plants produced after re-infection with pathogens and treatment with botanicals at varying concentrations after the second week of experimentation.
Growth assessment in the field
The stem girth and leaflet dimensions of the tomato plants in all the experimental plots (except control plot) were significantly improved by the addition of the botanicals (M. indica and J. curcas) at 15, 30 and 45%, respectively, after one week of treatment (Table 6, Table 7, and Table 8). Most notable improvement for leaflet dimensions observed in the experimental plots treated with botanicals include: 4.0 ± 0.93 cm2 for Tomato Plants (TP) treated with 15% Botanicals + A. sclerotirium, 2.7 ± 0.79 cm2 for TP + 15% Botanicals + A. glaucus, 2.5 ± 0.06 cm2 for TP + 15% Botanicals + A. terreus and 2.6 ± 1.08 cm2 for TP + 15% Botanicals + A. fumigatus, compared to the leaflet dimensions of tomato plants in the control plot i.e., 2.6 ± 0.45 cm2 for TP + A. sclerotirium, 2.1 ± 0.78 cm2 for TP + A. glaucus, 2.2 ± 1.60 cm2 for TP + A. terreus, and 2.0 ± 0.35 cm2 for TP + A. fumigatus (Table 6).
| 15% Conc. of Crude Extracts | |||||||||||
|---|---|---|---|---|---|---|---|---|---|---|---|
| Botanicals | Organisms | Number of Leaves | Number of Branches | Largest Leaflet Area (cm2) | Largest Leaflet Length (cm) | Stem Girth (cm) | Plant Height (cm) | ||||
| Jatropha curcas | A. fumigatus | 17 ± 5.69 a | 8 ± 0.58 a | 2.6 ± 1.08 b | 2.6 ± 0.65 bc | 1.2 ± 0.12 a | 11.7 ± 3.08 a | ||||
| A. terreus | 18 ± 4.04 a | 8 ± 0.58 a | 2.3 ± 0.46 c | 2.4 ± 0.26 cd | 1.1 ± 0.14 a | 12.8 ± 2.12 a | |||||
| A. glaucus | 18 ± 4.16 a | 7 ± 0.58 a | 2.0 ± 0.21 de | 2.4 ± 0.17 cd | 1.2 ± 0.09 a | 12.1 ± 0.96 a | |||||
| A. sclerotirium | 13 ± 11.02 a | 6 ± 3.21 a | 1.8 ± 1.08 e | 2.3 ± 0.36 d | 1.0 ± 0.45 a | 10.6 ± 2.57 a | |||||
| Mangifera indica | A. fumigatus | 17 ± 5.51 a | 7 ± 1.53 a | 2.5 ± 1.27 bc | 2.6 ± 0.72 bc | 1.2 ± 0.10 a | 11.3 ± 5.87 a | ||||
| A. terreus | 18 ± 5.29 a | 7 ± 1.15 a | 2.5 ± 0.06 bc | 2.5 ± 0.26 bcd | 1.2 ± 0.02 a | 13.2 ± 1.13 a | |||||
| A. glaucus | 19 ± 1.15 a | 8 ± 1.00 a | 2.7 ± 0.79 b | 2.7 ± 0.35 b | 1.2 ± 0.21 a | 13.6 ± 1.60 a | |||||
| A. sclerotirium | 18 ± 2.52 a | 7 ± 1.00 a | 4.0 ± 0.93 a | 3.3 ± 0.36 a | 1.2 ± 0.04 a | 14.9 ± 2.16 a | |||||
| Control | A. fumigatus | 23 ± 14.84 a | 8 ± 3.06 a | 2.0 ± 0.35 de | 2.2 ± 0.25 d | 0.7 ± 0.33 b | 10.3 ± 2.27 a | ||||
| A. terreus | 13 ± 3.21 a | 7 ± 1.00 a | 2.2 ± 1.60 cd | 2.3 ± 0.92 d | 0.6 ± 0.16 b | 10.2 ± 2.75 a | |||||
| A. glaucus | 15 ± 3.00 a | 7 ± 1.15 a | 2.1 ± 0.78 cd | 2.3 ± 0.57 d | 0.7 ± 0.24 b | 11.3 ± 2.25 a | |||||
| A. sclerotirium | 17 ± 2.08 a | 7 ± 0.00 a | 2.6 ± 0.45 b | 2.5 ± 0.31 bcd | 0.7 ± 0.09 b | 11.0 ± 1.69 a | |||||
Means with the same alphabets within a column are not significantly different at p < 0.05 using Duncan Multiple Range Test (DMRT) for separation of statistically significant means. The level of inhibition of mycelia growth of each pathogen on the culture medium is indicated by the number of (*) sign present compared to the control. Data collected were represented as “Means ± Standard Deviation (SD)” only
Table 6: Comparative assessment of Plant parts after the first week (+ Nursery period) of administration of low dosage of treatment in the experimental plots.
| 30% Conc. of Crude Extracts | ||||||||||||
|---|---|---|---|---|---|---|---|---|---|---|---|---|
| Botanicals | Organisms | Number of Leaves | Number of Branches | Largest Leaflet Area (cm2) | Largest Leaflet Length (cm) | Stem Girth (cm) | Plant Height (cm) | |||||
| Jatropha curcas | A. fumigatus | 18 ± 2.65 a | 8 ± 0.58 a | 4.0 ± 1.77 ab | 3.3 ± 0.71 ab | 1.2 ± 0.09 a | 13.6 ± 2.25 ab | |||||
| A. terreus | 21 ± 4.00 a | 9 ± 1.53 a | 2.7 ± 0.81 b | 2.6 ± 0.40 b | 1.2 ± 0.12 a | 13.2 ± 4.96 ab | ||||||
| A. glaucus | 23 ± 9.71 a | 8 ± 1.53 a | 4.3 ± 1.18 a | 3.3 ± 0.55 ab | 1.3 ± 0.18 a | 15.2 ± 2.93 ab | ||||||
| A. sclerotirium | 16 ± 2.08 a | 7 ± 0.58 a | 2.5 ± 0.83 b | 2.5 ± 0.31 b | 1.3 ± 0.12 a | 13.1 ± 0.55 ab | ||||||
| Mangifera indica | A. fumigatus | 16 ± 2.65 a | 7 ± 0.58 a | 2.9 ± 0.96 b | 2.8 ± 0.51 b | 1.3 ± 0.04 a | 12.6 ± 0.67 b | |||||
| A. terreus | 17 ± 7.23 a | 7 ± 0.00 a | 3.1 ± 1.10 ab | 2.8 ± 0.67 b | 1.3 ± 0.21 a | 12.5 ± 5.30 b | ||||||
| A. glaucus | 20 ± 2.65 a | 7 ± 0.58 a | 4.2 ± 0.75 a | 3.4 ± 0.36 a | 1.3 ± 0.08 a | 17.1 ± 2.05 a | ||||||
| A. sclerotirium | 20 ± 8.89 a | 7 ± 0.58 a | 4.8 ± 1.36 a | 3.7 ± 0.17 a | 1.4 ± 0.13 a | 15.9 ± 1.38 ab | ||||||
| Control | A. fumigatus | 23 ± 14.84 a | 8 ± 3.06 a | 2.0 ± 0.35 b | 2.2 ± 0.25 b | 0.7 ± 0.33 b | 10.3 ± 2.27 b | |||||
| A. terreus | 13 ± 3.21 a | 7 ± 1.00 a | 2.2 ± 1.60 b | 2.3 ± 0.92 b | 0.6 ± 0.16 b | 10.2 ± 2.75 b | ||||||
| A. glaucus | 15 ± 3.00 a | 7 ± 1.15 a | 2.1 ± 0.78 b | 2.3 ± 0.57 b | 0.7 ± 0.24 b | 11.3 ± 2.25 b | ||||||
| A. sclerotirium | 17 ± 2.08 a | 7 ± 0.00 a | 2.6 ± 0.45 b | 2.5 ± 0.31 b | 0.7 ± 0.09 b | 11.0 ± 1.69 b | ||||||
Means with the same alphabets within a column are not significantly different at p < 0.05 using Duncan Multiple Range Test (DMRT) for separation of statistically significant means. The level of inhibition of mycelia growth of each pathogen on the culture medium is indicated by the number of (*) sign present compared to the control. Data collected were represented as “Means ± Standard Deviation (SD)” only
Table 7: Comparative assessment of plant parts after the first week (+ Nursery period) of administration of medium dosage of treatment in the experimental plots.
The leaflet dimension of the tomato plants in the experimental plot treated with 30% Botanicals + A. sclerotirium measured 4.8 ± 1.36 cm2, while TP + 30% Botanicals + A. glaucus measured 4.3 ± 1.18 cm2, TP + 30% Botanicals + A. terreus measured 3.1 ± 1.10 cm2 and 4.0 ± 1.77 cm2 was recorded for tomato leaflet dimension of TP + 30% Botanicals + A. fumigatus, compared to the leaflet dimensions of tomato plants in the control plot i.e., 2.6 ± 0.45 cm2 for TP + A. sclerotirium, 2.1 ± 0.78 cm2 for TP + A. glaucus, 2.2 ± 1.60 cm2 for TP + A. terreus, and 2.0 ± 0.35 cm2 for TP + A. fumigatus (Table 7).
The leaflet dimension recorded in the experimental plots treated with 45% Botanicals + A. sclerotirium was 3.4 ± 0.46 cm2, 3.7 ± 1.04 cm2 for TP + 45% Botanicals + A. glaucus, 3.3 ± 0.20 cm2 for TP + 45% Botanicals + A. terreus and 2.4 ± 0.86 cm2 for TP + 45% Botanicals + A. fumigatus, compared to the leaflet dimensions of tomato plants in the control plot i.e., 2.6 ± 0.45 cm2 for TP + A. sclerotirium, 2.1 ± 0.78 cm2 for TP + A. glaucus, 2.2 ± 1.60 cm2 for TP + A. terreus, and 2.0 ± 0.35 cm2 for TP + A. fumigatus (Table 8). In addition to the parameters mentioned, the plant height of tomato plants in the experimental plots treated with 30% and 45% botanical extracts were seen to show appreciable increase in plant height too compared to the control setup after week one of observation (Tables 7 and 8).
| 45% Conc. of Crude Extracts | ||||||||||
|---|---|---|---|---|---|---|---|---|---|---|
| Botanicals | Organisms | Number of Leaves | Number of Branches | Largest Leaflet Area (cm2) | Largest Leaflet Length (cm) | Stem Girth (cm) | Plant Height (cm) | |||
| Jatropha curcas | A. fumigatus | 16 ± 3.00 c | 8 ± 0.58 a | 2.4 ± 0.86 cd | 2.6 ± 0.57 bc | 0.9 ± 0.00 ab | 12.5 ± 3.55 a | |||
| A. terreus | 19 ± 3.06 b | 8 ± 0.58 a | 3.3 ± 0.20 ab | 2.9 ± 0.15 ab | 0.9 ± 0.09 ab | 13.1 ± 2.11 a | ||||
| A. glaucus | 18 ± 3.61 bc | 7 ± 1.00 a | 3.7 ± 1.04 a | 3.2 ± 0.36 a | 0.9 ± 0.00 ab | 13.5 ± 1.91 a | ||||
| A. sclerotirium | 19 ± 2.31 b | 7 ± 0.58 a | 3.4 ± 0.46 a | 3.0 ± 0.06 a | 0.9 ± 0.00 ab | 12.9 ± 0.30 a | ||||
| Mangifera indica | A. fumigatus | 15 ± 3.61 cd | 6 ± 0.58 a | 1.9 ± 0.75 d | 2.1 ± 0.40 c | 0.6 ± 0.27 b | 9.1 ± 2.08 b | |||
| A. terreus | 20 ± 3.46 ab | 8 ± 0.58 a | 2.6 ± 0.71 bc | 2.7 ± 0.42 b | 0.9 ± 0.00 ab | 12.3 ± 2.70 a | ||||
| A. glaucus | 20 ± 1.73 ab | 8 ± 0.00 a | 3.4 ± 0.66 a | 2.8 ± 0.30 ab | 1.0 ± 0.09 a | 13.5 ± 0.76 a | ||||
| A. sclerotirium | 20 ± 3.21 ab | 7 ± 0.58 a | 3.3 ± 0.12 ab | 3.0 ± 0.15 a | 1.0 ± 0.09 a | 12.9 ± 2.14 a | ||||
| Control | A. fumigatus | 23 ± 14.84 a | 8 ± 3.06 a | 2.0 ± 0.35 d | 2.2 ± 0.25 c | 0.7 ± 0.33 b | 10.3 ± 2.27 ab | |||
| A. terreus | 13 ± 3.21 d | 7 ± 1.00 a | 2.2 ± 1.60 cd | 2.3 ± 0.92 c | 0.6 ± 0.16 b | 10.2 ± 2.75 ab | ||||
| A. glaucus | 15 ± 3.00 cd | 7 ± 1.15 a | 2.1 ± 0.78 cd | 2.3 ± 0.57 c | 0.7 ± 0.24 b | 11.3 ± 2.25 ab | ||||
| A. sclerotirium | 17 ± 2.08 bc | 7 ± 0.00 a | 2.6 ± 0.45 bc | 2.5 ± 0.31b c | 0.7 ± 0.09 b | 11.0 ± 1.69 ab | ||||
Means with the same alphabets within a column are not significantly different at p ≤ 0.05 using Duncan Multiple Range Test (DMRT) for separation of statistically significant means. The level of inhibition of mycelia growth of each pathogen on the culture medium is indicated by the number of (*) sign present compared to the control. Data collected were represented as “Means ± Standard Deviation (SD)” only
Table 8: Comparative assessment of plant parts after the first week (+ Nursery period) of administration of high dosage of treatment in the experimental plots.
During the second week of observation of the tomato plants within the various experimental plots, the plants treated with 15, 30 and 45% medicinal extracts only showed appreciable increase in plant height (Tables 9-11) only. The height of tomato plants in the experimental plots treated with 15% Botanicals + A. sclerotirium was 26.6 ± 4.87 cm, while 15% Botanicals + A. glaucus gave 29.9 ± 1.07 cm, 15% Botanicals + A. terreus gave 25.0 ± 3.27 cm and 15% Botanicals + A. fumigatus was 24.3 ± 4.44 cm (Table 9). The tomato plants in the experimental plot treated with 30% Botanicals + A. sclerotirium showed 29.9 ± 4.13 cm increase in plant height, while 30% Botanicals + A. glaucus gave 31.4 ± 1.02 cm, 45% Botanicals + A. terreus gave 26.3 ± 5.35 cm and 45% Botanicals + A. fumigatus gave 29.5 ± 5.47 cm on the average (Table 10)
| 15% Conc. of Crude Extracts | ||||||||||||
|---|---|---|---|---|---|---|---|---|---|---|---|---|
| Botanicals | Organisms | Number of Leaves | Number of Branches | Largest Leaflet Area (cm2) | Largest Leaflet Length (cm) | Stem Girth (cm) | Plant Height (cm) | |||||
| Jatropha curcas | A. fumigatus | 28 ± 7.57 a | 6 ± 1.53 bc | 7.5 ± 1.35 a | 4.2 ± 0.47 ab | 1.2 ± 0.12 a | 23.4 ± 5.18 c | |||||
| A. terreus | 30 ± 4.73 a | 7 ± 1.00 abc | 7.9 ± 1.41 a | 4.5 ± 0.65 a | 1.1 ± 0.14 a | 25.0 ± 3.27 bc | ||||||
| A. glaucus | 32 ± 2.65 a | 8 ± 0.58 ab | 7.2 ± 1.25 ab | 4.4 ± 0.40 ab | 1.2 ± 0.09 a | 25.8 ± 0.58 abc | ||||||
| A. sclerotirium | 20 ± 16.50 a | 5 ± 4.36 c | 6.9 ± 4.98 ab | 4.4 ± 0.95 ab | 1.0 ± 0.45 a | 18.6 ± 10.14 c | ||||||
| Mangifera indica | A. fumigatus | 28 ± 3.06 a | 6 ± 1.00 bc | 6.7 ± 0.60 ab | 4.0 ± 0.62 ab | 1.2 ± 0.10 a | 24.3 ± 4.44 bc | |||||
| A. terreus | 25 ± 2.52 a | 7 ± 0.00 abc | 7.9 ± 0.44 a | 4.7 ± 0.26 a | 1.2 ± 0.0a2 a | 23.5 ± 0.25 abc | ||||||
| A. glaucus | 28 ± 1.00 a | 7 ± 0.58 abc | 8.7 ± 1.44 a | 4.8 ± 0.35 a | 1.2 ± 0.21 a | 29.9 ± 1.07 a | ||||||
| A. sclerotirium | 25 ± 2.31 a | 6 ± 0.00 bc | 10.4 ± 2.50 a | 5.2 ± 0.61 a | 1.2 ± 0.04 a | 26.6 ± 4.87 ab | ||||||
| Control | A. fumigatus | 40 ± 15.89 a | 11 ± 2.89 a | 4.9 ± 1.70 b | 3.6 ± 0.81 b | 1.2 ± 0.38 a | 18.6 ± 4.36 d | |||||
| A. terreus | 28 ± 8.66 a | 6 ± 1.53 bc | 9.3 ± 2.30 a | 4.8 ± 0.76 a | 1.2 ± 0.35 a | 23.3 ± 6.74 c | ||||||
| A. glaucus | 26 ± 5.57 a | 7 ± 1.53 abc | 8.4 ± 1.12 a | 4.4 ± 0.38 a | 1.2 ± 0.18 a | 22.3 ± 4.69 c | ||||||
| A. sclerotirium | 29 ± 2.08 a | 7 ± 0.00 abc | 8.5 ± 0.64 a | 4.5 ± 0.00 a | 1.2 ± 0.0 8 a | 24.1 ± 0.90 c | ||||||
Means with the same alphabets within a column are not significantly different at p < 0.05 using Duncan Multiple Range Test (DMRT) for separation of statistically significant means. The level of inhibition of mycelia growth of each pathogen on the culture medium is indicated by the number of (*) sign present compared to the control. Data collected were represented as “Means ± Standard Deviation (SD)” only
Table 9: Comparative assessment of plant parts after the second week (+ Nursery period) of administration of low dosage of treatment in the experimental plots.
| 30% Conc. of Crude Extracts | |||||||
|---|---|---|---|---|---|---|---|
| Botanicals | Organisms | Number of Leaves | Number of Branches | Largest Leaflet Area (cm2) | Largest Leaflet Length (cm) | Stem Girth (cm) | Plant Height (cm) |
| Jatropha curcas | A. fumigatus | 31 ± 2.89 a | 7 ± 0.58 abc | 9.1 ± 2.29 a | 4.7 ± 0.62 a | 1.2 ± 0.12 a | 29.5 ± 5.47 ab |
| A. terreus | 33 ± 5.13 a | 8 ± 1.53 ab | 6.9 ± 2.60 ab | 4.0 ± 0.86 ab | 1.1 ± 0.14 a | 26.3 ± 5.35 abc | |
| A. glaucus | 30 ± 7.37 a | 7 ± 1.15 abc | 9.5 ± 2.09 a | 4.8 ± 0.64 a | 1.2 ± 0.09 a | 28.5 ± 5.05 ab | |
| A. sclerotirium | 25 ± 2.08 a | 6 ± 0.58 bc | 8.9 ± 1.22 a | 4.8 ± 0.25 a | 1.0 ± 0.45 a | 27.6 ± 0.9 ab | |
| Mangifera indica | A. fumigatus | 23 ± 2.65 a | 6 ± 0.58 bc | 7.6 ± 1.99 a | 4.4 ± 0.61 ab | 1.2 ± 0.10 a | 25.8 ± 2.46 abc |
| A. terreus | 24 ± 6.66 a | 7 ± 1.73 abc | 7.2 ± 1.23 ab | 4.4 ± 0.46 ab | 1.2 ± 0.02 a | 24.0 ± 6.30 bc | |
| A. glaucus | 30 ± 2.52 a | 7 ± 0.58 abc | 10.5 ± 2.57 a | 5.1 ± 0.35 a | 1.2 ± 0.21 a | 31.4 ± 1.02 a | |
| A. sclerotirium | 32 ± 11.59 a | 7 ± 1.73 abc | 10.3 ± 1.36 a | 5.1 ± 0.36 a | 1.2 ± 0.04 a | 29.9 ± 4.13 a | |
| Control | A. fumigatus | 40 ± 15.89 a | 11 ± 2.89 a | 4.9 ± 1.70 b | 3.6 ± 0.81b | 1.2 ± 0.38 a | 18.6 ± 4.36 d |
| A. terreus | 28 ± 8.66 a | 6 ± 1.53 bc | 9.3 ± 2.30 a | 4.8 ± 0.76 a | 1.2 ± 0.35 a | 23.3 ± 6.74 bc | |
| A. glaucus | 26 ± 5.57 a | 7 ± 1.53 abc | 8.4 ± 1.12 a | 4.4 ± 0.38 ab | 1.2 ± 0.18 a | 22.3 ± 4.69 cd | |
| A. sclerotirium | 29 ± 2.08 a | 7 ± 0.00 abc | 8.5 ± 0.64 a | 4.5 ± 0.00 a | 1.2 ± 0.0 8 a | 24.1 ± 0.90 ab | |
Means with the same alphabets within a column are not significantly different at p < 0.05 using Duncan Multiple Range Test (DMRT) for separation of statistically significant means. The level of inhibition of mycelia growth of each pathogen on the culture medium is indicated by the number of (*) sign present compared to the control. Data collected were represented as “Means ± Standard Deviation (SD)” only
Table 10: Comparative assessment of plant parts after the second week (+ Nursery period) of administration of medium dosage of treatment in the experimental plots.
| 45% Conc. of Crude Extr acts | ||||||||||
|---|---|---|---|---|---|---|---|---|---|---|
| Bot anicals | Organisms | Number of Leaves | Number of Branches | Largest Le aflet Area (cm2) | argest Le aflet Length (cm) | Stem Girth (cm) | Pl ant Height (cm) | |||
| Jatropha curcas | A. fumig atus | 27 ± 3.61 a | 7 ± 1.53 bc | 7.8 ± 0.79 a | 4.7 ± 0.23 a | 1.3 ± 0.08 a | 26.5 ± 5.39 ab | |||
| A. terreus | 29 ± 4.58 a | 7 ± 0.58 bc | 8.2 ± 1.29 a | 4.5 ± 0.15 a | 1.3 ± 0.20 a | 23.9 ± 0.60 bc | ||||
| A. gl aucus | 27 ± 3.46 a | 6 ± 1.53 c | 9.6 ± 2.63 a | 4.8 ± 0.79 a | 1.4 ± 0.05 a | 29.3 ± 0.57 a | ||||
| A. sclerotirium | 30 ± 2.08 a | 7 ± 0.58 bc | 8.8 ± 1.36 a | 4.7 ± 0.32 a | 1.3 ± 0.04 a | 29.5 ± 2.65 a | ||||
| Mangifera indica | A. fumig atus | 27 ± 4.51 a | 7 ± 0.58 bc | 7.8 ± 2.04 a | 4.5 ± 0.56 a | 1.3 ± 0.16 a | 24.2 ± 4.75 ab | |||
| A. terreus | 36 ± 7.09 a | 8 ± 1.53 abc | 8.4 ± 1.53 a | 4.6 ± 0.75 a | 1.2 ± 0.04 a | 27.5 ± 3.00 ab | ||||
| A. gl aucus | 32 ± 2.31 a | 9 ± 1.00 ab | 9.4 ± 0.82 a | 4.6 ± 0.21 a | 1.3 ± 0.07 a | 30.2 ± 1.31 a | ||||
| A. sclerotirium | 29 ± 7.23 a | 7 ± 1.00 bc | 9.9 ± 0.25 a | 4.9 ± 0.12 a | 1.5 ± 0.09 a | 30.9 ± 1.22 a | ||||
| Control | A. fumig atus | 40 ± 15.89 a | 11 ± 2.89 a | 4.9 ± 1.70 b | 3.6 ± 0.81 b | 1.2 ± 0.38 a | 18.6 ± 4.36 c | |||
| A. terreus | 28 ± 8.66 a | 6 ± 1.53 c | 9.3 ± 2.30 a | 4.8 ± 0.76 a | 1.2 ± 0.35 a | 23.3 ± 6.74 bc | ||||
| A. gl aucus | 26 ± 5.57 a | 7 ± 1.53 bc | 8.4 ± 1.12 a | 4.4 ± 0.38 a | 1.2 ± 0.18 a | 22.3 ± 4.69 bc | ||||
| A. sclerotirium | 29 ± 2.08 a | 7 ± 0.00 abc | 8.5 ± 0.64 a | 4.5 ± 0.00 a | 1.2 ± 0.0 8 a | 24.1 ± 0.90 ab | ||||
Means with the same alphabets within a column are not significantly different at p < 0.05 using Duncan Multiple Range Test (DMRT) for separation of statistically significant means. The level of inhibition of mycelia growth of each pathogen on the culture medium is indicated by the number of (*) sign present compared to the control. Data collected were represented as “Means ± Standard Deviation (SD)” only
Table 11: Comparative assessment of plant parts after the second week (+ Nursery period) of administration of high dosage of treatment in the experimental plots.
The plant height of tomato plants in the experimental plots treated with 45% Botanicals + A. sclerotirium was 30.9 ± 1.22 cm, while 45% Botanicals + A. glaucus gave 30.2 ± 1.31 cm, 45% Botanicals + A. terreus gave 27.5 ± 3.00 cm and 45% Botanicals + A. fumigatus was 26.5 ± 5.39 (Table 11) compared to the height of tomato plants in the control plot treated sequentially with TP + A. sclerotirium, TP + A. glaucus, TP + A. terreus, and TP + A. fumigatus were 24.1 ± 0.90, 22.3 ± 4.69, 23.3 ± 6.74 and 18.6 ± 4.36 cm, respectively for each treatment.
Discussion
Laboratory analysis (In vitro)
A low dosage of the applied treatment totally inhibited the growth of Aspergillus sclerotirium only from the beginning of the experiment till the end but other pathogens were significantly unaffected. At medium dosage, the growth of A. Sclerotirium, A. glaucus and A. terreus were totally inhibited by the botanicals used for treatment.
A high dosage of the applied treatment had significant effects in the reduction of the growth of all the pathogens. This was in agreement with the works of Paul and Sharma [5] who reported total inhibition of the growth of some soil-borne pathogens (fungal species) using plant based treatments.
Field experimentation (In vivo)
In the experimental plots treated with the aqueous extracts of Jatropha curcas and Mangifera indica, the level of disease occurrence in the tomato plants were significantly reduced to zero percent, and in some cases, the level of disease observed was insignificant; whereas, in contrast to these observations, the control plot had severe disease occurrence. This was in accordance with the research work of Owolabi et al. [6], who reported that the occurrence of brown blotch disease of Vignia unguiculata (cowpea) was reduced by the application of botanicals.
Growth assessment in the field
The stem girth and leaflet dimensions of the tomato plants in all the experimental plots (except control plot) were significantly improved by the addition of the botanicals (M. indica and J. curcas) at low, medium and high dosages respectively, after one week of treatment. Most notable improvement for leaflet dimensions observed in the experimental plots treated with botanicals includes:
• Tomato Plants (TP) treated with low dosage of plant extract injected with A. sclerotirium, A. glaucus, A. terreus and A. fumigatus.
• Tomato plants in the experimental plot treated with medium dosage of plant extracts and injected with A. sclerotirium, A. glaucus, A. terreus and A. fumigatus.
• Tomato plants in the experimental plots previously inoculated with A. sclerotirium, A. glaucus, A. terreus and A. fumigatus treated with high dosage of botanical extracts, compared to the leaflet dimensions of tomato plants in the control plot.
In addition to the parameters mentioned, the plant height of tomato plants in the experimental plots treated with medium and high dosages of botanical extracts were seen to show appreciable increase in plant height too compared to the control setup after week one of observation.
During the second week of observation of the tomato plants within the various experimental plots, the height of tomato plants in the experimental plots treated with low Botanicals prior to inoculation with A. sclerotirium, A. glaucus, A. terreus and A. fumigatus was significantly improved. The tomato plants in the experimental plot treated with medium dosages of the plant extract after injection with A. sclerotirium, A. glaucus, A. terreus and A. fumigatus also had appreciable increase in plant height too.
The plant height of tomato plants in the experimental plots treated with high dosage of plant extracts after inoculation with A. sclerotirium, A. glaucus, A. terreus, and A. fumigatus showed significant improvement. This was in agreement with the research works of Wilson et al. [3], Silva et al. [7] and Ijato et al. [8], they re-iterated the importance of plant based fungicides in the control and improvement of growth/yield potentials of the treated plants.
Conclusion
The botanicals applied in the treatment of the tomato infection were effective in the total control of the pathogens when tested in the laboratory. It was equally effective in the eradication of potential disease outbreak on tomato plants when tested in the field. The plant extracts also had significant effect in the stimulation of growth of the tomato plants. These plant extract can be used as an effective replacement for the more systemic and hazardous chemicals because they are easy to prepare, economic and environmental friendly, with zero risk to life. Plant extracts have been proven to possess a high level of therapeutic, antimicrobial and antifungal effects that can be administered at safe levels. The derivatives of some plant can be useful in Agriculture, public health, medicine, and cosmetics industries. Hence, it can be suggested that further research should be carried out on these botanicals to further ascertain their usefulness as “bio-fertilizers” and as a major means for disease management not only for plants but animals inclusive with a targeted effort towards amelioration of human diseases.
Acknowledgment
I will like to acknowledge the efforts of Chief John O. Etaware and Mrs. Esther Etaware for their financial support towards the completion of this research. Your benevolence and benignity will never go unrewarded, God bless you both.
REFERENCES
- Wizard Recipes. Tomato, posted by admin., (www.wizardrecipes.com/blog). 2011;5.
- Food and Agricultural Research Organization of the United Nation (FAO) tomato integrated pests management (an ecological guide), FAO Rome.2000;204.
- Wilson CI, Solar JM, El-Ghanouth A, Wisniewski ME. Rapid evaluation of plant extracts and essential oils for antifungal activities against Botrytis cineria. J Plant dise. 1997;81:204-210.
- Joachim H. Physic nut (Jatropha curcas L.), International Plant Genetic Resources Institute, Rome, Italy. 1996;18-23.
- Paul PK, Sharma PD. Azadirachta indica leaf extract induced resistance in barley against leaf stripe disease. Physiolo Mol Plant Patholo. 2002;16:3-13.
- Owolade OF, Osikanlu YOK, Fadare TA. Control of brown blotch of cowpea using botanicals. J Crop Res. 2003;25(3):561-566.
- Silva N, Ganesan S, Banumatty N, Mutthuchelian P. Antifungal effect of leaf extract of some medicinal plant against Fusarium oxysporum causing wilt disease of Solanum melongena L., Ethnobotani Leaflets. 2008;12:156-163.
- Ijato JY, Oyeyemi SD, Ijadunola JA, Ademuyiwa JA. Alleopathic effects of leaf extract of Azadirachta indica and Chromolaena odorata against postharvest and transit rot of tomato (Lycopersicon esculentum L.). J America Sci. 2010;6(12)1595-1599.
Citation: Etaware PM, Etaware EU, Olaoluwa OO, Oyetunji OJ, Aiyelaagbe OO, Odebode AC (2019) The Impact Crude Plant Extracts: As Potential Biofertilizers and Treatment against Tomato Plant Infection. Plant Pathol Microbiol. 10:481. doi: 10.24105/2157-7471.10.481
Copyright: © 2019 Etaware PM, et al. This is an open-access article distributed under the terms of the Creative Commons Attribution License, which permits unrestricted use, distribution, and reproduction in any medium, provided the original author and source are credited.