PMC/PubMed Indexed Articles

Indexed In
- Open J Gate
- Genamics JournalSeek
- Academic Keys
- JournalTOCs
- CiteFactor
- Ulrich's Periodicals Directory
- Access to Global Online Research in Agriculture (AGORA)
- Electronic Journals Library
- Centre for Agriculture and Biosciences International (CABI)
- RefSeek
- Directory of Research Journal Indexing (DRJI)
- Hamdard University
- EBSCO A-Z
- OCLC- WorldCat
- Scholarsteer
- SWB online catalog
- Virtual Library of Biology (vifabio)
- Publons
- Geneva Foundation for Medical Education and Research
- Euro Pub
- Google Scholar
Useful Links
Share This Page
Journal Flyer
Open Access Journals
- Agri and Aquaculture
- Biochemistry
- Bioinformatics & Systems Biology
- Business & Management
- Chemistry
- Clinical Sciences
- Engineering
- Food & Nutrition
- General Science
- Genetics & Molecular Biology
- Immunology & Microbiology
- Medical Sciences
- Neuroscience & Psychology
- Nursing & Health Care
- Pharmaceutical Sciences
Research Article - (2021) Volume 12, Issue 8
Study of Coffee Thread Blight Disease (Corticium koleroga (Cke) Hoehnel) in Ethiopia
Nagassa Dechassa1*, Alemayehu Chala2, Kifle Belachew1 and Elfinesh Shikur22School of Plant and Horticultural Sciences, College of Agriculture, Hawassa University, Hawassa, Ethiopia
Received: 24-Jul-2021 Published: 27-Aug-2021, DOI: 10.35248/2157-7471.21.12.572
Abstract
Thread blight caused by Corticium koleroga is a devastating disease that causes severe damage to Coffea arabica in Ethiopia. However, it is one of the least researched diseases in Ethiopia. Therefore, the current work was designed with the objectives to (1) assess the intensity of the disease, (2) identify major factors associated with the disease intensity, (3) identify and characterize C. koleroga isolates and (4) determine the pathogenicity of C. koleroga isolates in southwest Ethiopia. For this purpose, field surveys were conducted on 180 farmers’ fields in 12 districts of southwest Ethiopia during 2017 cropping season. In addition, diseased samples were collected from 11 districts of southwestern Ethiopia during the study. The 11 C. koleroga isolates were characterized using macroscopic and microscopic features. The isolates were cultured on potato dextrose agar and incubated at 25 ºC for ten days. The treatments were arranged in a completely randomized design with three replications. The average thread blight incidence varied from 0% to 46% while mean disease severity ranged from 0% to 44%. The thread blight disease incidence and severity were higher at areas representing highland and midland altitudes compared with lowland altitudes. Thread blight severity was positively and strongly associated with rainfall (r = 0.75) and relative humidity (r = 0.85), but the disease severity was negatively and strongly associated with mean temperature (r = -0.79) and shade level (r = -0.50), while it was positively and intermediately correlated to altitude (r = 0.44) and coffee production systems (r = 0.36). The colony color of C. koleroga isolates were from white to floral white, with circular to irregular form and filiform to entire in margin on PDA plates. Growth rate of the isolates varied between 6 and 9 mm/day in diameter. Average basidiospore size ranged from 10 to 13.75 × 3.75 to 5 μ. All isolates were pathogenic to C. arabica with different lesion sizes. The present study revealed the importance of coffee thread blight, identified factors associated with the disease intensity and morphological characteristics of C. koleroga existing in southwestern Ethiopia. Future research should be directed towards surveying more agro-ecologies to have a complete picture on the importance of thread blight disease across the country and molecular characterization of the pathogen to recommend disease management strategies.
Keywords
Basidia; Basidiospore; Disease incidence; Isolates; Koleroga; Mycilium; Severity
Introduction
Coffee (Coffea arabica L.) is the world’s most important agricultural cash crop. Next to petroleum, it is the second most valuable traded commodity worldwide. The crop is produced in more than 80 countries including Ethiopia [1]. Ethiopia is considered as primary center of origin and diversification for C. arabica [2]. The worldwide coffee production in 2017/18 was 9.59 billion Kg, of which about 5.69 billion Kg (59.3%) was C. arabica [3]. Ethiopia was ranked as the first largest C. arabica producer in Africa and the fourth in the world after Brazil, Colombia and Honduras by producing about 423300.0 Kg (7.4% of world production) in 2017/18 cropping season [3].
Though, coffee play significant role in the international economy next to petroleum, the average national productivity has not exceeded 646 Kg/ha [4] which is less than half of that achieved in Latin America and Asia. This is partly due to the limited use of improved (technology and varieties) by most small-holder farmers and the wide spread and prevalence of insect pests, diseases and coffee weeds [5-9]. Diseases are the major constraints of coffee production in the country among which are fungal diseases attacking fruits, leaves, stems and roots and reduce the yield and marketability [5].
Cavalcante and Sales [10] reported that CTB disease caused by the phytopathogenic fungi (C. koleroga) is an important disease of Coffee in India, Trindad and Tobego. In Ethiopia the disease had first been recorded in 1978 at Gera and Mettu [11]. CTB diseases on Ethiopian coffee was known for more than 43 years and considered as minor coffee disease. But it is increasingly becoming an important disease and has been observed in wide coffee growing regions of Ethiopia as an epidemic disease in 2014 [7].
Although, CTB disease becomes very important disease in Ethiopia, there is limitation of quantified data that reflect the extent of its distribution and associated factors across different coffee agro-ecologies in Ethiopia and the features of the causative pathogen have not yet been characterized in the country. Therefore, this study was carried out to assess CTB disease intensity and associated factors at Southwest Ethiopia and morphological characterization of the disease causing pathogen.
Materials and Methods
Survey of coffee thread blight
Description of the survey areas: During the 2017 rainy season, field surveys were carried out in different coffee growing districts of Ilubabor and Jimma zones in Oromia, and Benchimaji and Sheka zones in SNNPRS. Mettu, Alle and Yayu from Ilubabor; Gera, Gomma and Shebesombo from Jimma; Debubbench, Shako and Gurafarda from Benchimaji; and Yaki, Andaracha and Masha districts from Sheka zones (Figure 1) were selected in order to assess the intensity of thread blight disease. From each of the selected districts, three coffee growing farmers’ associations were selected randomly. From each of the selected farmers’ associations, five coffee fields were randomly selected at intervals of 10-15 km along the main and accessible rural roads. From each coffee farm, based on the size of the farm, 30-50 trees at 6-8 m interval were used for disease assessment. The age of coffee trees varied from 3 to 30 years. During the survey small scale and large scale farms were considered.

Figure 1: Map of Ethiopia showing regions, zones and districts of Southwest Ethiopia included in the survey program.
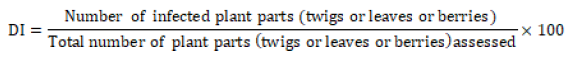
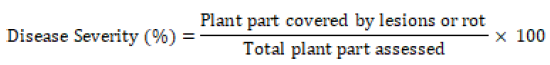
Assessment of coffee thread blight: Disease assessment was done by visual estimation method per individual sample of coffee tree. In visual estimation method, 30-50 coffee trees were randomly selected in diagonal path from each farm and the number of diseased twigs, leaves and berries were recorded separately and percent of disease incidence and severity were calculated per the mean of plant parts.Disease Incidence (DI):- The percent of disease incidence was computed for twigs, leaves and berries separately and converted to per plant basis by taking the mean of percent disease incidence of the three plant parts. Percent of disease incidence was computed according to the following equation.
Disease Severity (DS): - The data regarding the severity of CTB disease was recorded with the slight modification in scale (1-9) devised by Zadoks and Schein [12] whereas 1 = no disease, 2 = disease affecting 1 to 4% of plant part surface, 3 = 5 to 9%, 4 = 10 to 19%, 5 = 20 to 29%, 6 = 30 to 44%, 7 = 45 to 59%, 8 = 60 to 75%, and 9 ≥ 75% of plant part surface affected. Disease severity on tree leaves, berries and twigs was also estimated based on percent surface covered by lesions of the disease over total area observed. The percent of disease severity was computed for twigs, leaves and berries separately and converted to per plant basis by taking the mean of disease severity percentage of the three plant parts. This parameter was computed according to the following formula.
Identification of the factors associated with CTB
Shade types: - Data on shade type were collected at three levels, where coffee farms shaded with more than one tree species were recorded as mixed tree species, while those with only one tree species were recorded as mono tree species and un-shaded farms in open sun were recorded as no-shade [13].
Shade level: - nature of shade at each farm was assessed by visual estimation using a rating scale; No shade (open) = 100% light penetration, thin (low) shade = 99% to 70%, Medium shade = 69% to 40% and Thick (high) shade = 39% to 20% [13].
Varieties: - The kind of planted coffee variety was asked from the growers and the data were recorded.
Coffee yield pattern: - Yield bearing condition of the plant for example biennially or annually was asked from the growers and the data were recorded.
Besides, age of coffee grown in each farm, chemicals and fertilizers used over the past years were recorded during farmers’ interview.
Altitude: - Altitude in meters above sea level (m.a.s.l.) was recorded, using Geographic Positioning System (GPS) at a central point for each farm surveyed.
Meteorological data:- such as annual cumulative rainfall, mean temperature and relative humidity of the surveyed areas were obtained from the nearest meteorological stations (Table 1). The monthly weather data (rainfall, temperature and relative humidity) of the surveyed districts were summarized into yearly time scale. The missing daily data were filled by multiple imputation method using XLSTAT statistical software [14].
| Study sites | Altitude (m.a.s.l) | Location | Annual rainfall(ml) | Mean temperature (ºC) (Minimum-maximum) |
Relative Humidity (%) | |
|---|---|---|---|---|---|---|
| Debubbench | 1192 | 6º95’N 36º00’E | 1878.12 | 14.98 | 27.87 | 70.84 |
| Shako | 1150 | 7º04’N 35º25’E | 1535.40 | 13.80 | 31.40 | 71.03 |
| Gurafarda | 1259 | 6º52’N 35º18’E | 1568.88 | 15.24 | 28.28 | 70.28 |
| Masha | 2282 | 7º75’N 35º47’E | 2032.12 | 10.47 | 22.81 | 75.70 |
| Yaki | 1285 | 7º20’N 35º33’E | 1491.56 | 15.11 | 29.79 | 69.45 |
| Andarach | 1816 | 7º28’N 35º23’E | 1820.21 | 12.10 | 24.00 | 74.25 |
| Mettu | 1550 | 8º30’ N 36º00’E | 1948.56 | 12.00 | 27.00 | 74.50 |
| Yayu | 1700 | 8º33’N 35º72’E | 1664.00 | 13.44 | 28.63 | 69.67 |
| Alle | 2033 | 8º13’N 35º53’E | 1811.49 | 14.08 | 24.41 | 75.40 |
| Gera | 1940 | 7º70’N 36º00’E | 1645.13 | 10.52 | 24.35 | 75.03 |
| Gomma | 1666 | 7º85’N 36º60’E | 1521.01 | 11.90 | 28.65 | 72.73 |
| Shebesombo | 1813 | 7º50’N 36º52’E | 1558.72 | 14.16 | 26.18 | 70.21 |
Table 1: Geographic description and average 11 years weather data of districts included in the survey program.
Isolation and macroscopic and microscopic identification
Isolation of the pathogen: Coffee parts exhibiting typical symptoms of thread blight were collected from 11 coffee farms (Table 2). Pathogen isolation was done following standard procedures in Plant Pathology Laboratory at Jimma Agricultural Research Centre (JARC). For isolation of fungal pathogen, the diseased coffee twigs were cut with a sharp sterilized blade into small bits along with some healthy portions. The sections were then surface-sterilized by dipping into 5% sodium hypochlorite (NaOCl) solution for one minute and rinsed thrice with sterile distilled water (SDW) and finally dried on sterile tissue paper. Then the sections were transferred to potato dextrose agar (PDA) medium in sterilized Petri-plates and incubated at 25°C for five days. The isolates were then purified using hyphal tip isolation technique [15].
| Region | Zone | Districts | Kebele (PA) | Altitude (m.a.s.l.) |
|---|---|---|---|---|
| Oromia | Jimma | Shebesombo | Angecha | 1795 |
| Oromia | Jimma | Gera | Sadiloya | 1951 |
| Oromia | Jimma | Gomma | Gembe | 1650 |
| Oromia | Ilubabor | Alle | Segibaki | 1838 |
| Oromia | Ilubabor | Mettu | Geyi | 1555 |
| Oromia | Ilubabor | Didu | Gordomo | 1890 |
| Oromia | Ilubabor | Yayu | Dorani | 1944 |
| SNNPRS | Benchimaji | Shako | Berhanekontir | 1085 |
| SNNPRS | Benchimaji | Debubbench | Abiy-3 | 1550 |
| SNNPRS | Sheka | Andaracha | Duyina | 1816 |
| SNNPRS | Sheka | Masha | Yepho | 1760 |
Table 2: Description of coffee thread blight samples and sample collection from 11 districts of southwestern Ethiopia in 2017 cropping season.
Macroscopic identification
Growth rate of C. koleroga isolates: Mycelial discs (5 mm in diameter) of five day old culture of C. koleroga isolates were transferred to the centre of PDA plates and incubated at 25ºC. Three replications were maintained for each isolate in a completely randomized design (CRD). The colony diameter was recorded at 48 hours interval after incubation. Growth per day was calculated using the following formula:

The other colony characters, such as form, margin and color were recorded on underside of plate 10 days after incubation.
Microscopic identification: Ten days old cultures of all the isolates were characterized by using morphological features. Temporary mounts were studied under compound microscope (Germany) for hyphal (width), basidiospore (width, length) and basidia (shape, color and stages) features. Before measuring the length and width of basidiospores and hyphal diameters, ocular micrometer was calibrated by stage micrometer of compound microscope at 40x objective lens. For each isolate, length and width of 30 randomly taken basidiospores and hyphal width of 30 hyphae per isolate were measured through calibrated ocular micrometer under compound microscope at 40x objective lens. Comparisons of morphological characteristics were made using appropriate information sources or reference laboratory manuals, such as plant pathology guidebooks, global plant protection information system, and the American Phytopathological Society guidelines [16].
Pathogenicity test: Pathogenicity tests of the 11 Corticium koleroga isolates were conducted on the susceptible C. arabica (74110 variety) using the detached twig and leaf methods in air-conditioned growth room. Twigs and leaves were surface-sterilized with 5% sodium hypochlorite (NaOCl) solution and rinsed twice in sterile distilled water before inoculation.
Inoculum preparation and inoculation with suspension: Spore suspension was prepared from a seven day old culture of C. koleroga isolates by adding 20 mL of sterile distilled water (SDW) to the Petridish with good colony growth, which was then gently swirled to dislodge the spores. The spore concentration was adjusted to 2 × 10⁶ basidiospores per milliliters using haemocytometer (Germany). Sterilized detached coffee leaves and twigs were brushed with C. koleroga inoculum suspension using sterile inoculating brush. The inoculated leaves and twigs were kept in plastic box with dimension WxLxD, 15 cm × 20 cm × 15 cm containing moist soft paper and covered with transparent plastic sheet on compartment in airconditioned growth room. The inside of each box was misted with sterile distilled water using hand sprayer once in an interval of three days. The treatments were arranged in a completely randomized design (CRD) with three replications.
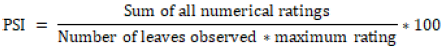
Data collection: Data on incubation period were recorded. Data on lesion sizes (in cm on twigs and % lesion on leaves) were recorded at 20 days after inoculation. Percentage of infected twigs length was obtained from the lesion length divided by total twig length and multiplied by one hundred [17]. Area of leaf lesions were evaluated using 0-5, score scales on the typical thread blight lesions developed on the leaves, at 20 days after inoculation. Percent disease severity index (PSI) was calculated as per Wheeler [18].
Re-isolation of pathogen: Then 20 days after inoculation, inoculated twigs and leaves showing active thread blight symptoms were aseptically re-isolated to PDA Petri-plates and incubated at 25ºC for seven days. The obtained cultures were checked for cultural and morphological characters to confirm the fulfillment for Koch’s postulates.
Data analysis: Data on disease incidence and severity were analyzed using descriptive statistics. The associations of disease incidence and severity with independent variables such as altitude, production systems, shade level, yield pattern, coffee varieties and meteorological data were analyzed using Pearson correlation and regression using SPSS 20.0 software package [19]. Data of colony growth rate, hyphal diameter, spore dimension (width and length), and lesion size were analyzed using analysis of variance (ANOVA) with least significant difference (LSD) at 5% probability level by using SAS Software Version 9.3 [20].
Results
Coffee thread blight intensity across southwest parts of Ethiopia
Thread blight intensity among the surveyed administrative districts of the Southwest part of Ethiopia was also highly variable. At district level, the disease severity ranged between 0 to 44.04%. The highest mean CTB disease incidence (45.86%) and severity (44.04%) were recorded in Masha district followed by Mettu, Andaracha, Alle, Gera and Gomma in that order. On the other hand, the disease was absent (0% incidence) in Debubbench, Yaki and Gurafarda districts (Table 3).
| Zone | District | No. of farms surveyed | Altitude (m.a.s.l.) | Incidence (%) | Severity (%) |
|---|---|---|---|---|---|
| Sheka | Masha | 15 | 1550-2010 | 45.86 | 44.04 |
| Ilubabor | Mettu | 15 | 1550-1974 | 42.65 | 40.04 |
| Sheka | Andaracha | 15 | 1220-1830 | 27.53 | 22.26 |
| Ilubabor | Alle | 15 | 1350-1838 | 25.55 | 22.56 |
| Jimma | Gera | 15 | 1616-1989 | 21.05 | 19.04 |
| Jimma | Gomma | 15 | 1550-1675 | 19.23 | 17.33 |
| Ilubabor | Yayu | 15 | 1420-1969 | 13.85 | 12.32 |
| Benchimaji | Shako | 15 | 1072-1724 | 2.70 | 2.58 |
| Jimma | Shebesombo | 15 | 1550-1795 | 1.28 | 1.14 |
| Benchimaji | Gurafarda | 15 | 1070-1414 | 0 | 0 |
| Benchimaji | Debubbench | 15 | 985-1293 | 0 | 0 |
| Sheka | Yaki | 15 | 1189-1260 | 0 | 0 |
Table 3: Incidence and severity of thread blight at districts of southwest Ethiopia in 2017.
Factors affecting thread blight disease
Shade levels: There was highly significant (p < 0.01) and negative correlation between shade level on one hand and CTB disease incidence and severity (r = -0.51) on the other (Table 4). The disease became more intense as shade level decreases. Accordingly, the highest mean disease incidence (64.08%) and severity (57.28%) were recorded under full sun light (open) growing conditions. Low, medium and high shade levels had CTB incidence and severity of 37.58% and 32.63%, 6.73% and 6.44%, and 4.65% and 4.19%, respectively. This pattern could have resulted from the following reasons: a) shade tree prevents fruit loads (optimizes fruits to leaves ratio) [21,22], b) it modifies microclimate conditions [21,22], c) it serves as habitat for a large number of species which are directly involved in pest and disease bio-control [23], d) it limits the splash dispersal of propagules which serve as inoculum [24].
| DI | DS | SL | ST | Alt | PS | YP | |
|---|---|---|---|---|---|---|---|
| DI | |||||||
| DS | 0.99** | ||||||
| SL | -0.51** | -0.51** | |||||
| ST | -0.49** | -0.48** | 0.66** | ||||
| Alt | 0.43** | 0.44** | -0.21** | -0.23** | |||
| PS | 0.39* | 0.36* | 0.05ns | -0.05ns | -0.12 | ||
| YP | -0.45** | -0.43** | -0.03ns | 0.04ns | 0.09ns | -0.78** | |
| Variety | -0.03 ns | -0.03 ns | -0.24** | -0.13 ns | -0.16* | -0.01 ns | -0.003 ns |
Table 4: Pearson correlation coefficients between disease intensity and associated factors.
Shade type: In this study, there was highly significant difference (p < 0.01) and negative intermediate correlation between shade type and CTB disease incidence (r = -0.49) and severity (r = -0.48) (Table 4). The disease became more intense under no shade followed by mono-shade, whereas low disease incidence and severity were recorded under mixed shade types. Correspondingly higher average disease incidence (41.56%) and severity (37.34%) were recorded under un-shaded farms followed by farms with single tree species (13.42% and 12.58%) and the lowest (12.67% and 11.77%) diseases incidence and severity, respectively, in farms with mixed tree species.
Coffee production systems: There was significant (p < 0.05) and positive intermediate correlation between coffee production systems and CTB disease incidence (r = 0.39) and severity (r = 0.36) (Table 4). The disease became more intense in plantation followed by garden, semi forest and forest coffee production systems. The occurrence of CTB is higher in plantations and gardens with poor cultural practices, especially, when the normal rounds of pruning unnecessary twigs are not practiced and optimum shade is not provided. The probable reason for the variation in intensity of the disease among the different production systems could be the effect of human interference.
Coffee yield pattern and variety: There was highly significant (p < 0.01) and negative intermediate correlation between coffee yield pattern and CTB disease incidence (r = -0.45) and severity (r = -0.43) (Table 4). Higher mean disease incidence of 21.70% and severity of 19.87% were recorded in the annual than in the biennial coffee. There was negative weak correlation between coffee varieties and CTB disease incidence (r = -0.02) and severity (r = -0.03) (Table 4). The disease became more intense (mean incidence of 17.47% and severity of 16.27%) on local varieties than on improved varieties.
Altitude
Altitude is also one of the factors positively associated with CTB disease. There was a positive intermediate correlation between altitude and incidence (r = 0.43) and severity (r = 0.44) of CTB disease (Table 4). The highest mean disease incidence (28.09%) and severity (25.70%) across gradients were recorded at highland coffee producing areas, whereas percent of disease incidence and severity were very low at lowland areas with mean disease incidence of 4.04% and severity of 3.69%. As in the cases of districts such as Masha, Mettu, Andaracha, Alle, Gera, Gomma and Yayu, which are located in medium to higher altitude (>1500 m.a.s.l), the percent of disease incidence and severity increased with increasing altitudes. This might be because of prolonged rainfall and storms accompanied by hail in the highland areas like Mettu and Masha.
Meteorological Factors
Thread blight incidence and severity had highly significant (p < 0.01) correlations with cumulative rainfall (r = 0.74 and r = 0.75, respectively), relative humidity (r = 0.86 and r = 0.85, respectively) and mean temperature (r = -0.81 and r = -0.79, respectively) (Table 5).
| Incidence | Severity | Rainfall | Relative Humidity | |
|---|---|---|---|---|
| Incidence | ||||
| Severity | 0.99** | |||
| Rainfall | 0.74** | 0.75** | ||
| Relative Humidity | 0.86** | 0.85** | 0.67* | |
| Temperature | -0.81** | -0.79** | -0.62* | -0.86** |
Table 5: Pearson correlation coefficients between disease intensity and meteorological factors.
The result of this research indicated that the decreased level of rainfall and relative humidity may lead to decreased incidence and severity of thread blight disease on C. arabica. Whereas the periods of high and prolonged rainfall and high relative humidity, which result in prolonged periods of plant parts wetness, are the most important meteorological factors influencing the occurrence and further development of CTB disease in the field.
Morphological Characterization of the Pathogen
Symptomatological Identification
In the field, thread blight disease on C. arabica appeared as threadlike white to ashen strand on the middle stem of the coffee tree at first (Figure 2A) and then the black plus whitish strands of nodes, internodes of the twigs (Figure 2B). The blackening of leaf petiole later spread to leaf blade predominantly on the lower surfaces of leaves. The strands always branch off from the leaf petioles to leaves and then spread out into numerous fine ones. The fine strands initiated dark-ashen necrosis and as the whole leaf became involved, the leaf separated at the petiole but usually remained hanging from mycelial strand that grew over the petiole from the branch (Figure 2C). On berries, the sunken black with ashen myceilial strands were seen as necrotic symptoms of the disease (Figure 2D).

Figure 2: Thread blight on Coffea arabica was seen as thread-like white to ashen strand on A) Middle stem, B) Branch, C) Leaf and D) Berries observed at Mettu, in 2017 cropping season.
Macroscopic and Microscopic Identification
Macroscopic Identification
Growth Rate of Mycilia
The study revealed considerable colony growth rate variations among C. koleroga isolates collected from different coffee producing regions of Ethiopia. Isolates differed highly and significantly (p £ 0.01) in growth rate in diameter ranging between 6 and 9 mm day-1, with a mean of 8.02 mm day-1 in diameter (Table 6). Isolates from midland areas had the fastest (8.55 mm day-1 on average) growth rate, while isolates from highland areas grew slowly (mean growth rate of 7.09 mm day-1 in diameter). Isolates of C. koleroga collected from Andaracha, Shebesombo, Mettu and Shako grew the fastest (8.5 to 9 mm day-1), followed by isolates from Yayu, Didu and Masha, which grew at 8.1 to 8.4 mm day-1. Isolates from Agaro, Debubbench, Gera and Alle had slow (6.40 to 7.50 mm day-1) growth rate in diameter. In the present study, C. koleroga isolates showed periodic changes in their growth rates. Generally all the isolates showed an increasing trend in growth rate from 2 days onward up to 8 days but growth rate decreased or declined afterwards.
| Isolates | GR (mm) | HT (µ) HD | SW (µ) SW | SL (µ) SL | |||
|---|---|---|---|---|---|---|---|
| Range | Average | Range | Average | Range | Average | ||
| Andarach | 9.00a | 3.75-5 | 4.84 | 3.75-5 | 4.84 | 11.25-13.75 | 12.71ab |
| Shebesombo | 8.97a | 3.75-5 | 4.84 | 3.75-5 | 4.84 | 11.25-13.75 | 12.65ab |
| Mettu | 8.80a | 3.75-5 | 4.79 | 3.75-5 | 4.88 | 12.50-13.75 | 12.58ab |
| Shako | 8.50b | 3.75-5 | 4.88 | 3.75-5 | 4.79 | 12.50-13.75 | 12.83a |
| Yayu | 8.40bc | 3.75-5 | 4.84 | 3.75-5 | 4.75 | 10.00-12.50 | 11.75cd |
| Didu | 8.13bc | 3.75-5 | 4.96 | 3.75-5 | 4.96 | 10.00-12.50 | 11.67d |
| Masha | 8.10d | 3.75-5 | 4.84 | 3.75-5 | 4.84 | 12.50-13.75 | 12.62ab |
| Agaro | 7.50e | 3.75-5 | 4.84 | 3.75-5 | 4.92 | 10.00-12.50 | 12.55b |
| Debubbench | 7.43e | 3.75-5 | 4.92 | 3.75-5 | 4.96 | 10.00-12.50 | 11.75cd |
| Gera | 6.73f | 3.75-5 | 4.79 | 3.75-5 | 4.79 | 10.00-12.75 | 12.67ab |
| Alle | 6.46f | 3.75-5 | 4.84 | 3.75-5 | 4.88 | 10.00-12.25 | 12.00c |
| CV (%) | 2.04 | 1.74 | 2.20 | 1.23 | |||
| LSD (0.05) | 0.28 | 0.12 | 0.18 | 0.26 | |||
Table 6: Colony growth rate, hyphal width, spore width and length of C. koleroga isolates of southwestern Ethiopia in 2017 cropping season.
Colony Color, Elevation and Margin
Colony color, form, elevation and margin did not differ very much among the tested isolates of C. koleroga on PDA medium (Table 7 and Figure 3). The C. koleroga isolates produced mycelia with white to floral white front and back side color, filiform to entire margins and irregular to circular in form and produced in abundance. Front side colony color of almost all isolates in the culture were white except isolates form Gera, which seems floral white and the back side colony color of Alle, Andaracha, Gera, Masha, Mettu, Shako and Yayu isolates were floral white. On the other hand, Agaro, Didu, Debubbench and Shebesombo isolates seemed to have white back side colony color. Colony elevations of all isolates were flat. The colony margins of all the isolates were entire, except that of Shako and Masha isolates that had filiform colony margin
| Isolates | Colony color | Colony | ||||
|---|---|---|---|---|---|---|
| Front | Back | Form | Elevation | Margin | ||
| Mettu | White | Flora white | Circular | Flat | Entire | |
| Alle | White | Floral white | Circular | Flat | Entire | |
| Yayu | White | Floral white | Circular | Flat | Entire | |
| Gera | Floral white | Floral white | Circular | Flat | Entire | |
| Agaro | White | Floral white | Circular | Flat | Entire | |
| Andaracha | White | Floral white | Circular | Flat | Entire | |
| Masha | White | Floral white | Irregular | Flat | Filiform | |
| Shako | White | Floral white | Irregular | Flat | Filiform | |
| Debubbench | White | White | Circular | Flat | Entire | |
| Shebesombo | White | White | Circular | Flat | Entire | |
| Didu | White | White | Circular | Flat | Entire | |
Table 7: Cultural characteristics of Corticium koleroga isolates on Potato Dextrose Agar (PDA) at 10 days incubation.

Figure 3: Colony morphology of C. koleroga isolates on PDA at 10 days incubation: A) Front side and B) Back side reverse.
Microscopic Identification
Hyphae
Pure culture of C. koleroga showing long, hyaline, wide angled branching mycilia (Figure 4B) and more or less uniform hyphal width (thickness) measuring 3.75 to 5.00 μ (Figure 4C and Table 3) were observed under microscope.

Figure 4: A) Colony morphology of a 7-day-old culture of isolate from Agaro, B) Hyphae of C. koleroga under microscope, C) Hyphal diameter under 40x objective compound microscope of isolate from Agaro.
The texture of the hyphae of C. koleroga seemed too filamentous because mostly the mycilia of all the isolates were found in compacted form in groups. Once the pathogen started to produce basidiospores, the basidiospores were found scattered over the surface of the hyphae, which is due probably to the presence of gelatinous materials over the surface of hyphae.
Basidia
The result of this study indicated that the basidia of Corticium koleroga are ellipsoid to oblong in shape, hyaline in color, not septate, thicker than width of supporting hyphae on which 4-6 basidiospores are directly fixed. It produces the primary basidial cell (probasidium), which is preceded by the final stage of the basidium (metabasidium) and that is collapsed after spore formation (Figure 5). This result is in harmony with previous reports [25-28].

Figure 5: Fruiting body of the fungus C. koleroga :- A) Basidiole B) Probasidia, C) Metabasidia D) Collapsed basidia and basidiospores under compound microscope of 40x objective lens of isolate from Agaro.
Basidiospores
Basidiospores produced by isolates of C. koleroga collected from different parts of southwestern Ethiopia are fusiform in shape (Figure 6). Statistically there were no significant differences in width of basidiospores among the isolates but there were statistically significant difference (p ≤ 0.05) among the isolates in spore length. The length and width of basidiospores varied from 10 to 13.75 μ × 3.75 to 5 μ, respectively. Basidiospores of C. koleroga appeared as smooth, hyaline, narrow and fusiform in shape measuring 10 to 13.75 μ × 3.75 to 5 μ in size (Tables 6-8).

Figure 6: Basidiospores of C. koleroga under compound microscope at 40x magnification. A)A group of six basidiospores, B) Scattered basidiospores, C) Agglutinated mycilia with basidiospores.
| Isolates | Basidia | Basidiospore | ||||||
|---|---|---|---|---|---|---|---|---|
| Probasidia | Meta- basidia |
Colour | Shape | Colour | Shape | Septa | ||
| Mettu | + | + | Hyaline | Oblong | Hyaline | Fusiform | - | |
| Alle | + | + | Hyaline | Oblong | Hyaline | Fusiform | - | |
| Yayu | + | + | Hyaline | Ellipsoid | Hyaline | Fusiform | - | |
| Gera | + | + | Hyaline | Ellipsoid | Hyaline | Fusiform | - | |
| Agaro | + | + | Hyaline | Oblong | Hyaline | Fusiform | - | |
| Andaracha | + | + | Hyaline | Oblong | Hyaline | Fusiform | - | |
| Masha | + | + | Hyaline | Oblong | Hyaline | Fusiform | - | |
| Shako | + | + | Hyaline | Oblong | Hyaline | Fusiform | - | |
| Debubbench | + | + | Hyaline | Ellipsoid | Hyaline | Fusiform | - | |
| Shebesombo | + | + | Hyaline | Oblong | Hyaline | Fusiform | - | |
| Didu | + | + | Hyaline | Ellipsoid | Hyaline | Fusiform | - | |
Table 8: Morphological characteristics of Corticium koleroga isolates collected from some districts of southwestern Ethiopia in 2017 cropping season.
The basidiospores were found to adhere or cluster frequently in groups of four to six, which would indicate that most probably basidia have six basidiospores (Figure 6A), which agreed with the work of Wakefield [29] and Hoehnel [30]. The mycilia and basidiospores of C. koleroga appeared to be attached together into a layer, so that not a basidiospores or mycilium can be removed from the mass without difficulty (Figure 6C) as described by Rogers [27].
The basidiospores were scattered over the surface of hyphae and seated on it and separated from each other with difficulty. Basidiospores were attached and scattered over the mycelia at irregular intervals on the threads without any visible pedicel (Figure 6C). This mode of attachment is obviously imaginary like the device of the gelatinous matrix.
Pathogenicity Tests
The pathogenicity tests with eleven isolates were done on detached leaves and twigs of Coffea arabica susceptible variety 74110. Lesions of thread blight became visible on detached twigs and leaf petioles at the 6th day after inoculation with the C. koleroga isolates from Yayu and Andaracha. The infection sizes were initially small (≤ 3 mm in length), black to ashen strands on twigs and (≤ 13%) black leaf petiole later expanded or extended to leaf blade. The necrotic symptoms described earlier were the same as that observed on leaves and twigs of C. arabica plants by natural infection in the field, whereas no symptoms developed on the control leaves and twigs (Figures 7 and 8). Re-isolation of the fungus from symptomatic twig and leaf tissues (inoculated with the isolates) was done on PDA medium. The morphology and cultural characteristics of pure cultures of the re-isolated fungus were the same as that of the original culture of the isolates, fulfilling Koch’s postulates.

Figure 7: Pathogencity symptom on A) Water sprayed 20 days after sprayed B) Andaracha isolate inoculated on leaf 10 days after inoculation (DAI) C) Andaracha isolate inoculated on leaf 20 DAI.

Figure 8: Pathogencity symptoms on A) Water sprayed 20 days after sprayed on twigs B) Yayu isolate inoculated on twigs 10 DAI C) Yayu isolate inoculated on twigs 20 DAI.
Longer incubation period of 6 to 10 days was required for symptom development on the detached twigs probably due to non-succulent woody tissue of the coffee twigs and low germination of the basidiospores, whereas relatively shorter incubation period of 5 to 8 days was required for symptoms development on detached leaves because of the availability of the stomata on the leaves in nature [31]. The result of the test revealed that both twigs and leaves of coffee can be infected by the C. koleroga isolates. There was highly significant difference (p ≤ 0.01) in thread blight lesion size among C. koleroga isolates in detached twig and leaf inoculation tests.
All isolates of C. koleroga tested in the current experiment were pathogenic and destructive on both Coffea arabica twigs and leaves. Average lesion size on the twigs varied from 52% by Shebesombo isolate to 94% by Yayu isolate, when evaluated at 20 days after inoculation (Table 5). On the detached leaves, le sion size ranged between 70% in Debubbench isolate and 99% in Yayu isolate at 20 days after inoculation. These current results suggest a slight difference in CTB intensity on the leaves and twigs with the former being more susceptible than the latter (Table 9).
| Isolates | Lesion size on twig (%)* | Lesion size on leaf (%)* |
|---|---|---|
| Yayu | 94.43a | 96.67a |
| Mettu | 91.33a | 95.25ab |
| Andarach | 90.48ab | 98.50a |
| Masha | 80.45abc | 84.97abc |
| Shako | 77.89a-c | 78.63abc |
| Shebesombo | 74.12b-d | 74.18bc |
| Gera | 71.08cd | 74.53bc |
| Debubbench | 70.78cd | 69.50c |
| Didu | 63.78c-e | 71.83c |
| Alle | 60.55de | 71.00c |
| Agaro | 51.65de | 71.07c |
| Control | 0.00e | 0.00d |
| LSD (0.05) | 15.33 | 9.19 |
| CV (%) | 8.17 | 9.89 |
Superscripted letters show statistical significance
Table 9: Severity of thread blight on coffee plant parts inoculated with C. koleroga isolates collected from 11 districts of southwestern Ethiopia in 2017 cropping season.
These tests also revealed that Yayu and Andaracha isolates of Corticium koleroga, were more aggressive on both twigs and leaves than other C. koleroga isolates collected from different locations. Both areas represent midlands.
Conclusions
Coffea arabica is prone to thread blight disease that attacks coffee tree and reduce yield and marketability. CTB disease is becoming an important disease in coffee producing areas of Ethiopia. The disease intensity varied across the surveyed regions, zones and districts. The average thread blight incidence varied from 0 to 46% while mean disease severity ranged from 0 to 44% across the surveyed districts. The highest mean disease incidence (46%) and severity (44%) was recorded at Masha followed by Mettu with mean DI (42%), DS (40%). On the other hand, the disease intensity was absent in Debubbench, Yaki and Gurafarda districts.
Cumulative rainfall, relative humidity, mean temperature, altitude, coffee production system, shade levels and types have considerable impact on the intensity of thread blight. Increased level of rain fall and relative humidity were associated with an increased risk of thread blight disease development on C. arabica. Besides, disease intensity was the highest at midland and highland altitudes, plantation coffee production systems, open shade level and local coffee varieties.
Based on signs and symptoms on coffee tree, cultural and morphological characters the identity of the pathogen was confirmed to be Corticium koleroga. C. koleroga isolates had cultural colony colour ranging from white to floral white, with filiform to entire margins, growth rate ranged 6 to 9 mm/day, hyphal width ranged 3.75 μ to 5 μ, and basidiospore size ranged from 10 to 13.75 μ × 3.75 to 5 μ. All C. koleroga isolates tested for pathogenicity were pathogenic to coffee twigs and leaves with different aggressiveness.
The Way Forward
Since the present status of thread blight is remarkably on increasing trend, it is recommended to:-
1. Carry out successive surveys of thread blight disease in all coffee growing areas across the country to have a complete picture on the importance of the disease across coffee agroecologies.
2. Further investigate the impacts of weather variables and other factors on thread blight intensity under different agroecological conditions in multi-location and multiyear trials to come up with conclusive results.
3. Identify the pathogen associated with thread blight disease by molecular means to confidentially confirm the pathogen.
4. Enhance location based evaluation of coffee genotypes both at field and greenhouse to develop thread blight resistant coffee varieties.
5. Study safe, effective and environmentally friendly disease management options such as cultural practices, biological control, fungicides and integrated disease management.
Acknowledgments
The authors would like to thank Ethiopian Institute of Agricultural Research (EIAR) for the financial support. Special thanks also go to Jimma Agricultural Research Centre (JARC) and Mettu Agricultural Research sub-Centre (MARsC) for facilitating logistical support.
The authors also acknowledge the colleagues at JARC especially Mr. Legese H., Mr. Minda T., Mr. Ibrahim A., Mr. Belay A., Mr. Gemechu Asefa, Mr. Dawit M, Miss. Yeshi Siraj, Mr. Dereje and MARsC especially Mr. Selemon A., Miss. Mitike K., Mr. Tesfaye B., Mr. Gemechu F. and Mr. Getachew A. for their helpful suggestions and technical support during the study.
REFERENCES
- Musoli P, Cubry P, Aluka P, Billot C, Dufour M, Bellis T, et al. Genetic Differentiation of Wild and Cultivated Populations: Diversity of Coffea canephora Pierre in Uganda. Genome. 2009;52:634-646.
- Fernie L. Improvement of Arabica Coffee in East Africa. In: Leakey (ed) Crop Improvement in East Africa. Billing and Sons Limited, Guildford and London. 1970:231-249.
- FAS (Foreign Agricultural Service/USDA). Coffee: World Markets and Trade. 2018.
- CSA (Central Statistical Agency). Agricultural Sample Survey for The 2018/2019 Crop Season. Volume I Report on Area and Production of Major Crops Private Peasant Holdings, Meher Season. Statistical Bulletin, FDRE/CSA. 2019.
- Girma A, Chala J, Arega Z, Abraham T. Advances in Coffee Diseases Research in Ethiopia. Abraham Tadesse(ed.) (2009) Increasing Crop Production Through Improved Plant Protection - Volume II. Plant Protection Society of Ethiopia (PPSE). EIAR. 2009:542.
- Tadesse E, Tesfu K. Effect of Weed Management Methods on Yield and Physical Quality of Coffee at Gera, Jimma Zones, Southwest Ethiopia. Journal of Resources Development and Management. 2015;11.
- Kifle B, Demelash T, Legesse H. Coffee Thread Blight (Corticium koleroga): a Coming Threat for Ethiopian Coffee Production. J Plant Pathol Microb. 2015;6:303-308.
- Demelash T, Ashenafi A. Assessment of Commercially Grown Coffee Types for Their Tolerance to Bacterial Blight of Coffee at Sidama and Gedeo Zones, Southern Ethiopia. Sky Journal of Agricultural Research. 2017;6:001-005.
- Tamiru S, Sisay K, Belay A, Demelash T. Paper Presented to Crop Research Completed Activity Forum. 2017.
- Cavalcante M, Sales F. Ocorrência da queima-do-fio (P. koleroga) Emcafezaisem Rio Branco. Empresa Brasileira de Pesquisa Agropecuaria-Embrapa Acre, Rio Branco. 2001.
- Derso E, Gebrezgi T, Adugna G. Significance of Minor Diseases of Coffea arabica L. in Ethiopia: A Review. in: Proceedings of the Workshop on Control of Coffee Berry Disease (CBD) in Ethiopia. 2000:58-65.
- Zadoks C, Schein D. Epidemiology and Plant Disease Management. Oxford University Press, Oxford, UK. 1979:427.
- Matovu J, Kangire A, Phiri A, Hakiza J, Kagezi H, Musoli C. Ecological Factors Influencing Intensity of Coffee Leaf Rust and Coffee Berry Disease in Major Arabica Coffee Growing areas of Uganda. Uganda J Agric Sci. 2013;14:87-100.
- Schneider T. Analysis of Incomplete Climate Data: Estimation of Mean Values and Covariance Matrices and Imputation of Missing Values. Climate. 2001;14:853-871.
- Zhu G, Yu Z, Gui Y, Liu Z. A Novel Technique for Isolating Orchid Mycorrhizal Fungi. Fungal Divers. 2008;33(12):123.
- Rowhani A, Uyemoto J, Golino D, Martelli G. Pathogen Testing and Certification of Vitis and Prunus Species. Annu Rev Phytopathol. 2005;43:261-278.
- Than P, Jeewon R, Hyde D, Pongsupasamit S, Mongkolporn O, Taylor J. (2008). Characterization and Pathogenicity of Colletotrichum Species Associated with Anthracnose on Chilli (Capsicum spp.) in Thailand. Plant Pathology. 2008;57:562-572.
- Wheeler B. An Introduction to Plant Disease. John Wiley Sons Ltd., London, 1969;301-244.
- Green B, Salkind J. Using SPSS for Windows and Macintosh, Books Carte. Pearson. 2016.
- SAS (Statistical Analysis System) Software. Version 9.3, SAS Institute, Cary, NC, USA. 2012.
- Staver C, Guharay F, Monterroso D. Designing Pest-Suppressive Multi Strata Perennial Crop Systems: Shade-Grown Coffee in Central America. Agrofor Sys. 2001;53:151-170.
- Ratnadass A, Fernandes P, Avelino J, Habib R. Plant Species Diversity for Sustainable Management of Crop Pests and Diseases. Agro ecosystems: A Review. Agron Sustain Dev. 2011;32:273-303.
- Soto-Pinto L, Romero-Alvarado Y, Caballero-Nieto J, Warnholtz S. Woody Plant Diversity and Structure of Shade Grown Coffee Plantations in Northern Chiapas, Mexico. Rev De Bio Trop. 2001;49: 977-987.
- Mouen-Bedimo A, Njiayouom I, Bieysse D, Nkeng N, Cilas C, Notteghem L. Effect of Shade on Coffea arabica Berry Disease Development: Toward an Agro forestry System to Reduce Disease Impact. Phytopathology. 2008;98:320-325.
- Burt A. Corticium Causing Pellicularia Disease of the Coffee, Hypochnose of Pomaceous Fruits, Rhizoctonia Disease. Annual Molecular Botanical Garden. 1918;5:119-132.
- Burt A. Thelephoraceae of North American Corticium. Annual Molecular Botanical Garden. 1926;13:173-354.
- Rogers D. A new gymnocarpous heterobasidiomycete with gasteromycetous basidia. Mycologia. 1947;39:556-564.
- Venkatarayan S. The validity of the Name Pellicularia koleroga Cooke. Indian Phytopathology. 1949;2:186-189.
- Wakefield G. Differential Characters in Some Resupinate Hymenomycetes. Plant Diseases of International Importance. 1913;4:113-120.
- Hoehnel V. Fragmente zur Mykologie. Mitteilung. 1910;10:468-526.
- Buller R. Spore Deposits the Number of Spores. Researches on Fungi. 1909;1:79-88.
Citation: Dechassa N, Chala A, Belachew K, Shikur E (2021) Study of Coffee Thread Blight Disease (Corticium koleroga (Cke) Hoehnel) in Ethiopia. J Plant Pathol Microbiol 12:572.
Copyright: © 2021 Dechassa N, et al. This is an open-access article distributed under the terms of the Creative Commons Attribution License, which permits unrestricted use, distribution, and reproduction in any medium, provided the original author and source are credited.