

Indexed In
- Genamics JournalSeek
- JournalTOCs
- CiteFactor
- RefSeek
- Hamdard University
- EBSCO A-Z
- OCLC- WorldCat
- Publons
- Google Scholar
Useful Links
Share This Page
Journal Flyer

Open Access Journals
- Agri and Aquaculture
- Biochemistry
- Bioinformatics & Systems Biology
- Business & Management
- Chemistry
- Clinical Sciences
- Engineering
- Food & Nutrition
- General Science
- Genetics & Molecular Biology
- Immunology & Microbiology
- Medical Sciences
- Neuroscience & Psychology
- Nursing & Health Care
- Pharmaceutical Sciences
Research Article - (2019) Volume 8, Issue 1
Multi-Conceptual Mechanical Design Optimization of Capacitive Pressure Sensors via Finite Element Analysis with use of Anisotropic Behavior of Silicon <111> Crystal: Summary of Design Optimization Approaches
Amir Javidinejad*Received: 12-Jan-2019 Published: 14-Feb-2019, DOI: 10.35248/2168-9873.19.8.317
Abstract
In the world of micro-mechanical design of micro-sensors, up to date, there has not been substantial considerations given to the actual mechanical or structural aspect of the designs. Hence, most of the currently available designs are challenged to linearize the “non-linear” sensor’s output by utilization of electronic circuitry. In this research work, a micro-pressure diaphragm which possess linear pressure-deflection behaviour is designed via FEM optimization techniques. The diaphragm is modelled as a Silicon (111) plane, which possess plane isotropic properties. A circular centre boss section is added to the diaphragm and optimization is carried out, to achieve an optimum diaphragm geometry that would allow for flat or rigid deflection of this boss section under the applied surface pressure loading. The approximate closed−form deflection solutions are developed using the anisotropic thin plate theory and the diaphragm deflection behaviour of the FEM optimized design is compared with this thin plate theory model. This diaphragm design is proposed to be used as the top electrode plate of a capacitive pressure sensor, where linear pressure-capacitance change behaviour would become present. This pressure diaphragm has a pressure range of 0 to 206843 Pa (30 psi) with a pressure resolution of 689.5 Pa (0.1 psi).
Keywords
Micro-mechanical; Pressure; Technology
Introduction
Ever since the years 1979−1980, when NASA Langley Space Centre conducted the first experiments with embedded optical sensors for strain measurements in low temperature composites, there have been rapid advancements in the field of “smart” structures. The U.S. National Science Foundation among other government and non-government agencies have been sponsoring research projects for development of cost-effective technologies for remote queried sensors for health and usage monitoring of composite structures. The sensing and inspection technology systems for composites to monitor manufacturing processes, assess and non-destructively evaluate structural integrity, passively monitor the external environment, internally asses onboard and structural emissions and provide situational awareness; are important in defence as well as commercial applications.
The need for development of such monitoring systems has risen from the fact that mounted instrumentation adds undesirable external mass which can adversely affect the static and dynamics responses of the parent composite structures. Furthermore, extensively wired sensory systems, for structural health and usage monitoring of the structures, has some drawbacks which include, increasing structural weight and reduction of structural integrity, possible structural intractability due to damage to embedded interconnects and the unfeasibility of structural reparability. All of which lead to an increased need for utilization of micro smart structures and consequently leading to the need for utilization of micro embeddable sensing systems.
The NSF research at The University of Texas at Arlington is an effort to develop cost effective technology for remotely queried sensory units in a composite structure [1]. It is essential to integrate research effort among the three areas of thin film antennas, electronic circuits and mechanics. This program’s goal has been to develop cost effective technology for remotely queried sensory units in a composite structure with the objective to design and develop micro thin-film antennas which are compatible with composite manufacturing procedures, low power transponder, query protocols, power acquisition and utilization by sensory units, micromechanics of sensing and actuation of closely placed micro-scale sensors and actuators, manufacturing issues and the optimal placement of sensory clusters [2].
This research primarily has addressed structural monitoring at the composite panel level. In detail, The University of Texas at Arlington research has consisted of investigative work in the development of suitable means to uniquely identify sensor elements, investigate the required complexity for the transmitter/receiver circuit, to evaluate transmission coupling of energy from the interrogator to the sensors, and economical placement of sensors for structural monitoring [3]. Also, in specific the research from this dissertation work consisted of, determination of methods for sensor placement during fabrication, and evaluation of materials for the transducers, coupling (antenna) element, IC and interconnections between them [4].
Hence design of micro embeddable sensing systems is the focus of this dissertation. In specific this work has focused on design of pressure diaphragms and the means for embedding and full system integration of pressure sensing units within carbon fibre composite structures. The previous works on MEMS pressure sensors, and particularly capacitance type pressure sensors has resulted in an outburst of pressure sensors whereas the linearity of the sensor is electronically compensated [5].
In the specialized field of MEMS pressure sensing device development, a global search of available technologies and their outcomes, dating back to 1990, has led to some interesting discoveries. One of which indicated that, of the available Micro-Electro- Mechanical-Systems (MEMS) pressure sensors, have taken advantage of the electronic compensation techniques to develop linear pressure sensors. In many instances, claims are made that the developed sensing devices are “highly linear,” whereas the published results of the work indicate otherwise. All of which is an indicative of designs without careful consideration of structural aspects and optimization issues [6].
In general, the MEMS pressure sensor development, both in U.S. and Japan, has focused on utilization of the already existing silicon wafer technologies which possess already near perfect techniques. The sensor developments have branched into two different major types of sensors, the piezoresistive type sensors and the capacitive type sensors. In the case of piezoresistive sensors, pressure measurements are made by recordings of the resistance changes due to the diaphragm deflection under an applied pressure. Where in the case of capacitive sensors, the pressure measurements are made by recordings of the electrical capacitance changes generated by the gap change between the diaphragm and a lower capacitance electrode plate, due to the diaphragm deflection [7].
The principal advantage for a capacitive type pressure sensor is the monotonic increase or decrease of capacitance with applied pressure. Hence, there is a direct correlation between the sensor output and the applied pressure, which if digitized, would also eliminate the sensor signal loss due to any instrumentation parasitic capacitances. The capacitive sensors by nature would have a larger pressure sensitivity and smaller temperature sensitivity. With piezoresistive designs, you had to either know the pressure history or be certain that the pressure did not exceed a critical pressure in order to know the actual pressure [8].
In this presented dissertation, the pressure diaphragm design at micro scale level is done by optimization via finite element methods and verification is done by means of developing closed form math model solutions which accurately model the non-isotropic, raised centre diaphragms. The optimization is a tool to achieve a “perfectly” linear pressure diaphragm which could exhibit linear pressuredeflection response behaviour, father which it must translated into linear pressure-capacitance response behaviour. The work is based on modelling of non-isotropic (111) silicon wafers and the objective has been to achieve a linear capacitance change response with utilization of a raised centre section diaphragm design configuration. This design optimization has led to a high-resolution pressure diaphragm capable of measuring 689.5 Pa (0.1 psi) pressure change with a minimum of 0.01 pF capacitance change resolution. Most of the noteworthy MEMS pressure sensory developments, since 1990 to present time have been tabulated, in Table 1 following, in a chronological order. One can notice that the majority of the pressure sensor development has been on piezoresistive type sensors. Also, interestingly, it is shown that in the recent years the U.S. MEMS community has increased its interest on development of new MEMS pressure sensors in comparison to the earlier years of Japanese industries.
| Sensor Type | Diaphragm Type | Linearity | Author | Year | Publication | Summary |
|---|---|---|---|---|---|---|
| Piezoresistive | Si | Linear | NovaSensor Inc. USA | 1990 | Sensors and Actuators [2] | Linear output by geometric enhancing |
| Piezoresistive Resonant | Si | Amplitude Dependent | Yokogawa Electronics Japan | 1990 | Sensors and Actuators [3] | Resonator |
| Capacitance | Si | Linear | Tohoku University Japan | 1990 | Sensor Sym. Digest [4] | CMOS is used to linearize |
| Piezoresistive | Si | Linear | Fujikura Ltd Japan | 1992 | Sensor Sym. Digest [5] | Electronic Circuitry Compensation |
| Capacitance | Si | Linear | Toyota Toyoda Labs Japan | 1992 | Sensors and Actuators [6] | CMOS is used to linearize |
| Piezoresistive | Si3 N4 | Non-linear | Nippondenso Co. Japan | 1992 | Sensors and Actuators [7] | CMOS technology is used |
| Capacitance | Si3 N4-Si O2 | Non-Linear | University of Michigan USA | 1994 | Sensors and Workshop [8] | Center boss and Digital Compensation |
| Piezoresistive Resonant | Polysilicon | No-data | University of Wisconsin USA | 1995 | Transducer Proceedings [9] | Resonating beams are used |
| Piezoresistive | Si3 N4 and Polysilicon | Non-Linear and Linear | Sandia National USA | 1996 | SPIE Proceedings [10] | Investigative work |
| Piezoresistive | Si | Linear | SenSym Inc. USA | 1998 | SenSym Handbook [11] | Digital Compensation |
| Piezoresistive | SiC | Linear | Daimler Benz Germany | 1999 | Sensors and Actuators [12] | Center Boss with Structural Modification |
Table 1: Globally distinguished MEMS pressure sensor device development from 1990-1999.
Structural Design
A plate or membrane diaphragm, circular or four sided, regardless of the boundary conditions and the applied loading could only exhibit curvature-deflections (symmetric or non-symmetric). However, in the case of pressure diaphragms and in specific capacitance type pressure diaphragms it is highly desired to have:
(1) A linear pressure-deflection behaviour.
(2) A “flat” non-curvature deflection behaviour.
The total pressure-deflection linearity is desired in order to achieve a total pressure-capacitance linearity behaviour and the noncurvature deflection behaviour is desired to control the linearity of the capacitance build up. The later desired behaviour would come to be of great importance in design of membrane type diaphragms since non-linear deflection behaviour could easily be achieved in membrane structures depending on the structural configurations.
To achieve the linear deflection behaviour over the design allowable pressure range one can, design the diaphragm as a plate rather than a membrane. To achieve the “flat” deflection behaviour one could design a circular two sectioned diaphragm as illustrated by Figure 1, where the outer region would have to possess plate behaviour and the centre region would have to possess rigid movement behaviour. In other words, the rigid section movement would be restricted to “flat” noncurvature vertical deflection, while the outer region of the diaphragm possesses a non-restricted movement. This non-restricted movement could also include bending behaviour or in-plane loading behaviour [9].

Figure 1: Pressure diaphragm model with raised rigid centre.
Silicon Mechanical Properties
Silicon wafers were selected as the base material model for this design. At room temperature, Silicon (Si) is a metallic gray crystalline material [10-13] with a low density of 2330 (Kg/m3). It has a cubic crystal structure which is identical to diamond. Silicon wafers cut parallel to the <111> plane possess “transverse isotropic” properties. This <111> wafer plane cut would be used as the structural modelling base to simplify the material aspects of the Silicon. Figure 2 illustrates the Silicon cubic structure with the crystallographic coordinate system shown:

Figure 2: Silicon crystal structure.
The symmetric elastic stiffness matrix C for stress-strain relationship of the silicon cubic crystal structure in crystallographic x, y, z coordinate system is [14]:
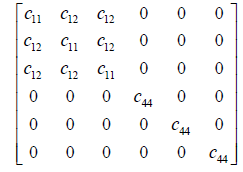 (1)
(1)
The three independent elastic constants for Silicon are shown in Table 2 [15]:
| Constants | |
|---|---|
| c11 | 1.674 × 10¹¹ Pa |
| c12 | 0.6523 × 10¹¹ Pa |
| c44 | 0.7959 × 10¹¹ Pa |
Table 2: Silicon elastic constants.
 (2)
(2)
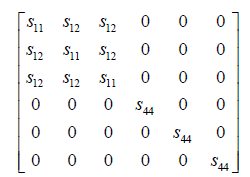
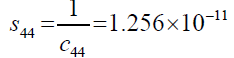
The compliance matrix S, which is inverse of c matrix, for the silicon cubic crystal structure is [14]:
The s11, s12 and s44 are functions of the elastic constants as shown by equation 2 and equation 3 as follows:
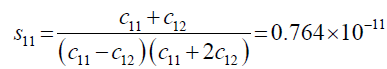
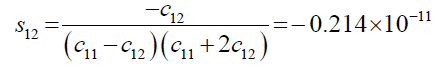 (3)
(3)
Let “1” and “2” represent the coordinate axes in the silicon plane <111> and “3” represent the coordinate axes perpendicular to the plane as shown in Figure 3.

Figure 3: The <111> plane coordinates.
The compliance matrix in the 1,2,3 coordinate system can be obtained by utilizing the 3-D stress and strain transformation [14]. This compliance matrix can be symbolically represented as shown in (4):
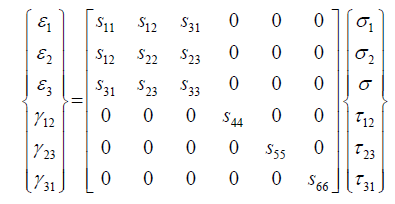 (4)
(4)
where, the elements of the strain-stress compliance matrix in the new crystal coordinate systems are related to the compliance coefficients in x, y, z crystallographic coordinate system as given by equations 5 through 11, as follows:
 (5)
(5)
 (6)
(6)
 (7)
(7)
 (8)
(8)
 (9)
(9)
 (10)
(10)
 (11)
(11)
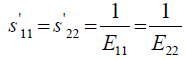
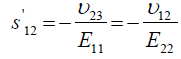
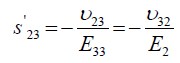
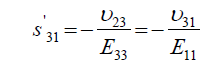
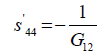
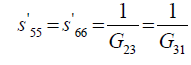
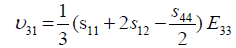
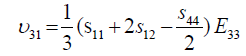
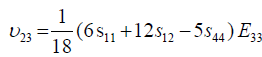
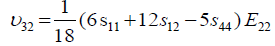
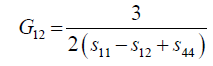
Where, Eij are the in-plane elastic modulus in the <111> Silicon plane, υij are the Poisson’s ratios in the <111> new Silicon plane, and Gij are the shear modulus in the new <111> new Silicon plane. The elements of the new compliance matrix, (sij) can be readily determined by matrix rotational transformation as noted by earlier work by Caddy, [14]. After determination of these elements and substitution into equations 5 to 11 above, the new crystal plane <111>, mechanical properties can be evaluated in term of the original crystal compliance elements (sij) as follows:
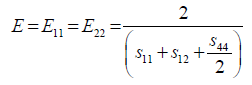 (12)
(12)
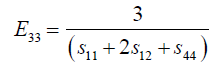 (13)
(13)
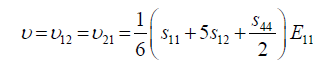 (14)
(14)
 (15)
(15)
 (16)
(16)
 (17)
(17)
 (18)
(18)
 (19)
(19)
 (20)
(20)
The mechanical properties of the <111> plane Silicon are shown in Table 3.
| Mechanical properties | |
|---|---|
| E11=E22 | 1.697 × 10¹¹ (Pa) |
| E33 | 1.883 × 10¹¹ (Pa) |
| v12=v21 | 0.265 |
| v23 | 0.447 |
| v32 | 0.237 |
| v13 | 0.184 |
| v31 | 0.165 |
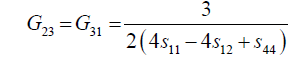
| G12 | 0.671 × 10¹¹ (Pa) |
| G23=G31 | 0.580 × 10¹¹ (Pa) |
Table 3: Silicon <111> cut mechanical properties.
Application of Anisotropic Thin Plate Theory for the Diaphragm Design using Silicon <111> Crystal
In small deflection plate theory in cylindrical coordinate systems, the displacement components in the radial (r) and circumferential () directions can be expressed as follows [15]:
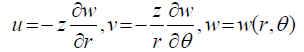 (21)
(21)
whereas, u is the radial displacement, v is the tangential displacement, and w is the vertical displacement.
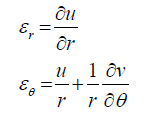
Also, the strain-displacement components are defined as:
 (22)
(22)
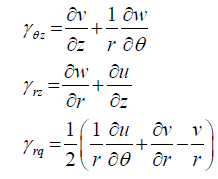
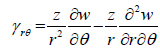
These strain-displacement components can be rewritten in terms of the vertical deflection w.
By substitution of the equations 21 into the first, second and the sixth equations in the 22-equation set, the strain components can be expressed in terms of the mid plane deflection w:
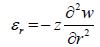
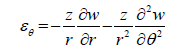 (23)
(23)
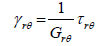
The stress-strain relations from the Hooke’s law are as follows:
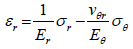
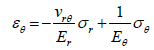 (24)
(24)
The differential equations of the equilibrium are:
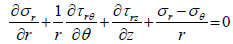
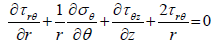 (25)
(25)
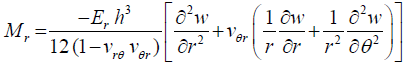
Further, by substituting the equations 23 into the equation 24 and using the equilibrium equations 25, the stress components can be solved for. These stress components in the final form are as follows:
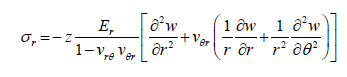
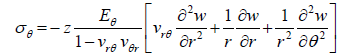
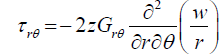 (26)
(26)
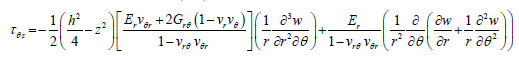
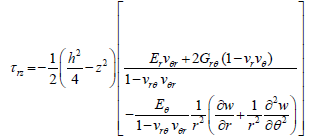
(For thin plate theory the σz, is much smaller than the other stress components and is negligible.)
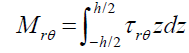
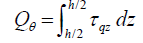
The moment and shear stress resultants can be evaluated by integrating the stress components over the thickness, as follows:
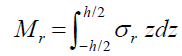
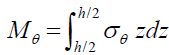 (27)
(27)
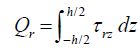
 (28)
(28)
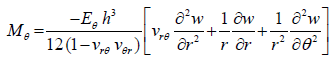
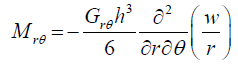
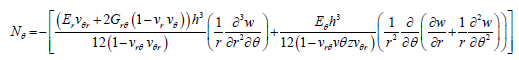
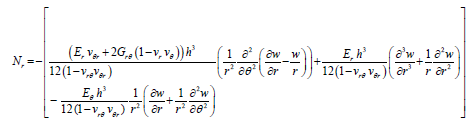 (29)
(29)
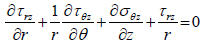
For a plate element, the governing force equilibrium differential equation in the z direction in cylindrical coordinates would be:
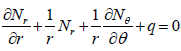 (30)
(30)
Similarly, as previously shown, by substitution of transverse shear loading shown by equations 29 (Nr and Nθ) into the governing force equilibrium differential equation 30 in the z-direction in cylindrical coordinates, the differential equation for the deflection of a anisotropic plate would be shown as:
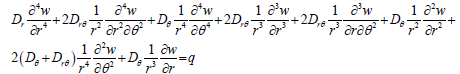 (31)
(31)
Where the rigidity coefficients are defined as follows:
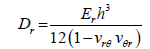
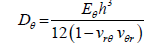 (32)
(32)

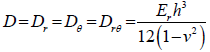
In the case of silicon (111) wafer, where you have plane isotropy and,

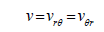 (33)
(33)
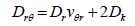
The bending and twisting rigidities shown by equation 32 would all be equal. The coefficient Drθ likewise would become,
 (34)
(34)
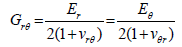
After the substation of the bending rigidity Dr. Farther, by substitution of for shear modulus,
Grθ in equation 34 one would have:
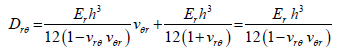 (35)
(35)
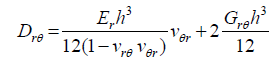
Hence, one would have:
 (36)
(36)
Substitution of the equation (36) above into the differential equation for deflection shown by equation (31) would simplify the derivation of a solution for deflection for the (111) plane Silicon wafer.
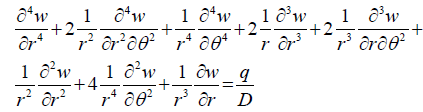 (37)
(37)
After careful observations would be known that the 37 is the Laplacian equation,
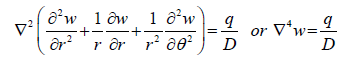 (38)
(38)
Under the assumption that the distributed loading is applied symmetrically over the diaphragm diaphragm would also be symmetric. Thus, one can assume that the deflection w, is independent of θ. Hence, equation 38 would reduce to:
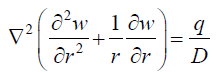 (39)
(39)
likewise,
 (40)
(40)
 (41)
(41)
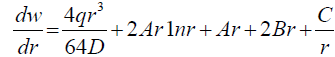
After performing integration, the equation 39 the equation for the plate slope would become:
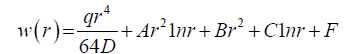 (42)
(42)
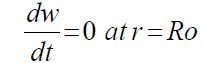
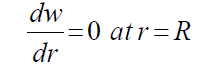
Now, for a circular diaphragm of radius “Ro” with a raised middle section with radius “R” and clamped at the perimeter edges (r=a), the following boundary conditions apply:
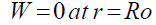 (43)
(43)
 (44)
(44)
 (45)
(45)
And, under the assumption that the centre boss would deflect rigidly,
 (46)
(46)
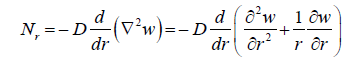
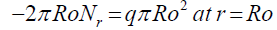
The shear load, Nr, by substitution of equation 42 into 40 can be shown as following,
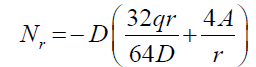 (47)
(47)
Then boundary condition 44 can be applied to equation 47 above to give,
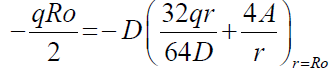 (48)
(48)
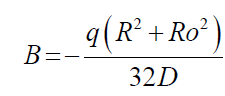
Solving for “B”,
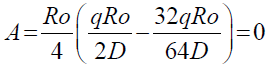 (49)
(49)
Substitute “A” into the first derivative of the deflection equation 42 and apply the boundary condition 44 and 46, where
 (50)
(50)
Then, “C” was determined to be,
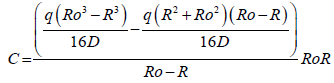 (51)
(51)
And, likewise “B” would be,
 (52)
(52)
Applying the boundary condition 43 to the deflection equation 42, “F” constant would be found,
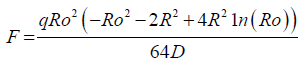 (53)
(53)
The final form of the diaphragm deflection equation is as follows:
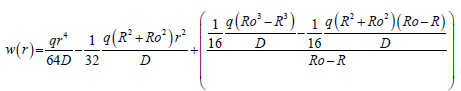 (54)
(54)
Design Optimization
Finite element modelling for optimization
In design of pressure diaphragms with raised sections for capacitance type pressure sensors, when Silicon wafers are utilized, first the issue of non-isotropic material properties of Silicon wafer must be accounted for. Then the need for a flat raised-section deflection due to applied pressure as well as the linearity over the entire pressure range must be addressed in order to develop a truly linear capacitive pressure sensing diaphragm. The mentioned design issues cannot be readily answered by the theoretical plate theory formulations. The plate theory solutions are derived under the assumption that the diaphragm raised section deflection would be linear under applied pressure. Furthermore, the raised section thickness effects, and the stress stiffening effects would not be shown by the theoretical plate theory formulations.
Therefore, a need for finite element analysis optimization is established here. However, due to the extreme computational time consumption of FEA optimization methods, the axisymmetric model of the circular diaphragm would be adequate. Figure 4 illustrates the physical schematics and FEM mesh of the diaphragm axisymmetric model. The mesh was built up with ANSYS Plane 82 8-Node 2-D solid axisymmetric element type. The mesh density was increased at the regions of significant stress concentrations to accurately evaluate bending of the diaphragm under applied loading. These regions are near the outer edge boundary and the raised section area where as the diaphragm thickness changes. The stress stiffening and large-deflection are activated for this design FEM analysis.

Figure 4: The meshed axisymmetric finite element model of diaphragm.
The distributed applied pressure loading and the boundary conditions for the FEM optimization are shown in Figure 5.

Figure 5: The loading and B.C. application on the FEM model.
Formulation for optimization via finite element analysis
In this design a linear pressure-deflection relationship is desired. Therefore, it is needed to have the pressure diaphragm (raised boss section) to deflect linearly by application of the pressure on diaphragm surface. In addition, to avoid additional embedded non-linearity, it is also desired to have the raised boss section of the diaphragm itself to deflect in a non-curvature flat form too. From the above-mentioned design constraints, one can guaranty the true linearity of the pressure diaphragm over the entire pressure span.
To formulate the optimization schemes for performing a parametric design via finite element analysis, the design variables and the state variables as well as the objective function must be established. The design variables, which are the independent physical quantities of the design that would be varied to achieve an optimum design, have to be constrained within a defined range. The state variables, which are the dependent design constraint quantities, also need to be defined with a minimum and maximum limit. The state variables in turn define the feasibility of the design based on the specified constraint limits. The objective function would have to be optimized or in other words always minimized by modifying the design variables during the optimization scheme. The convergence of the objective function is indicative of a final best design set.
In this optimization scheme, the geometrical dimensionalities of the diaphragm, the thickness (T), the radius (Ro), the raised section height (H) and the raised section radius (R), would be the design variables. The capacitance changes resolution and the deflection resolution would be set as the state variables, which will be discussed in their respective sections following. The design objective function would be set for minimization of the vertical displacement difference between the centre and the edge nodes of the diaphragm raised section.
Design variable
For the parametric studies of this design the design variables are tabulated in Table 4. Where, as previously mentioned H, is the raised boss section height, T, is the diaphragm thickness, R, is the raised boss section radius and Ro, is the diaphragm radius.
| Variable | Min | Max Range (m) |
|---|---|---|
| H | 155 × 10-6 | 205 × 10-6 |
| T | 40 × 10-6 | 100 × 10-6 |
| R | 200 × 10-6 | 2300 × 10-6 |
| Ro | 800 × 10-6 | 2500 × 10-6 |
Table 4: FEM optimization design variables.
State variables
The state variables for this optimization are based on the following desired operational constraints:
1. The detectable capacitance change resolution has to be greater than or equal to 0.01 × 10⁻¹² Farad.
2. The desired detectable pressure resolution must be 689.5 Pa (0.1 psi).
3. At the desired 689.5 Pa resolution the deflection has to be greater than or equal to 0.01 × 10⁻⁶ m (100 Å).
Plate capacitance constitutive formulation
For design of capacitance pressure diaphragms where electrical capacitance is needed to be derived from diaphragm deflection, the fundamental theory of fixed electrical capacitor can be utilized. For a fixed capacitor where a capacitance is to be built between to plates, insulated usually by air or some other insulating material, can be defined by equation 55 as follows [16,17]:
 (55)
(55)
where, ε , is the dielectric material permittivity of insulation, A, is the capacitor area and d, is the separation distance between the capacitor plates. Furthermore,
 (56)
(56)
Where, k is the dielectric constant of the insulation material and o ε , is the permittivity of the vacuum (8.85 × 10⁻¹² F/m).
Readily equation 55 can be used to derive the governing capacitance equation for a variable “pressure deflective” capacitor. For a capacitor with one fixed plate and one flat-deflective plate if the deflection is defined by a displacement uc as illustrated in Figure 6, then the capacitance can be expressed as follows:

Figure 6: A fixed-variable plate capacitor configuration.
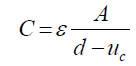 (57)
(57)
Where uc, the diaphragm deflection is to be used as absolute term if positive capacitance is desired.
To satisfy the constraints number 1 and 2 simultaneously and to formulate for a capacitance optimization state-variable, equation 57 would be utilized. From this equation we know that, d, is the initial noload- state separation gap distance for the capacitor. Therefore, an initial separation distance must be determined. This distance must be greater than the maximum diaphragm deflection due to the maximum design allowable applied pressure. For this design the initial separation gap would be set to deflection at the maximum applied pressure (206842.7 Pa) plus an additional tolerance of 10 times the deflection due to 689.5 Pa minimum resolution pressure. The formulation is as follows:
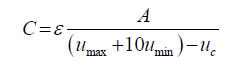 (58)
(58)
Where, umax, is the maximum diaphragm deflection due to the maximum design allowable applied pressure, umin, is the deflection due to minimum resolution pressure, ε ,A and uc are defined same as previously shown in equation 58.
However, in a linear case when the maximum applied pressure (206842.7 Pa) is 300 times more than the pressure resolution (689.5 Pa) then the corresponding maximum deflection (umax) would also be 300 times more than the minimum pressure resolution deflection (umin). Thus capacitance equation 55 can be rewritten as function of deflection as follows:
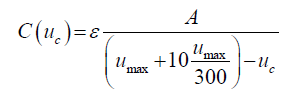 (59)
(59)
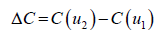
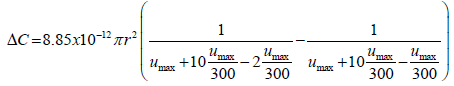
To quantify the desired capacitance change and derive a capacitance state variable for a circular capacitor plate (A=πr2 2 ), equation 56 can be used. Let the deflection at desired resolution pressure of 689.5 Pa be represented by u1 and the deflection at twice the resolution pressure be represented by u2. Then by substitution of u1 and u2 in equation 59, and equation for capacitance change ΔC can be derived as follows:
 (60)
(60)
Also, note
 (61)
(61)
 (62)
(62)
Thus ΔC can be expressed as:
 (63)
(63)
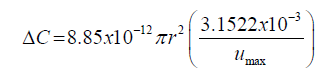 (64)
(64)
Where, ΔC must be greater than or equal 0.01 × 10⁻¹² Farad for FEM optimization.
To satisfy the constraint number 3 a check for  against the
0.01 x 10⁻⁶ m minimum deflection is required. The state variables are
tabulated in Table 5.
against the
0.01 x 10⁻⁶ m minimum deflection is required. The state variables are
tabulated in Table 5.
| Variable | Min. | Max. Range |
|---|---|---|
| C | 0.01 × 10⁻¹² F | None |
| u1 | 0.01 × 10⁻⁶ m | None |
Table 5: FEM optimization state variables.
Objective function
The objective function that would be minimized is to check for a non-curvature flat deflection of the centre boss raised section. The most computationally feasible approach would be to check for the deflection of the node at the centre of the raised section and the node at the far end of the section in the axis-symmetric finite element model. The convergence goal would be to minimize the deflection difference between the two nodes while slowly approaching the null value.
The optimization formulation scheme described earlier was used to achieve the best feasible design. The optimization iterations were started with the first order method type iterations. The first order method in ANSYS converts the problem to an unconstrained problem with penalty functions for the objective function to account for imposed constraints. This method uses gradient (or instantaneous rate of change) of design variables to determine search direction for the subsequent Design Variable values.
As indicated before the objective function in this design optimization was the difference of the raised section end and centre nodes or in other words defined as the “flatness” error. This minimization of the objective function (FLTNERR) against the design set number, is tracked by ANSYS and illustrated in Figure 7.

Figure 7: The objective function minimization track from ANSYS FEA.
In Figure 7 consistent reduction of flatness error is present. After the 18th iteration the minimization is stabilized until at about 32nd iteration, the best feasible design was reached. However, the iterations could continue up to 34th iteration, where no more higher order convergence was achievable.
In Figure 8 the computed values of the raised section “centre” and “end” node deflection are tracked against the design. The state variables govern the design optimization feasibility. The capacitance changes ΔC resolution represented here by the “COBJ” variable, is tracked against the design sets and shown in Figure 9. As previously mentioned, this constraint is set to achieve the desired capacitance and pressure resolutions. In this figure, the picks correspond to the worst-case values of the “flatness” error, and the tracks closely matching the lower limit (0.01 × 10⁻¹² Farad) possess the best-case values of the “flatness” error. However, since the magnitude of the “flatness” error track and the capacitance change ΔC track (COBJ) are at totally incompatible magnitudes, therefore simultaneous plot of them would not be any helpful information.

Figure 8: The boss “Centre” node and “End” node deflections tacking from ANSYS FEA.

Figure 9: The capacitance change track ΔC (COBJ) from ANSYS FEA.
As indicated previously by equations 63 through 64 the capacitance changes ΔC resolution is inversely proportional to the diaphragm deflection. Which in turn means that capacitance change ΔC and the state variable u1 which represents the pressure resolution deflection are linearly dependent. The state variable or u1 as indicated in the optimization scheme “UA” is tracked by ANSYS and illustrated by Figure 10.
Figure 10: Pressure resolution deflection tracking against design set numbers from ANSYS FEM.
Finally, the simultaneous tracking of the design variables against the design set numbers are shown in Figure 11. From this tracking and a comparison with the objective function tracking shown in Figure 11, it is clearly understood that the minimization of the flatness error would be converging once the raised section boss thickness(H) is increased at least by four times or more than the actual diaphragm thickness(T). For a closer tracking of the diaphragm boss height and the diaphragm thickness refer to Figure 12.

Figure 11: Design variables tracking against design set from ANSYS FEA.
Figure 12: Design variables tracking of diaphragm thickness and boss height against design set.
The FEM optimization revealed the best feasible design set at the 32nd first order type iteration for 8-node plane solid model. Table 4 tabulates the optimized design variables, state variables, and the objective function.
Based on this optimization, the following conceptual pressure sensor design is proposed. The schematics of this integrated sensor unit are shown in Figures 13 and 14.

Figure 13: The schematics of this integrated sensor unit.

Figure 14: The schematics of this integrated sensor unit with optimized design dimensions.
Results and the Optimum Diaphragm Design from the FEM Analysis
Pressure-deflection-capacitance behaviour
After development of an FEM optimization scheme, a pressure diaphragm design with a centre boss thickness of about four times than the diaphragm thickness was proven to be the best feasible design. Specifically, the optimum parameters were a diaphragm thickness (T) of 40.509 μm, a centre boss section thickness (H) of 155.47 μm, a diaphragm radius of 1293.9 μm and a boss section radius of 587.52 μm. The deflection at the desired pressure resolution of 689.5 Pa (0.1 psi) would be about 103 Angstroms. The corresponding detectable capacitance resolution would be at about 0.01 pF. Also, as previously mentioned this circular diaphragm model possess <111> Silicon plane mechanical properties. This diaphragm is modelled as a clamped-edge circular plate.
Figure 15 clearly illustrates the linear pressure-deflection behaviour of the diaphragm as well as the “flat” non-curvature deflection of the centre boss with application of the pressure over the entire design pressure range (0 to 206843 Pa). Even though that all the nodes were checked and verified at the boss surface, it is only logical to compare the “centre” and the “end” nodes of the centre boss section. Also, the corresponding capacitance-pressure behaviour of this optimum design is shown in Figure 16. It is only needed to be pointed out that, due to the initial capacitance separation gap, the capacitance reading at the null pressure loading condition does not read null capacitance.

Figure 15: FEM resulted diaphragm pressure-deflection behaviour.

Figure 16: The diaphragm pressure-capacitance behaviour.
The pressure-deflection behaviour of the diaphragm, from the FEM 2-D axisymmetric model was compared, to the theoretical deflection model developed earlier, shown by equation 42. Since, an exact closed form solution for this type of raised geometry is not readily obtainable, careful attention must be given to the boundary conditions at the raised section boundary. To exactly match the boundary condition 46 used for determination of approximate thin plate model of this diaphragm; in the FEM model, the radial displacements at all the points away from the diaphragm centre at location “R” must be constrained. Figure 17 illustrates this pressure-deflection behaviour comparison. From this figure, it is readily observed that the thin plate theory exactly matches the radially constrained FEM model for this diaphragm.

Figure 17: Thin plate theory and FEM model pressure-deflection behaviour comparison.
Maximum loading-deflection behaviour in radial direction
The pressure-deflection behaviour of the diaphragm along the radial direction under the maximum applied pressure of 208643 Pa, is illustrated by Figure 18. Again, a comparison between the 2-D FEM model and the thin plate theory are shown in this figure, as well. The actual diaphragm deflection behaviour at the maximum applied pressure of 208643 Pa, for the unconstrained and the radially constraints models, from the FEM analysis are shown in Figures 19 and 20 respectively of axial oscillation-supported drilling systems subjected to excitation forces. A variety of analytical axial vibration models have been developed to investigate the axial vibrations of drill strings. This study focuses on pure axial oscillations and reviews uncoupled axial vibration models. A recent study [7] on drill string vibration models summarized the historical contributions of earlier modeling studies on axial vibrations in drilling systems. The AOSD systems have been modelled as a continuous elastic rod or discrete mass-spring vibration damper. Generally, the equations of motion for continuous systems are partial differential equations (PDE), and discrete systems are modelled using ordinary differential equations (ODE). Bailey and Finnie (1960) and Li (1987) modelled axial vibrations in drill strings using the undamped wave equation as the equation of motion. The natural frequencies (or Eigenvalues) and mode shapes are obtained by the method of separation of variables [8,9]. Fixed, free, or spring ended boundary conditions are considered at the bottom as recommended by Bailey and Finnie.

Figure 18: Pressure-deflection attitude comparison of the diaphragm along the radial direction.

Figure 19: The diaphragm deflection at max pressure (206843 Pa) 2-D axisymmetric FEA model.

Figure 20: The diaphragm deflection at max pressure (206843 Pa) 2-D axisymmetric FEA model Ux constrained at all x=R (Rigid Centre Boundary).
Discussion
Some studies [10] modelled the drill string as a continuous system of stepped shafts. Khan (1983) derived a linear equation of motion with damping and force terms. The damping term in the linear equation of motion represents drillstring-wellbore frictional contact, fluid viscous effects, material damping, and radiation losses into the formation [11]. The natural frequencies and mode shapes were evaluated for three different boundary conditions (fixed at the top and bottom, fixed at the top and free at the bottom; mass-spring at top and spring at the bottom). The third boundary condition is considered the most realistic one because it accounts for the mass and stiffness of the draw works and derrick at the top [12,13]. The boundary condition with the spring at the bottom (i.e. bit) provides a means of varying the bottom end condition from fixed to free or to any intermediate value by varying the spring constant [14].
Li developed a model considering the wellbore-bit contact as a source of excitation in axial vibrations of drill string with no distance or velocity of slip between the bit tooth and the hole bottom. The source of excitation is modelled as a periodic and harmonic force which is expanded using Fourier series. Other studies modelled the source of excitation as frictional contact between the bit and borehole where a unit harmonic relative displacement is introduced at the bit. The influence of the mud on the dynamics of the drill string is modelled as an added mass and viscous damping distributed along the string. The transfer matrix method is used to solve the linear damped equation of motion with a force term.
Recent studies [15] used a multi-degree of freedom discrete system (mass-spring) to model the bottom hole assembly (BHA) components, the axial oscillation tool, and the entire drill string. The equation of motion derived from the spring-mass discrete model is an ordinary differential equation with a linear viscous term. The viscous damping coefficient assumed by Forster is varied at different locations along the drill string model to match field data. The results obtained from the discrete model of Clausen show an increase in the acceleration response of the axial oscillation tool as the operating frequency increases, and high BHA acceleration at lower frequencies, which starts to reduce at higher frequencies. However, the reduction in BHA axial displacement and acceleration predicted at higher frequencies are not consistent with practical scenarios because there is a corresponding increase in excitation pressure when vibration frequency increases [16].
Shor used beam elements to model drill string components and mass-spring to model surface equipment. Linear viscous damping is assumed in the vertical section while nonlinear Coulomb damping (frictional contact) is considered in the curved and lateral sections. The equivalent viscous damping coefficient is utilized to represent both viscous and Coulomb damping and linearize the equation of motion. Results show that the magnitude of axial oscillations decreases when the AOT enters the lateral section due to increased normal force and higher Coulomb friction.
According to Tian, the axial vibrations generated by an AOT are transmitted in both axial directions (i.e. upward and downward) of the tool. The upward vibrations are propagated to the downward direction by the disc-spring installed in the upper section of the tool. Coulomb friction is considered in the axial vibration model of Tian. The excitation force generated by the axial oscillation tool is modelled as an axial force created by the change in flow area within the tool. The entire drill string is considered as a discrete multiple-degree-offreedom system and solved using a system of matrices. The results from the model are consistent with the experimental data.
Conclusion
A circular centre boss section is added to the diaphragm of capacitive pressure sensor and optimization is carried out, to achieve an optimum diaphragm geometry that would allow for flat or rigid deflection of this boss section under the applied surface pressure loading. The approximate closed−form deflection solutions are developed using the anisotropic thin plate theory and the diaphragm deflection behaviour of the FEM optimized design is compared with this thin plate theory model. Pressure-deflection attitude comparison of the diaphragm along the radial direction exhibits good correlation between the FEM optimized solution and the classical closed form solutions.
Acknowledgement
The funding for this research was in part provided by US National Science Foundation Civil and Mechanical Systems Division, for Remotely Queried Structural Health and Usage Monitoring System (RQ-HUMS) under Award Number 9714128 with Principal Investigators Shiv Joshi (Principal Investigator), Menahem Lowy (Co- Principal Investigator) Jonathan Bredow (Co-Principal Investigator).
REFERENCES
- Javidinejad A. Mechanical design of embeddable micro smart sensingsystems. University of Texas at Arlington, USA. 1999.
- Mallon JR, Pourahmadi F, Petersen K, Barth P, Vermeulen T. Lowpressure sensors employing bossed diaphragm and precision etch-stopping. Sens Actuator A-Phys. 1990;21:89-98.
- Ikeda K, Kuwayama H, Kobayashi T, Watanabe T, Nishikawa T. Silicon pressure sensor integrates resonant strain gage on diaphragm. Sens Actuator A-Phys. 1990;21:146-150.
- Matsumoto Y, Shoji S, Esashi M. A miniature integrated capacitivepressure sensor. Technical Digest of the 9th Sensor Symposium. 1990;2: 1.
- ItohT, Adaci T, Hashimoto H. One-chip integrated pressure sensor. Technical Digest of the 11th Sensor Symposium. 1992.
- Nagata T, Terabe H, Kuwahara S, Sakurai S, Tabata O. Digital compensated capacitive pressure sensor using CMOS technology for low pressure measurements. Sens Actuator A-Phys. 1992;34:173-177.
- Fujii T, Gotoh Y, Kuroyanagi S. Fabrication of microdiaphragm pressure sensor utilizing micromachining. Sens Actuator A-Phys. 1992;34:217-224.
- Zhang Y, Wise KD. An ultra-sensitive capacitive pressure sensor with a bossed dielectric diaphragm. Solid state sensor and actuator workshop. 1994;2: 1.
- Guckel H. Optical drive/sense for high Q resonant microbeams. Transducers Sym Yokohoma, Japan. 1993.
- Eaton WP, Smith JH. Planar surface-micromachined pressure sensor with a sub-surface, embedded reference pressure cavity. Proceedings of the SPIE Conference. 1996;2882:1-8.
- Milpitas CA. Solid state pressure sensors handbook. 1998.
- Eickhoff M. A high temperature pressure sensor prepared by selective deposition of cubic silicon carbide on SOI substrates. Sens Actuator A-Phys. 1999;74:56-59.
- Bever MB. Encyclopedia of materials science and engineering. 1998;6:4429.
- Cady WG. Piezoelectricity. Dover Publications, New York, USA. 1964.
- Runyan WR. Silicon semiconductor technology, McGrawHill. 1965.
- Lekhnitskii SG. Anisotropic plates. Gordon and Breach, New York, London, Paris, Montreaux, Tokyo, Melbourne. 1968.
- Floyd TL. Electronics fundamentals: Circuits and devices. Merrill Publishing. 1987.
Citation: Javidinejad A (2019) Multi-Conceptual Mechanical Design Optimization of Capacitive Pressure Sensors via Finite Element Analysis with use of Anisotropic Behavior of Silicon <111> Crystal: Summary of Design Optimization Approaches. J Appl Mech Eng, 8:317. doi: 10.35248/2168-9873.19.8.317
Copyright: © 2019 Javidinejad A. This is an open access article distributed under the term of the Creative Commons Attribution License, which permits unrestricted use, distribution, and reproduction in any medium, provided the original author and source are credited.