PMC/PubMed Indexed Articles
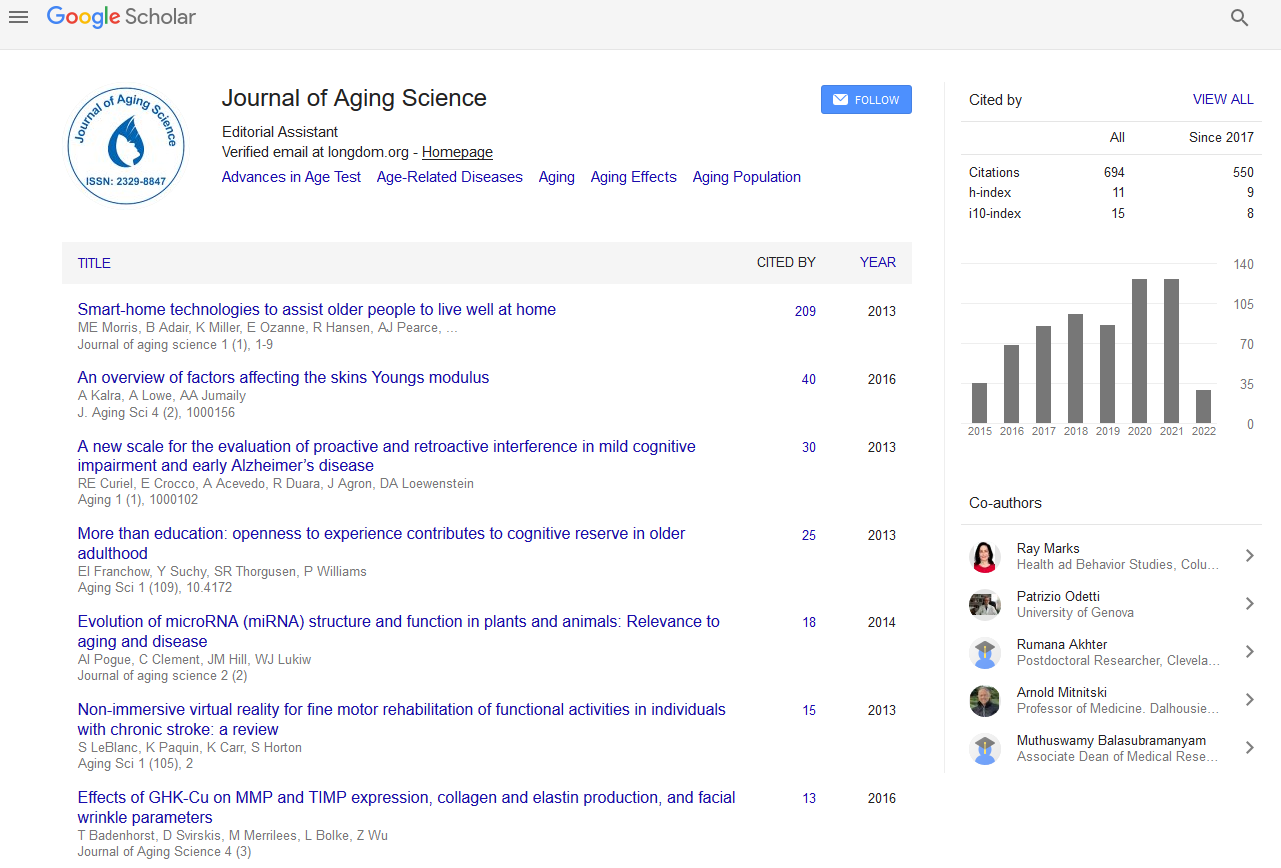

Indexed In
- Open J Gate
- Academic Keys
- JournalTOCs
- ResearchBible
- RefSeek
- Hamdard University
- EBSCO A-Z
- OCLC- WorldCat
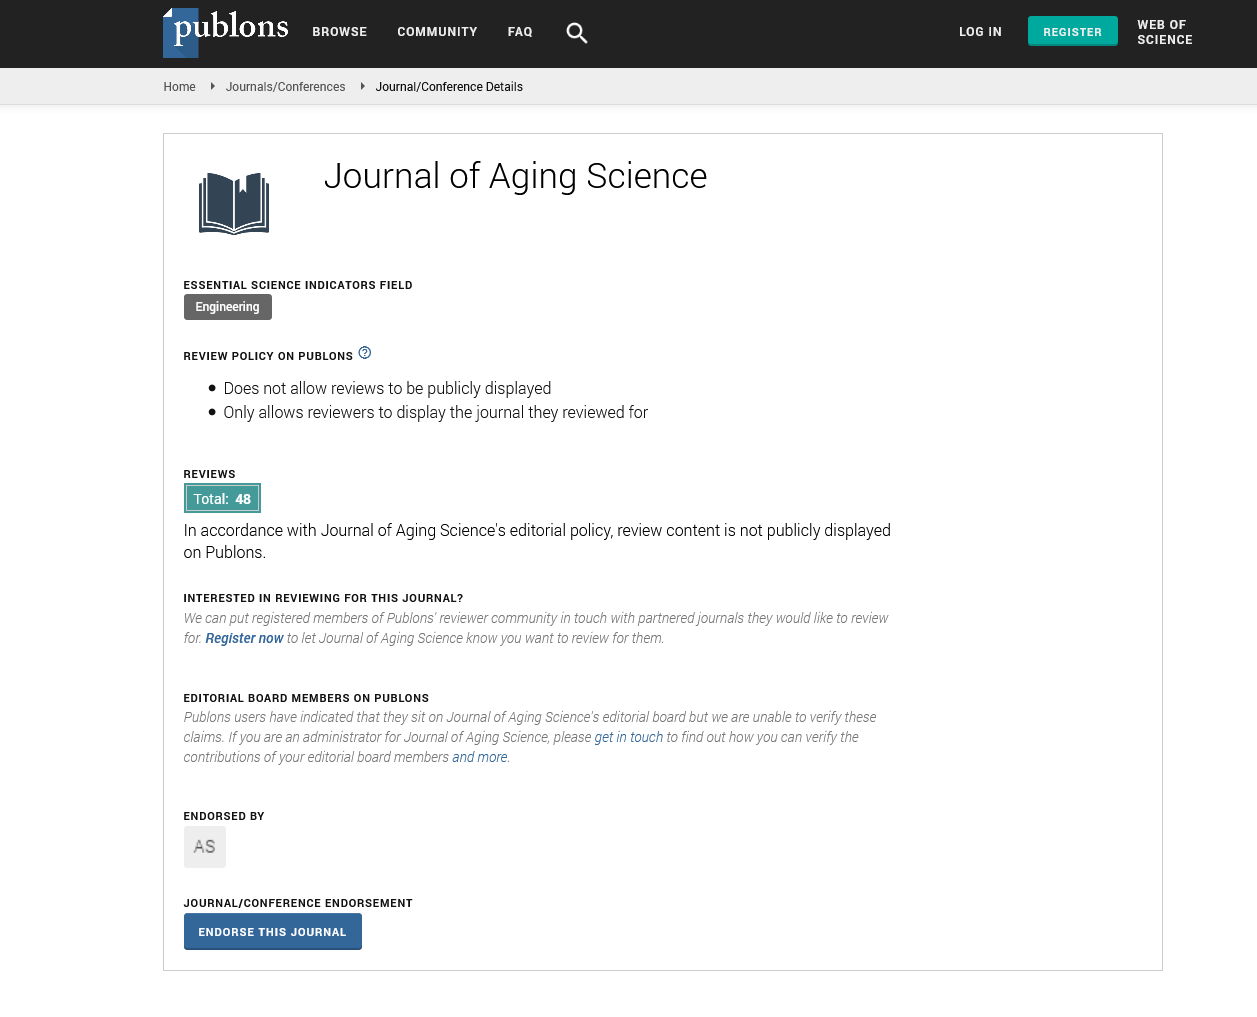
- Publons
- Geneva Foundation for Medical Education and Research
- Euro Pub
- Google Scholar
Useful Links
Share This Page
Journal Flyer
Open Access Journals
- Agri and Aquaculture
- Biochemistry
- Bioinformatics & Systems Biology
- Business & Management
- Chemistry
- Clinical Sciences
- Engineering
- Food & Nutrition
- General Science
- Genetics & Molecular Biology
- Immunology & Microbiology
- Medical Sciences
- Neuroscience & Psychology
- Nursing & Health Care
- Pharmaceutical Sciences
Research Article - (2019) Volume 7, Issue 2
Information Delivery Methods and their Association with Older Adults Memory and Comprehension
Yukio Imamura1,2*, Yuki Murakami1,2, Yoshihide Kimura2,3, Osamu Maeda2,4, Masanori Tsujii2,3, Kei Konishi2,4, Tomoko Nakano2,4, Yoriko Nagai2,4 and Satoko Mitani2,5*2Graduate School of Medicine, Kyoto University, Kyoto, Japan
3Department of Urban Development, Osaka Prefecture Government, Japan
4Department of Human Health Science, Graduate School of Medicine, Kyoto University, Kyoto, Japan
5Department of Nursing, School of Health Sciences, Gifu University of Medical Science, Gifu, Japan
Received: 16-Jul-2019 Published: 29-Jul-2019, DOI: 10.35248/2329-8847.19.07.207
Abstract
The global population is aging. As people age, they typically experience gradual changes in hearing, vision, coordination, balance, working memory, and cognitive function. Products, communication materials, and information provision are often accommodated for older adults. In this study, we examined various information delivery methods and their association with older adults’ working memory and cognitive function (N=18; 10 women). Participants completed tests or followed instructions that consisted of either only figures, only words, or a combination of both figures and words. First, concerning working memory, six well-known information symbols were shown to participants in one of three patterns. Each pattern was displayed on a screen for 20 sec, and working memory was measured as the number of correct items participants recalled. Cognitive function was assessed by participants’ ability to construct three different objects (giraffe, flower, and tulip) using blocks. Participants were presented with various forms of instruction concerning how to build the objects-pictures only, words only, or both pictures and words. Results revealed that the total number of items recalled were 4.3 ± 1.4, 3.1 ± 1.1, and 3.9 ± 0.8 for figures only, words only, and both figures and words, respectively (χ2=10.13, p=0.006). Higher working memory scores were associated with “figure only” and “figures and words” as compared with the “words only” method. Regarding comprehension, higher scores were associated with “figures and words” instructions as compared to the “figures only” and “words only” instructions. In conclusion, information provision for older adults should be simple and easy, visuals should be employed, and supplemental information should be explained in words to avoid any misunderstandings.
Keywords
Working Memory; Mini-Mental State Examination-Japanese version; Aging
Introduction
Brain functional changes during aging affect multiple aspects of life, such as the ability to perform physical tasks, exercise, and perform cognitive functions [1,2]. Distinct changes in cognitive function that are commonly affected by aging include attention, memory, comprehension, processing visuospatial cues, decisionmaking, and problem solving [3]. Age-related decline in language processing sometimes occurs because of age-related decline in working memory, and age-related speech impairment might be associated with frontal lobe function [3]. Declines in memory and comprehension are natural consequences of aging; however, these declines can vary in severity and sometimes present in the form of mild cognitive impairment (MCI) [4,5]. Cognitive function, as measured by the Mini-Mental State Examination MMSE-J, often decreases with age. Previous reports suggested that the MMSE-J scores are strongly related to age [6].
Comprehensive physical training can improve MMSE scores of patients with Alzheimer’s disease (AD), and it can improve the auditory and verbal skills and short-term and subjective memory in patients with an MCI [7]. Memory is classified as short-term memory (STM) and long-term memory (LTM) [8]. STM is transiently obtained by the sensory neurons and used for the recognition of continual phenomena such as movies and conversation. STM is maintained for 20 s and enables one to remember, for example, 5-9-digit numbers (e.g., a phone number). Conversely, LTM is retained in the brain and lasts for years. STM is a facet of working memory, which underpins conversation, reading, writing, and calculation-all of which are vital in individuals’ daily lives.
Working memory is a cognitive process and involves temporarily holding information in the brain for further informational processing [9]. Accumulated evidence in anatomical and cognitive neuroscience has resulted in hypothetical models that address how working memory works. In 1974, Baddeley and Hitch posited a multi-component model of working memory [10]; specifically, two slave systems (i.e., phonological loop and visuo-spatial function) temporally hold and operate the information that is controlled by the central executive in the brain. The phonological loop includes inner self-talk (e.g., repeating something in your mind) to maintain information in one’s STM. The visuo-spatial function serves as a visual system (e.g., shape, color, and texture) and spatial system (e.g., position) for the brain. The central executive system refers to paying attention to a subject and controlling these two slave systems for short-term working memory.
As another model for working memory, in 2005, Ericsson and Kintsch hypothesized that working memory is a part of LTM [11]. For example, when a person pays attention to a subject (e.g., a four-digit number), he or she memorizes the subject as a “chunk”-the four-digit number is one chunk and retained with other chunks in multiple layers of the brain cortex. In this system, working memory serves as retrieval cue for LTM. Hence, these systems for working memory are critical for information processing; however, they degrade during aging [12]. Especially, working memory related to visual and spatial function tends to decline [13]. Many studies have investigated approaches for improving memory and comprehension [14,15]. Some games, as well compassionate support and care from family members, can activate higher brain function and inhibit age-related cognitive decline [16,17]. However, not all older adults necessarily benefit from these approaches. In addition, many older adults live alone and are not financially secure. Although some training methods have been shown to be effective, cognitive plasticity is limited [18]. On the other hand, some preclinical trials have been applied to help older adults’ recover brain function; although, this has been difficult.
In this study, we hypothesized that the efficient presentation of subjects (e.g., numbers, messages, and materials to provoke phonological loop and visual-spatial function), will underpin older adults ’ declining comprehension and memory. Consequently, we examined what information delivery methods make it easier for older adults to understand and remember. Our findings will be helpful for efficient informational processing in memory degradation and support the comprehension of older adults.
Materials and Methods
Participants and recruitment
Eighteen individuals (10 women) engaging in agriculture were recruited from the Agricultural Cooperatives in Sakahara town, Nara, Japan. Participants were divided into three groups (A, B, and C) randomly. All participants had no difficulties with writing, hearing, vision, or activities of daily living. The Ethical Committee of Kyoto University(no. E1983) approved this study. Administration procedures were conducted according to the national, ethical, and legal requirements for this type of study. Potential participants were recruited through presentations. Participants were informed of their rights, that they could withdraw from the study at any time, and that their responses would be kept anonymous. All participants provided informed consent.
Administration procedures
The Japanese version of the MMSE (MMSE-J) is a well-validated test of cognitive function, and it is widely used in clinical practice (maximum score=30). All participants completed the MMSE-J. Each group of participants received three tests consecutively (Figure 1).

Figure 1. Study procedure: Participants were divided into three groups (Group A, B, or C; 6 participants each). Working memory and comprehension tests were conducted using three methods: 1) words only, 2) figures only, or 3) both figures and words.
A) Working memory test: We prepared a working memory test using information symbols provided from the Foundation for Promoting Personal Mobility and Ecological Transportation. Six items were presented in one test: shown as figures, figures and words, or words only. Each item was familiar to Japanese people (Figure 2 and Table 1).

Figure 2. Figures and words used in the working memory test. Left row: Figures used in this test; Middle row: Words used in this test (English translations in parentheses); Right row: Figures and words used in this test.
| n | Mean ± SD | Statistic | p | ||
|---|---|---|---|---|---|
| Age | Total | 18 | 68.8 ± 7.1 | 0.45 | |
| Male | 8 | 67.4 ± 6.8 | t=0.77 | ||
| Female | 10 | 70.0 ± 7.5 | F=1.22 | ||
| Group A | 6 | 68.2 ± 7.9 | 0.17 | ||
| Group B | 6 | 65.3 ± 5.0 | F=3.51 | ||
| Group C | 6 | 73.0 ± 7.1 | |||
| MMSE-J score | Total | 18 | 27.1 ± 2.5 | 0.88 | |
| Male | 8 | 27.1 ± 3.5 | t=0.15 | ||
| Female | 10 | 27.2 ± 1.5 | F=5.64 | ||
| Group A | 6 | 26.0 ± 3.5 | 0.24 | ||
| Group B | 6 | 28.5 ± 2.1 | F=2.82 | ||
| Group C | 6 | 26.8 ± 0.8 | |||
Table 1: General information for healthy elderly people; For age (men vs. women), p-values by Student ’s t-tests are shown. For intergroup comparisons, Kruskal-Wallis test with Dunn’s post-hoc test for nonparametric analysis were used. For MMSE soccer, unpaired t-test with Welch’s correction were used. There were no significant differences in MMSE-J score per sex or age. SD: standard deviation. MMSE: mini mental state examination.
Participants were shown six items for 20 sec in three patterns, respectively, and their working memory was evaluated as several items the participants can memorize. Different patterns were used in each group to exclude the possibility that deflection of proving information items would affect the results. We evaluated participants’ percentage of correct answers of all total items.
B) Comprehension test: To assess participants’ comprehension of information provision, we asked participants to build objects per presented instructions and examined how many objects were built within three min. Three different objects (i.e., giraffe, flower, and tulip) were to be built using blocks. The instructions were presented three different ways (pictures only, words only or both pictures and words) (Figures 3a and 3b).

Figure 3a. Objects used in the comprehension test; Participants were randomly instructed to build one of three objects to test their comprehension (experiments were blinded).

Figure 3b. Objects used in the comprehension test; Participants constructed the objects under three distinct conditions: 1) instructions included pictures only, 2) instructions included words only, and 3) instructions included both pictures and words.
All groups completed the tasks in different random orders to exclude the potential influence of task type. We evaluated participants ’ percentage of blocks used correctly among all blocks. For example, complete construction of the giraffe required fifteen blocks; if six blocks were used correctly, the participant received a score of 40% (6/15 × 100) (Table 2).
| n | Figures only | Words only | Both figures and words | Friedman test | Dunn’s test | |
|---|---|---|---|---|---|---|
| Total | 18 | 71.3 ± 24.1ᵃ | 51.9 ± 18.9ᵃ | 64.8 ± 13.9 | χ²=10.13 | a: p<0.05 |
| p=0.006 | ||||||
| Group A | 6 | 72.2 ± 31.0 | 61.1 ± 17.2 | 61.1 ± 8.61 | χ²=2.24 | NS |
| p=0.43 | ||||||
| Group B | 6 | 86.1 ± 12.6ᵇ | 55.6 ± 17.2ᵇ | 69.4 ± 16.4 | χ²=7.04 | b: p<0.05 |
| p=0.012 | ||||||
| Group C | 6 | 52.8 ± 6.8 | 38.9 ± 17.2ᶜ | 63.9 ± 16.4ᶜ | χ²=8.67 | c: p<0.05 |
| p=0.008 |
Table 2: The result of the non-parametric analysis of the working memory test (mean ± SD); Working memory was evaluated as the percentage of correct answers participants could memorize of all items. Intragroup comparisons were made by using the Friedman test with Dunn ’ s post-hoc test for non-parametric analyses. Ps<0.05 were considered significant. Intergroup comparisons were made using the Kruskal-Wallis test with Dunn ’ s post-hoc test. In the test that was presenting Figures only, the percentage of correct answers in group C was significantly lower than that of group B (χ²=8.01, p=0.018). When we presented items by Figures only, the participants could memorize the items; however, some interpreted the figures in different words. For example, a picture showing a “police man” was also interpreted as a just “man” or a “security guard”. We counted these alternate answers as correct answers.
Statistical analysis
All statistical analyses were performed using GraphPad Prism5 software (GraphPad Software Inc., San Diego, USA). For continuous variables, independent samples were compared using the Student ’ s t-test and unpaired t-test with Welch ’ s correction. Inter- and intragroup comparisons were made using Kruskal-Wallis tests with Dunn’s post-hoc tests, and Friedman tests with Dunn’s post-hoc tests for non-parametric analyses, respectively.
Associations between test results and MMSE-J scores or age were estimated using Spearman ’ s rank correlation coefficient (ρ) which were interpreted per the criteria defined by Swinscow: 0.00-0.19, very weak; 0.20-0.39, weak; 0.40-0.59, moderate; 0.60-0.79, strong; and 0.80-1.00, very strong. A linear regression analysis was used to assess the relationship between test results and MMSE-J score or age. The test results served as the primary predictor variable, and MMSE-J or age served as the dependent variable. Significance was set at p<0.05.
Results
Participants’ characteristics
We examined whether participants’ sex was associated with their MMSE-J scores. Participants ’ general characteristics are described in Table 1. There were eight men and 10 women. There were no significant age differences between male and female participants or between groups. There were also no significant differences in MMSE-J scores between men and women or between groups. Since MMSE-J scores are associated with cognitive function [19], our findings suggest that sex differences were not associated with the working memory and comprehension tests.
Working memory test
To examine working memory, we used three groups of words and figures-Group A, B, and C, to avoid the side effect by deviation of order for stimulation by words and figures. Compared to group A, groups B and C had pictures and words that were usually more familiar to older adults in Japan. Therefore, we hypothesized that participants would recall more objects from groups B and C as compared to group A. Table 2 shows the results of the non-parametric analysis of the working memory test. Differences between the presentation styles were evaluated with Friedman tests and Dunn’s post-hoc tests. The total mean percentage of correct objects that participants memorized was significantly higher in “figures only” (71.3 ± 24.1) as compared to “words only” (51.9 ± 18.9) and “figures and words” (64.8 ± 13.9; see Table 2 and Figure 4). This difference was significant (χ2=10.13, p=0.006) (Figure 4).

Figure 4. Statistical results of working memory and comprehension tests; Left: Distribution of participants’ correct answers (%) on the working memory test. Right: Distribution of participants ’ correct answers (%) on the comprehension test.
We also analyzed the results in each group using Friedman tests with Dunn’s post-hoc tests for non-parametric analyses. In group A, there was no significant difference among the different presentation ways (χ2=2.24, p=0.43). In groups B and C, there was a significant difference in the mean percentage of correct answers that participants memorized among the different presentation methods (χ2=7.04, p=0.012; χ2=8.67, p=0.008, respectively). There was also a significant difference between presenting with both “figures and words” in groups B and C (both ps<0.05). In group C, there was a significant difference between presenting with “words only” (p<0.05). In addition, intergroup comparisons were performed with Kruskal-Wallis tests and Dunn’s post-hoc tests. Concerning “figures only,” the percentage of correct answers in group C was significantly lower than that of group B (χ2=8.01, p=0.018). The other relationships were non-significant.
Comprehension test
Table 3 shows the results of the non-parametric analysis of the comprehension test. Differences in the distinct instructions that were provided were evaluated using Friedman tests and Dunn’s post-hoc tests. The total mean scores were 83.0 ± 24.1 (instructions with pictures), 51.0 ± 35.9 (instruction with words), and 86.2 ± 21.0 (instructions with both pictures and words; Figure 4). This difference between groups was significant (χ2=14.37, p<0.01). Those who received instructions with both pictures and words performed significantly better than did those who received instructions with only words (p<0.01).
| n | Pictures only | Words only | Both pictures and words | Friedman test | Dunn’s test | |
|---|---|---|---|---|---|---|
| Total | 18 | 83.0 ± 24.1 | 51.0 ± 35.9ᵃ | 86.2 ± 21.0ᵃ | χ²=14.37 | a: p<0.01 |
| p<0.01 | ||||||
| Group A | 6 | 79.3 ± 32.1 | 65.7 ± 35.2 | 82.3 ± 28.4 | χ²=0.82 | NS |
| p<0.74 | ||||||
| Group B | 6 | 98.8 ± 2.86 | 62.7 ± 38.4 | 89.7 ± 20.8 | χ²=7.43 | NS |
| p<0.012 | ||||||
| Group C | 6 | 70.5 ± 20.6 | 24.7 ± 19.9ᵇ | 86.7 ± 15.2ᵇ | χ²=11.6 | b: p<0.01 |
| p<0.01 |
Table 3: The results of the non-parametric analysis; We evaluated the results as the percentage of built blocks among all blocks. Intergroup comparisons were made using the Friedman test with Dunn ’ s post-hoc test for non-parametric analyses. Ps<0.05 was considered significant. Intergroup comparisons were made using the Kruskal-Wallis test with Dunn’s post-hoc test. There were no significant differences among all groups in each trial.
We further analyzed the results in each group. Participants who received instructions with pictures only (group B, 98.8%) performed the best, while those received instructions with word only (group C, 24.7%) performed the worst. In group A, there was no significant difference among the methods of delivering instructions (χ2=0.82, p=0.74). In group B, there was a significant difference among the methods of delivering instructions (χ2=7.43, p=0.012); however, there was no significant difference between each of them (per Dunn’s test). In group C, there was a significant difference among the methods of delivering instructions (χ2=11.6, p<0.01) (Table 3).
Correlation between test results and MMSE-J scores and age
We revealed that MMSE-J scores were negatively correlated with age (ρ=-0.682, p=0.002). Next, we examined the correlations between MMSE-J scores and working memory results. Results revealed that there was a moderate positive correlation between MMSE-J score and working memory test results-specifically, when participants were presented with items using “ figures only” or “words only” (ρ=0.554, p=0.02; ρ=0.4540, p=0.058, respectively) (Figure 5 and Figure 6).

Figure 5. Correlation between MMSE score and age; MMSE score was negatively correlated with age.

Figure 6. Correlation of test results and participant property; (a) Correlation between participants’ correct answers and MMSE score (upper panels) or age (lower panels). (b) Correlation between number of building blocks correctly used and MMSE score (upper panels) or age (lower panels).
Conversely, there was a strong negative correlation between age and working memory test results-specifically, when participants were presented with items using “figures only” or “words only” (ρ=-0.641, p=0.04; ρ=-0.607, p=0.008, respectively). However, there was no significant correlation between the test results and MMSE-J score nor age when items were presented with “both figures and words ” (ρ=0.4188, p>0.05; ρ=-0.377, p>0.05, respectively; Figure 6a).
Regarding comprehension, there were significant positive correlations between all test results and MMSE-J scores (pictures only, ρ=0.630, p=0.005; words only, ρ=0.488, p=0.040, and pictures and words, ρ=0.610, p=0.007). All test results were significantly related to age as well (pictures only, ρ=-0.649, p=0.004; words only, ρ=-0.513, p=0.029; and pictures and words, ρ=-0.573, p=0.013; Figure 6b).
Discussion
The purpose of this study was to determine whether the method of delivering instructions was associated with older adults’ ability to remember and comprehend information. Regarding working memory, higher scores were associated with “figures only” and “ figures and words ” as compared with “ words only ” presentation. These findings suggest that viewing figures enhances older adults’ ability to remember objects. Conversely, older people may find it difficult to remember information based solely on words; therefore, what mechanism makes “figures” more advantageous for working memory than “words?” Neural correlates of working memory reside in the prefrontal cortex (PFC) [20]. Recently, a 2019 magnetoencephalography study reported that parieto-occipital regions of the cortex, which is associated with visual information processing related to planning [21] was activated during working memory tasks [22]. When older adults look at figures and plan to build blocks, their brain regions for working memory (e.g., PFC) are activated.
On the other hand, the brain regions related to verbal informational processing differ. When people remember words, the parieto-temporal region is activated [23]. Intriguingly, this fMRI study also reported that working memory for “words” (as compared to for “figures”) was delayed during the formation of the phonological loop in the brain regions including the PFC, suggesting that figures were faster than words for working memory acquisition associated with informational processing in the PFC. In addition, repetitive demonstration of words attenuated PFC activity more so than figures [24], indicating that the permissible range of working memory for words only is less than that for figures only. This model suggests that working memory may be longer for figures than for words, which is consistent with a prior study that examined older adults’ brain regions [25], Altogether, our findings support that older adults’ working memory is enhanced by “ figures ” as compared to “words.”
Next, regarding comprehension, participants’ task completion was significantly lowest in those presented with “words only” instructions as compared to the other two methods, which is consistent with our working memory results above. Surprisingly, when we examined comprehension results per groups, the results were multifaceted. For example, in groups A and C, the “figures and words” instructions resulted in the highest scores; whereas, “figures only” instructions resulted in the highest score in group B [26-28]. Furthermore, the scores of those receiving “words only” instructions in group C was very low. Why did such a difference occur? This might be explained by the order of stimuli. In group C, the comprehension test was performed as follows: 1) figures+words, 2) words only, and 3) figures only. Older adults with low MMSE-J scores may understand the content of stimuli only when words are present (i.e., “figures and words” or “words only), which indicates why “figure only” resulted in the lowest score [29,30].
Conclusion
Finally, we need to discuss some study limitations. In this study, all participants were healthy. Typically, older adults show declining cognitive ability or age-related dementia. However, understanding the individual word seems to be normal. Bickel and colleagues conducted a study on syntactic comprehension and reported that patients with AD could understand the words; however, they had difficulty understanding the passive voice and atypical word order. If older adults have an MCI, even if their MMSE-J scores look normal, they may misunderstand the meaning of words or sentences. To test the mechanism from another approach, brain functional imaging may be useful. Recent findings suggest that brain activity patterns during various sensory and motor stimuli were altered in individuals with an MCI. In addition, an fNIRS study reported that MCI impaired PFC activity during verbal tasks. Finally, prior fNIRS studies that focused on PFC activity during various sensory stimuli reported that distinct type or timing of stimuli for sensation showed different modalities in spatio-temporal dynamics of PFC activities. Although these previous participants were younger than the current participant, the approach might apply with older adults. In conclusion, optimal presentation of words and figures is critical to promote older adults’ memory and comprehension.REFERENCES
- Hinault T, Lemaire P. Age-related changes in strategic variations during arithmetic problem solving: The role of executive control. Prog Brain Res. 2016;227:257-276.
- Stine-Morrow EA, Payne BR. Age differences in language segmentation. Exp Aging Res. 2015;42(1):83-96.
- Nakagawa Y, Koyama T.Grammatical deficits in old age: Influence of aging and cognitive impairment on language ability. High Brain Funct Res.2019;25:179-186.
- Schneider BA, Avivi-Reich M, Daneman M. How spoken language comprehension is achieved by older listeners in difficult listening situations. Exp Aging Res. 2016;42(1):31-49.
- Di Rosa E, Pischedda D, Cherubini P, Mapelli P,Tamburin S, Burigo M. Working memory in healthy aging and in Parkinson’s disease: Evidence of interference effects. Aging Neruopsychol Cog. 2016;24(3):281-298.
- Bleecker ML, Bolla-Wilson K, Kawas C, Agnew J. Age‐specific norms for the mini‐mental state exam. Neurol. 1988;38(10):1565-1568.
- Giuli C, Papa R, Lattanzio F, Postacchini D. The effects of cognitive training for elderly: Results from my mind project. Rejuvenation Res. 2016;19(6):485-494.
- Goelet P, Castellucci VF, Schacher S, Kandel ER. The long and the short of long–term memory-a molecular framework. Nature. 1986;322:419.
- Miyake A, Shah P. Models of working memory. In: Miyake A, Shah P (eds) Models of working memory: Mechanisms of active maintenance and executive control, Cambridge. Cambridge University Press,USA,1999; pp.1-27.
- Baddeley AD, Hitch G. Working memory. Psychol Learn Motiv. 2018;8:47-89.
- Anders EK,Walter K. Long-term working memory. Psychol Rev. 1995;102(2):211-245
- Glisky EL. Changes in cognitive function in human aging. In: D. R. Riddle (ed) Brain aging: Models, methods, and mechanisms Boca Raton (FL): CRC Press/Taylor & Francis Group, LLC, UK, 2007; pp.3-20.
- Klencklen G,Lavenex PB, Brandner C, Lavenex P.Working memory decline in normal aging: Is it really worse in space than in color? Learn Motiv. 2017; 57:48-60.
- Stott J, Spector A. A review of the effectiveness of memory interventions in mild cognitive impairment (MCI). Int Psychogeriatr. 2011;23(4):526-538.
- Pichora-Fuller MK, Levitt H. Speech comprehension training and auditory and cognitive processing in older adults. Ame J Audio. 2019;21(2):351-357.
- McCarrey AC, Henry JD, Luszcz M. Potential mechanisms contributing to decision-making difficulties in late adulthood. Gerontol. 2010;56(4):430-434.
- Rauers A, Riediger M, Schmiedek F, Lindenberger U. With a little help from my spouse: Does spousal collaboration compensate for the effects of cognitive aging? Gerontol. 2011;57(2):161-166.
- Zinke K, Zeintl M, Eschen A, Herzog C,Kliegel M. Potentials and limits of plasticity induced by working memory training in old-old age. Gerontol. 58(1):79-87.
- Baños JH, Franklin LM. Factor structure of the mini-mental state examination in adult psychiatric inpatients. Psychol Assess. 2002;14(4);397-400.
- Eriksson J, Vogel EK, Lansner A, Bergström F, Nyberg L. Neurocognitive Architecture of Working Memory. Neuron. 2015;88(1):33-46.
- Wang A, Li Y, Zhang M,Chen Q (2016) The role of parieto-occipital junction in the interaction between dorsal and ventral streams in disparity-defined near and far space processing. PLoS One. 11(3):e0151838.
- Quentin R, King JR, Sallard E, Fishman N, Thompson R, Buch ER, et al. Differential brain mechanisms of selection and maintenance of information during working memory. J Neurosci. 2019;39(19): 3728-3740.
- Buchsbaum BR, D'Esposito M. A sensorimotor view of verbal working memory. Cortex. 2018;112:134-148.
- Kawakubo Y, Yanagi M, Tsujii N, Shirakawa O.Repetition of verbal fluency task attenuates the hemodynamic activation in the left prefrontal cortex: Enhancing the clinical usefulness of near-infrared spectroscopy. PLoS One. 2018;13(3):e0193994.
- Elderkin‐Thompson V, Hellemann G, Pham D, Kumar A. Prefrontal brain morphology and executive function in healthy and depressed elderly. Int J Geriatr Psychiatry. 2008;24(5):459-468.
- Bickel C, Pantel J, Eysenbach K, Schröder J. Syntactic comprehension deficits in alzheimer's disease. Brain Lang. 2000;71(3):432-448.
- Liu X, Tu Y, Zang Y, Wu A, Guo Z, He J. Disrupted regional spontaneous neural activity in mild cognitive impairment patients with depressive symptoms: A resting-state fMRI study. Neural Plast. 2019; 2019:1-6.
- Tang TB, Chan YL. Functional connectivity analysis on mild Alzheimer’s disease, mild cognitive impairment and normal aging using fNIRS. 40th Annual International Conference of the IEEE Engineering in Medicine and Biology Society (EMBC) (2018).
- Imamura Y, Jin T, Hori S, Tsujita N, Yoshikawa N, Murakami Y, et al. Continual dynamics of prefrontal oxyhemoglobin patterns during emotion and feeling in humans. J Multi Eng Sci Stud. 2015;1(1):6-11.
- Imamura Y, Murakami Y, Miura K, Miyazaki T, Yamada K, Koh S, et al. Profound haemodynamic response in the prefrontal cortex induced by musical stimuli. J Neuro Brain Imag. 2018;2:13.
Citation: Imamura Y, Murakami Y, Kimura Y, Maeda O, Tsujii M, Konishi K, et al. (2019). Information Delivery Methods and their Association with Older Adults Memory and Comprehension. J Aging Sci 7: 207.
Copyright: © 2019 Imamura Y, et al. This is an open-access article distributed under the terms of the Creative Commons Attribution License, which permits unrestricted use, distribution, and reproduction in any medium, provided the original author and source are credited.