PMC/PubMed Indexed Articles


Indexed In
- Open J Gate
- Genamics JournalSeek
- JournalTOCs
- China National Knowledge Infrastructure (CNKI)
- Electronic Journals Library
- RefSeek
- Hamdard University
- EBSCO A-Z
- OCLC- WorldCat
- SWB online catalog
- Virtual Library of Biology (vifabio)
- Publons
- MIAR
- Euro Pub
- Google Scholar
Useful Links
Share This Page
Journal Flyer

Open Access Journals
- Agri and Aquaculture
- Biochemistry
- Bioinformatics & Systems Biology
- Business & Management
- Chemistry
- Clinical Sciences
- Engineering
- Food & Nutrition
- General Science
- Genetics & Molecular Biology
- Immunology & Microbiology
- Medical Sciences
- Neuroscience & Psychology
- Nursing & Health Care
- Pharmaceutical Sciences
Research Article - (2019) Volume 10, Issue 4
Impacts of Climate Change on Bread Wheat (Triticum aestivum L) Yield in Adet, North Western Ethiopia
Endalew Assefa Abera1*, Mezgebu Getnet2 and Lisanework Nigatu32International Crops Research Institute for the Semi-Arid Tropics (ICRISAT), Patancheru, Hyderabad, India
3Haramaya, Oromia, Ethiopia
Received: 25-Jul-2019 Published: 03-Sep-2019
Abstract
Quantifying the extent and direction of climate change and its impacts is important on crop production as earth’s climate is undergoing changes. Thus the aim of this study was to assess the historical and future climate and its change impact on the yield of Tay and Senkegna bread wheat varieties in Adet, North Western Ethiopia. The observed daily climate data were obtained from National Meteorological Agency of Ethiopia, Bahir Dar branch for 33 years (1983 - 2015). Future climate data were from Climate Research Programme’s Fifth Coupled Model Intercomparison Project (CMIP5) database across 20 GCMs for RCP 8.5 emission scenarios in the time horizon of early-term (2010-2039), mid-century (2040-2069) and end-century (2070-2100). Soil data were obtained from Adet Agricultural Research Center. The onset, end dates, Length of Growing Period (LGP) and dry spell risk for the main rainy season were analyzed using first-order Markov model built in INSTAT tools version 3.36. Decision Support System for Agro-technology Transfer (DSSAT) crop model was employed during yield simulation. Onset of rainy seasons occurred before 1st decade of June was only 25% of the study years while it occurred before 2nd decade of June was 75% of the study years with coefficient of variation (CV) 5.3%. The end date of the rainy seasons occurred before 1st decade of November was 25% of the study years and occurred before 2nd decade of November was 75% of the study years with CV of 3.7%. Length of Growing Period (LGP) was ranged between 125-185 days with CV of 9%. The observed rainfall was decreased while both maximum and minimum temperatures were increased significantly (P<0.05). The projected maximum temperature is expected to increase by 1 to 4.69°C in 2030 to 2080. Furthermore, minimum temperature will increase by 0.93 to 4.73°C in 2030 to 2080. For Tay bread wheat variety, the grain yield is expected to increase by 0.5-1.3% in 2030 to 2050 but decreasing of 3% in 2080s. For Senkegna bread wheat variety, the yield is also increase by 1-2.3% in 2030 to 2080 relative to the baseline. However, days to anthesis and days to maturity of both wheat varieties will decline by 5-21% from the baseline.
Keywords
Climate change; Yield simulation; Wheat; Ethiopia; East Africa
Introduction
Most climate models predict global temperature is increased compared to the mean historical due to higher levels of atmospheric carbon dioxide (CO2) concentration [1]. Some studies argued that the elevated of CO2 concentration increases photosynthesis, and thereby increasing the carbohydrate pools of leaves and stems, and finally to grain yield [2]. On the contrary, Wolf et al. [3] reported that temperature increase would result in yield reduction whereas increased the level of precipitation and CO2 fertilization would have positive impact on the production of wheat in Europe. Gbetibouo and Hassan [4] also found that temperature increase would be havoc wheat productivity. In case of Ethiopia, climate change affects the wheat crop production, and wheat species will be shift to higher altitude [5]. Raising temperature and rainfall variability are observed in Ethiopia [6]. The spatial and temporal variability of rainfall during the rainy season alter national crop production by 90–95% in Ethiopia [7]. According to Agnew and Chappel [8] report in Amhara region, extreme, severe and moderate droughts were occurred in 1987, 1990, and 1992 respectively. In addition to this report, Woldeamlak [9] found that the year 1984 was come up with the lowest rainfall record and caused the worst drought. Dereje et al. [6] point out the start of the rainy season over Amhara region experienced with little shift for most of the study stations. From the report, June 15 was the date when long rainy seasons were started in the region. Further, the end date of rainy season also about third of November, in which the normal rainy season ceases in most parts of the Amhara region.
Tay and Senkegna bread wheat varieties are commonly grown in the Amhara region [10] and have the common planting date about mid-June [11]. The future production of Tay and Senkegna bread wheat varieties predicted to 44 and 45 qt ha-1 in the time period of 2030 to 2080 respectively [12]. On the other hand, the simulation days from planting to flowering and to maturity of Tay and Senkegna wheat varieties will be declined.
Climate impact study using crop model is the recent approach in agricultural research, which is used to identify the critical effect of rainfall and temperature at different stages of the crop with related the physical and chemical properties soil and CO2 concentration [13] and this approach is urgent instrument in Ethiopia [14]. Climate models are used to simulate global climate and downscale the reliable representation to local level [15], while crop models are also used to evaluate the impact of climate change on crop production as a result of increased greenhouse gases emissions [16]. CERES-Wheat is one of process-oriented management level tool, which is embedded in DSSAT model that has capacity to simulate the growth, development and yield of wheat under diverse environments in DSSAT model [17]. Therefore, this study focused on assessing the climate variables and simulating the climate change impact on phenological stage and yield of Tay and Senkegna bread wheat varieties in the study area.
Materials and Methods
Description of study area
The study was conducted in Adet Agricultural Research Centre (AARC) including the similar agro ecological areas in North Western Ethiopia. The Adet is found in Amhara Region with the geographical reference of 11°16’N latitude and 37°29’E longitude at an altitude of 2216 m above mean sea level (Figure 1). The mean annual rainfall is 1250 mm, and the average annual maximum temperature is 25.5°C and minimum temperature is 9.2°C. The area is dominated with soil types of Nitosol, Vertisols and Luvisols [18].

Figure 1: Location map of the study area, Adet, North Wstern Ethiopia.
Materials
The basic data used for DESSAT model were climate and soil data, in which the climate data including rainfall, minimum and maximum temperatures, wind speed, relative humidity, and solar radiation for 33 years (1983-2015) were obtained from National Meteorological Agency of Ethiopian, Bahir Dar Branch, and the projection climate data were obtained from Climate Research Programme’s Fifth Coupled Model Inter-comparison Project (CMIP5) multi-model database systems for early-term (2010-2039), mid-century (2040-2069) and end-century (2070-2100) under RCP 8.5. Similarly, soil data obtained from Adet Research Site soil profile in sample of four layers (Table 1). Abera [12] was used the climate data and soil sample during model calibration and validation for both Tay and Senkegna bread wheat varieties.
| Parameters | Soil depth (cm) | |||
|---|---|---|---|---|
| 0 - 30 | 30 -90 | 90 - 140 | 140 - 200 | |
| Clay | 66 | 69 | 68 | 64 |
| Silt | 24 | 15 | 18 | 24 |
| Sand | 12 | 16 | 14 | 12 |
| Bulk density (g/cm3) | 1.13 | 1.19 | 1.21 | 1.29 |
| Organic carbon (%) | 1.31 | 0.98 | 0.77 | 0.51 |
| Total Nitrogen (%) | 0.11 | 0.09 | 0.06 | 0.04 |
| pH | 5.2 | 6.3 | 6.8 | 7.1 |
| CEC (meq/100 g soil) | 50.1 | 52 | 55.2 | 55.8 |
Table 1: Physical and chemical soil properties in Adet experimental site, North Western Ethiopia (CEC: Cation Exchange) methodology.
Trend analyses: From the long term record of rainfall data during the rainy season (June to September), the rainfall characteristic, such as the onset dates, end dates, Length of growing season (LGP), and the dry spell risk have been analyzed using first-order Markov model built in INSTAT tools version 3.36 [19]. The temporal variability of rainfall and temperature for seasonal and annual totals across 1983 to 2015 years has been analyzed using equation (1 and 2).
 (1)
(1)
 (2)
(2)
Where CV was the coefficient of variation, δ was standard deviation ¯X was long year mean and N was total number of year during observations, Xi was rainfall of each month or season. If CV<20% as less variable, 20-30% as moderately variable and >30% as highly variable (Hare, 1983). Standardized anomaly index was calculated as the difference between the annual (seasonal) total of a particular year and the long term average rainfall records divided by the standard deviation of the long term data using the formula (3):
 (3)
(3)
Where Z was the standardized rainfall anomaly of the season for each year.
Downscaling future climate data: Agricultural Model Intercomparison and Improved Project (AgMIP) scenario generation scripts with R analytical tool [20-22] was used to generate the daily data of rainfall, minimum and maximum temperatures, and solar radiation by perturbing the daily baseline data (1980-2010) using Delta factors method. Many authors, such as Abera et al. [23] and Abera [12] used this method to assess the impact of climate change on maize production and to calibrate the bread wheat varieties in Ethiopia, respectively. The adjustment formula for modifying precipitation, maximum and minimum temperatures are stated to be given in equation (4) and (5) respectively.
 (4)
(4)
Where Padj,fur,d was the adjusted daily rainfall for the future years, Pobs,d was the observed daily rainfall for the base years, P̅GCM.fur,m was the monthly mean rainfall of GCMs outputs for the future years, P̅ GCM.ref,m was the monthly mean rainfall of GCMs outputs for the base years, pi was the weight of each grid cell, and k was the number of grid cells.
For temperature:
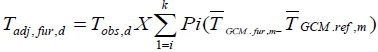 (5)
(5)
Where Tadj,fur,d was the adjusted daily maximum or minimum temperature for the future years, Tobs,d was the observed daily maximum or minimum temperature for the baseline years, T̅GCM.fur,m was the monthly mean maximum or minimum temperature of GCMs data outputs for the future years, T̅GCM.ref,m was the monthly mean temperature of GCMs outputs for the base years, pi was the weight of each grid cell, and k was the number of grid cells.
The genetic coefficients used for yield simulation were obtained from well calibrated and validating by Abera [12] in DSSAT for Tay and Senkegna bread wheat varieties particularly in the study environment condition. These genetic coefficients are presented in Table 2. The performance of the model or goodness of fits (R2) were 86%,70% and 96% for anthesis day, grain yield and for physiological maturity days respectively for Tay bread wheat varieties. Similarly for Senkegna bread wheat variety R2 were 89%, 82% and 75% for anthesis day, grain yield, and physiological maturity days respectively [12].
| Symbols | Definitions | Tay | Senkegna |
|---|---|---|---|
| variety | variety | ||
| P1V | Days, optimum temperature required for vernalization (°C) | 9 | 10 |
| P1D | Photoperiod response (% reduction in rate/10 h drop in pp) | 25 | 31 |
| P5 | Grain filling (excluding lag) phase duration (°C.d) | 727 | 745 |
| G1 | Kernel number per unit canopy weight at anthesis (#/g) | 42 | 41 |
| G2 | Standard kernel size under optimum conditions (mg) | 45 | 52 |
| G3 | Standard non-stressed mature tiller wt (incl grain) (g dwt) | 2.8 | 2.3 |
| PHINT | Interval between successive leaf tip appearances (°C.d) | 139 | 135 |
Table 2: Genetic coefficients used for yield simulation for both bread wheat varieties in Adet, North Western Ethiopia.
The yield simulation was depending on productivity of Tay and Senkegna bread wheat varieties in response to a range of temperature, rainfall, and solar radiation using the crop model of DSSAT v.4.7. The seasonal variability of wheat yield and phenology under future climate was determined using Excel Spreadsheet and R analytical tools. Yield gap analysis method was employed to quantify the differences between simulated potential yield and baseline levels and to identify those factors responsible for the yield differences [24-26]. For comparison purpose, the baseline yield was simulated depending on the historical climate data from 1983- 2015, and the future yield in time slices of 2030s, 2050s, and 2080s also simulated depending on the ensemble of 20 Global Climate Models climate data for RCP 8.5 scenario. Finally, the performance of both crops with the prescribed changes was compared with the baseline as follows:
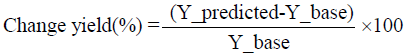 (6)
(6)
Result and Discussion
Characteristics of rainfall features
Characteristics of rainfall (i.e., onset date, end date, Length of Growing Period and Dry spell) are depicted in Table 3. Onset of rainy seasons occurred before 1st decade of June (5-June) was in only 25% of the study years while it occurred before 2nd decade of June (15-June) in 75% of the study years with coefficient of variation (CV) was 5.3%. On the other hand, the end date of rainy season occurred before 1st decade of November (2-Nov) was only 25% of the study years and occurred before 2nd decade of November (18-Nov) was 75% of the study years with CV of 3.7%. Further, it could be noted from the Table 3, the Length of Growing Period (LGP) of the main rainy season was ranged between 145 days (25% of the study years) and 161 days (75% of the study years) and had minimum and maximum value of 125 and 185 days respectively with CV of 9% (Table 3). The variability of end date was less compared to the onset date and the length of growing period. The results of length of growing period about 145 to 161 are enough to support both bread wheat varieties. In line with this, [6] pointed out the start of the rainy season has been occurring with little shift for most of the study stations over western Ethiopia. Reliable prediction of rainfall characteristics, especially the onset is needed to determine a less risky planting date, planting method and sowing with less risky varieties of crops in responsive farming [27]. Shortening or lengthening of the LGP impacts the range of crops that can be cultivated in an area [28]. The subsistence farmers and farming systems strongly depend on the crop choice, the year-to-year LGP variability, and longer-term trends in LGP [29]. The spatial assessment of LGP can help to characterize farming systems and important input to the Agro-Ecological Zoning (AEZ) approach [30,31].
| Statistical parameters | Onset | End date (season) | LGP (No of days) |
|---|---|---|---|
| Minimum | 01-Jun | 18-Oct | 125 |
| Quartile 1 (25%) | 05-Jun | 02-Nov | 145 |
| Median _Quartile 2 (50%) | 09-Jun | 08-Nov | 151 |
| Quartile 3 (75%) | 15-Jun | 18-Nov | 161 |
| Maximum | 29-Jun | 05-Dec | 185 |
| Mean | 09-Jun | 10-Nov | 152 |
| CV (%) | 5.3 | 3.7 | 9 |
Table 3: Descriptive statistics for climate characteristics (1983 to 2015) in Adet, North Western Ethiopia.
Probability of dry spell length
All dry spell days probability have less risk probability at the beginning of June and less than 10% during the rainy season (Figure 2). The lower dry spell probability during the rainy season was more appropriate for Tay and Senkegna bread wheat verities which have recommended common planting dates in the mid of June and the maturity dates about in the 1st week of October. The dry spell length occurred at flowering and grain filling stages of any of crop is most sensitive and potentially damaging [6]. Identifying dry spell lengths is useful information for different groups of farmers to decide whether to plant long growing crops or short maturity crops.

Figure 2: Probability of dry spell length (1983-2015) in Adet, North Western Ethiopia (Sp7=Seven dry spell days, Sp10=Ten dry spell days, Sp15=Fifteen dry spell days).
Seasonal (JJASO) rainfall trend
Using equation (1 and 2), the seasonal observed rainfall trend for the period of 1983 to 2015 is shown in Figures 3 and 4. From this analysis, the seasonal rainfall showed decreasing significantly (p<0.05) with 6 mm per year over the study area (Appendix-Table 1).

Figure 3: Seasonal (JJASO) rainfall trend (1983-2015) in Adet, North Western Ethiopia.

Figure 4: Annual maximum temperature trend (1983-2015) in Adet, North Western Ethiopia.
Annual temperature trends
Figures 5 and 6 depicted the trends of annual historical maximum and minimum temperature respectively for the study period (1983- 2015). It has showed an increasing trend significantly (P<0.05) with 0.02 and 0.09°C per years for maximum and minimum temperature respectively (Appendix-Table 1). The increasing temperature might enhance the evapotranspiration process which results soil moisture stress and shorten the growth period of wheat crop. In Ethiopia, the average annual minimum and maximum temperatures have increased by about 0.25°C and 0.1°C every ten years respectively [32-35].

Figure 5: Annual minimum temperature trend (1983-2015) in Adet, North Western Ethiopia.

Figure 6: Annual rainfall standardized in Adet, North Western Ethiopia.
Seasonal rainfall anomaly
Standardizing the rainfall (using equation (3), below normal deviation of rainfall years were like 1984, 1987, 1994, 1996, 2003, and 2007 while received above average rainfall in 1985, 1986, 1988, and 1991 (Figure 6). Disrupting or decreased amount of rainfall during the main rainy season (from June to September) reduces the National crop production by 90-95% in Ethiopia [7]. Agnew and Chappel [8] reported there have been four drought years in the Amhara region, two extreme (1984 and 1987), one severe (1990) and one moderate (1992) drought. In addition to this report, Woldeamlak [9] also reported that the year 1984 was a year of lowest rainfall record in the Western Ethiopia with the worst drought occurrence.
Future climate change relative to baseline
Future climate change relatives to the baseline period (1980-2009) are summarized in Table 4. The mean baseline annual rainfall was 1350 mm and the annual mean maximum and minimum temperatures were 26.5 and 10.4°C respectively. The projected of both maximum and minimum temperatures using (equation (5) are expected to increase in each time slice under RCP 8.5 scenario. On average, maximum and minimum temperatures are expected to rise by 1- 4.6°C and 0.93-4.73°C respectively in 2030 to 2080 time period. The rainfall also (equation (4) will increase by 2-5% in 2030 to 2080 time period (Table 4). The positive change or increase in temperature indicates it will be warmer relative to the baseline. IPCC [36,37] indicated that large scale increase in average temperature in the mid and late 21st century. If the increasing temperature is not offset by adequate moisture, the intensity and duration of drought might increase, and results in failure of bread wheat production. For instance for each °C increase in mean air temperature during grain filling in wheat crop the duration of grain filling was shortened by 3.1 days and final kernel weight was reduced by 2.8 mg [38].
| Variables | CO2 concentration (ppm) | RF (%) | Max Temp (°C) | Min Temp (°C) |
|---|---|---|---|---|
| Time slices | RCP 8.5 | RCP 8.5 | RCP 8.5 | RCP 8.5 |
| 2030 | 432 | 2.47 | 1.04 | 0.93 |
| 2050 | 571 | 2.92 | 2.76 | 2.51 |
| 2080 | 801 | 5.36 | 4.69 | 4.73 |
Table 4: Future rainfall and temperature change relative to baseline period (1983-2015) in Adet, North Western Ethiopia.
Rainfall distribution
Depending on the historical and future records rainfall data, the study area receives unimodal rainfall distribution during the main rainy season, in which the highest rainfall occurred from June to September. The projected rainfall has similar distribution with the historical baseline period (Figure 7). It should be noted that the slightly increase rainfall over the study area might not offset the negative impacts of temperature. The IPCC prediction on the level of precipitation showed a long-term increase in Ethiopia despite the short and medium term observation of frequent dry periods with extreme rainfall levels [39]. Flato et al. [38] noted, future climate projection is quite uncertain, the output depends on the number and type of GCMs used.

Figure 7: Projected annual rainfall distribution under RCP 8.5 scenario in Adet, North Western Ethiopia.
Maximum temperature
The average maximum temperature increase across the months from January until April and then decreasing up to July and finally rise from August to December (Figure 8). Similar pattern of projected maximum temperature is experienced with the historical baseline.

Figure 8: Projected annual maximum temperature under RCP 8.5 scenario in Adet, North Western Ethiopia
Minimum temperature
The average minimum temperature exhibits an increasing trend from January to April and stagnated for about four months, and then decline after July in all time slices (Figure 9). The increasing of temperature may have negative effect on yield production. For instance, for each °C increase in mean air temperature during grain filling in wheat, the duration of grain filling was shortened by 3.1 days and final kernel weight was reduced by 2.8 mg [39]. Wheat yield also has been predicted to decrease approximately 3−4% for each 1°C rise in temperature above 15°C during the grain filling period [40,41]. You et al. [42] also carried out research in China and found out that an increase in temperature of 1°C during the growing period may lead to wheat production reduction of 3–10%.

Figure 9: Projected annual minimum temperature under RCP 8.5 scenario in Adet North Western Ethiopia.
Variability of grain yield
For Tay wheat variety, the expected minimum yields are ranged between 22-30 qt ha-1 while maximum yields are between 45-49 qt ha-1 in time period of 2030-2080. On the other hand, 25% of yield results are ranged between 32-34 qt ha-1 and 75% of the yield results are between 40-44 qt ha-1 and less in time period of 2030-2080. Similarly, for Senkegna wheat 25% of yield results are expected in the range of 33-35 qt ha-1, and 75% of the yields are expected in the range of 44-45 qt ha-1 in time period of 2030-2080 (Table 5). The variability of yields with the coefficients of variations ranged between 14-17% in time horizon of 2030-2080 showed less varied thought the time period for both bread wheat varieties [43].
| Senkegna variety | Tay variety | |||||||
|---|---|---|---|---|---|---|---|---|
| Statistical parameters | Baseline | 2030 | 2050 | 2080 | Baseline | 2030 | 2050 | 2080 |
| Minimum | 29.37 | 30.12 | 28.7 | 22.89 | 30.57 | 30.21 | 27.8 | 18.03 |
| 1st quadrant | 33.26 | 32.96 | 33.47 | 34.75 | 32.89 | 32.66 | 33.26 | 33.48 |
| Median | 36.73 | 37.97 | 38.41 | 38.8 | 36.82 | 37.63 | 37.97 | 35.39 |
| 3rd quadrant | 43.85 | 44.68 | 44.85 | 43.34 | 42.81 | 43.59 | 43.12 | 40.08 |
| Maximum | 51.15 | 50.26 | 50.36 | 49.57 | 49.13 | 49.77 | 49.05 | 45.42 |
| Mean | 38.79 | 39.18 | 39.68 | 39.11 | 38.2 | 38.81 | 38.47 | 36.1 |
| CV (%) | 16.7 | 17.2 | 16.7 | 15 | 15.6 | 16.7 | 15.5 | 14.9 |
Table 5: Variability of grain yield (qt ha-1) for Senkegna and Tay wheat at different Slices under RCP 8.5 scenario in Adet, North Western Ethiopia.
Change of wheat phenology
A yield gap analysis was done by using equation (6) and the results depicted in Figures 10 and 11. The days from planting to flowering and to maturity for the two wheat varieties are become shorten. Relative to the baseline, the anthesis and maturity days are expected to decrease by 5, 11 and 21% in 2030s, 2050s and 2080s for both wheat varieties (Figures 10 and 11). Abera [12] reported that the simulation days from planting to flowering and to maturity of Tay and Senkegna wheat varieties will be declined in the end of 2080. In line with this statement, the rise in temperature will increase the growth and development speed of the crops and leads to the shorter length period of grain filling [44]. On the other report, for each °C increase in mean air temperature during grain filling in wheat, the duration of grain filling was shortened by 3.1 days [38].

Figure 10: Change of anthesis days from the baseline in percentage for Tay and Senkegna wheat varieties in Adet, North Western Ethiopia.

Figure 11: Change of maturity days from the baseline in percentage for Tay and Senkegna wheat varieties in Adet, North Western Ethiopia.
Wheat yield change
The yield change in future climate relative to the baseline under RCP 8.5 emission scenarios are presented in Figure 12. The yield of Tay wheat is expected to increase by 0.5-1.3% in 2030 to 2050 but decreases by 3% in 2080s. The grain yield of Senkegna wheat will increase by 0.8-2.5% in all time slices. Future climate has positive impact on crop yield due to the elevated of CO2 concentration increases photosynthesis and thereby increasing the carbohydrate pools of leaves and stems, and finally to grain yield [2]. Schulthess et al. [3] reported that temperature increase would result in yield reduction whereas increased the level of precipitation and CO2 fertilization would have positive impact on the production of wheat in Europe. Gbetibouo and Hassan [4] also found that temperature increase would be havoc wheat productivity. These results suggest that an increase in temperature may offset the benefits of increasing CO2 concentration on crop yield. Different outers used crop models for yield prediction and reported that future climate has positive and negative impact on wheat production. Lobell et al. [45] used CERES-Wheat model and found 25% increase in wheat production in the Mexico region. Guojo et al. [46] reported wheat production increase by 3.1% at low altitude by 4% at high altitude up to 2030s.

Figure 12: Grain yield change in percentage from the baseline period for Tay and Senkegna wheat varieties in Adet, North Western Ethiopia.
Conclusion
The study output revealed that the rainy season over the study area was started in the 1st decade of June while the end date of rains was about in the 1st decade of November. The observed rainfall was decreased while both maximum and minimum temperatures showed increasing significantly (P<0.05). Climate projection revealed the increasing trend in temperature and rainfall in 2030 to 2080 time period. The positive change in temperature indicates it will be warmer than today in the study area. Although future climate changes have positive and negative impact on Tay wheat, the grain yield will increase relative to the baseline for both wheat varieties. On the other hand, the simulation days from planting to flowering and to maturity of the two wheat varieties become decline.
Acknowledgment
I would like to address my thanks to the Ethiopian Institute of Agricultural Research for sponsoring my study and Haramaya University for admission to pursue a higher education toward MSc degree, Agro meteorology and Natural Risk Management in the School of Natural Resources Management program and Environmental Sciences. I would like also to Mr. Fasil Mekuanent at Melkasa Agricultural Research Center, and Mr. Muluken, at Adet Agricultural Research Center for his support during crop data collection.
REFERENCES
- IPCC (Intergovernmental Panel on Climate Change). Climate Change 2007: Synthesis Report. Contribution of Working Groups I, II and III to the Fourth Assessment Report of the Intergovernmental Panel on Climate Change [Core Writing Team, Pachauri, R.K and Reisinger, A. (eds.)]. IPCC, Geneva, Switzerland.
- Attri SD, Rathore LS. Simulation of impact of projected climate change on wheat in India. Int J Clim. 2003;23:693-705.
- Schulthess U, Feil B, Jutzi SC. Yield independent variation in grain nitrogen and phoshororus concentration among Ethiopian wheat. Agronomy J. 1997;89:497-506.
- Gbetibouo GA, Hassen RM. Measuring the economic impact of climate change on Major South Africa Field Crops: A Ricardian Aproach. Global Planet Change.2004;47:143-152.
- Yumbya J, Kiambi D, Kebebew F, Rao KPC. Climate change effects on Tiff geographic ranges and its impacts on yield. Poster, African Biodiversity Conservation and Innovations Centre (ABCIC), Kenya. 2011; p. 1.
- Ayalew D, Tesfaye K, Mamo G, Yitaferu B, Bayu W. Variability of rainfall and its current trend in Amhara Region, Ethiopia. Afr J Agric Res. 2012;7:1475–1486.
- Kidane G. Agricultural based livelihood systems in drylands in the context of climate change. Inventory of adaptation practices and technologies of Ethiopia, Ethiopian Institute of Agricultural Research in collaboration with Environmental Sustainability. 2010; p. 112.
- Agnew CT, Chappel A. Drought in the Sahel. GeoJournal.1999;48:299-311.
- Woldeamlak B. Rainfall variability and crop production in Ethiopia; Case study in the Amhara region; proceeding of the 16th International conference of Ethiopian Studies, Addis Ababa, Ethiopia.2009.
- Misganaw F, Getachew A, Fisseha W. Identification of Adaptable Improved Bread Wheat (Triticum aestivum L.) Genotypes in North Western Ethiopia. J Bio, Agri and Healthc. 2015;5:1-8.
- Adet Agricultural Research Center (AARC). A field day in Yilmana Amhara Agricultural Research Institute-ARARI.
- Abera EA. Calibration and validation of CERES-wheat in DSSAT model for yield simulation under future climate in Adet, North Western Ethiopia. Afr J Agric Res. 2019;14:509–518.
- CRIDA (Central Research Instituite for Dryland Agriculture). Crop weather modeling lecture note by Subrahmanyanagar at Saidabad colony, Hyderabad, India in 2011.
- Habtamu A, Getnet M, Timothy ST, Michael W, Miriam K. East African agriculture and climate change: A comprehensive analysis-Ethiopia. International Food Policy Research Institute (IFPRI), ASARECA, CGIAR. 2012; p. 25.
- Hassan ZB. Climate change impact on precipitation and stream flow in a humid tropical Watershed, 2012.
- Rosenzweig C, Liverman D. Predicted effects of climate change on agriculture: A comparison of temperate and tropical regions. In: Majumdar, S.K., Ed., Global climate change: Implications, challenges, and mitigation measures, the Pennsylvania Academy of Sciences.1992; p. 342-361.
- Ritchie J, Singh U, Godwin D, Bowen W. Cereal growth, development and yield. In: understanding options for agricultural production. Academic publishers: Dordrecht. 1998; p. 98.
- Adet Agricultural Research Center. Soil of Adet Agricultural Research Center and its testing sites. National Soil Research Center Soil Survey and Land Evaluation Section.2006.
- Stern R, Knock J, Rijks D, Dale I. INSTAT Climatic Guide. 2003; p. 398.
- Diaz-Nieto J, Wilby RL. A comparison of statistical downscaling and climate change factor methods; impacts on low flows in the River Thamas, United Kingdom, Climate Change. 2005;69:245-268.
- The Agricultural Model Inter-Comparison and Improvement Project (AgMIP): Guide for regional integrated assessments; Handbook of methods and procedures, version 5. Center for Climate Systems Research, Earth Institute, Columbia University, AgMIP, New York, USA. 2013.
- IPCC (Intergovernmental Panel on Climate Change). Climate change: Impacts, adaptation and vulnerability. Summary for policy makers. Accessed on 18 December 2018.
- Abera K, Crespo O, Seid J, Mequanent F. Simulating the impact of climate change on maize production in Ethiopia, East Africa. Environ Syst Res. 2018;7:1-12.
- Lobell DB, Cassman KG, Field CB. Crop yield gaps: Their importance, magnitudes, and causes. Annual review of environment and resources. 2009; p. 179.
- Liang W, Carberry P, Wang G, Lü R, Lü H, Xia A. Quantifying the yield gap in wheat–maize cropping systems of the Hebei Plain, China. Field Cro Res. 2011; p. 185.
- Belay TK. Climate variability and change in Ethiopia: Exploring impacts and adaptation options for cereal production. Wit Graduate School of Production Ecology and Resource Conservation. PhD thesis. Wageningen University. 2014; p. 163.
- Stewart JI. Principles and performance of response farming in climatic risk in crop production. Model and management for the semi-arid tropics and sub-tropics. (Edited by Ford, W., Muchow, R. C., Bellamy, Z. A.), CAB.1991.
- Gregory PJ, Ingram JSI, Brklacich M. Climate change and food security. Philosophical Transactions of the Royal Society. B. Biol. Sci.2005;360: 2139–2148.
- Sarr B. Present and future climate change in the semi-arid region of West Africa: A crucial input for practical adaptation in agriculture. Atmo Sci Lett. 2012;13:108-112
- Fischer G, Nachtergaele FO, Prieler S, Teixeira E, Tóth G, Van Velthuizen H, et al. Global Agro-Ecological Zones (GAEZ v3.0): Model Documentation; IIASA and FAO: Laxenburg, Austria and Rome, Italy. 2012; p. 179.
- Fischer G, Van Velthuizen H, Shah M, Nachtergaele F. Global agro-ecological assessment for agriculture in the 21st Century: Methodology and results; IIASA: Laxenburg, Austria. 2002; p. 119.
- Fowler HJ, Blenkispo S, Tebaldi C. Link in climate change modelling to impacts studies: recent advances in downscaling technology for hydrological modeling. Rev Int J Clima. 2007;27:1547-1578.
- The agricultural model inter-comparsion and improvement project (AgMIP): Guide for running AgMIP climate scenarios generation tools with R in windows. AgMIP, New York, USA. 2013.
- The Coordinated Climate Crop Modeling Project C3MP: An initiative of the agricultural model inter-comparison and improvement project C3MP protocols and procedures. AgMIP, New York.2013.
- ARARI (Amhara Regional Agricultural Research Institute). Strategy Plan of Amhara regional Agricultural Research Institute. Bahir Dar, Ethiopia.2007.
- IPCC (Intergovernmental Panel on Climate Change). Mitigation of climate change. Technical summary. Working group III. 2014; p. 65.
- IPCC (Intergovernmental Panel on Climate Change). Summary for Policymakers. Climate Change: The physical Science Basis. Contribution of Working group I to the Fifth Assessment Report of Intergovernmental Panel on Climate Change Stocker (T.F., D. Qin, G.K. Plattner, M. Tignor, S.K. Allen, J. Bouschung, A. Nauels, Y. Xia, V. Bex. (Panel) 2013.
- Wiegand CL, Cuellar JA. Duration of grain filling and kernel weight of wheat as affected by temperature. Cro Sci. 1981;21:95-101.
- Ethiopian Economic Association (EEA). Climate Change and Development Adaptation Measures. Economic Focus, Addis Ababa, Ethiopia. 2008.
- Wardlaw IF, Wrigley CW. Heat tolerance in temperate cereals: an overview. Aust Pla Phy. 1994; 21:695-703.
- IPCC (Intergovernmental Panel on Climate Change). IPCC fourth assessment report: Climate change (AR4). Accessed on 18 December, 2018.
- You L, Rosegrant MW, Wood S, Sun D. Impact of growing season temperature on wheat productivity in China. Agri Met. 2009;149:1009-1014.
- Hare FK. Climate and desertification. Revised analysis (WMO-UNDP) WCP, Geneva, Switzerland. 1983;44:520.
- Menzel A. Plant phenological anomalies in Germany and their relation to air temperature and NAO. Climate Change. 2003;57:243-263.
- Lobell David B, Ortiz-Monasterio J, Ivan K, Gregory AP, Matson Patson A. Analyses of wheat yield and climate trends in Mexico. Field Cro Res. 2005;94:250-256.
- Guojo X, Qiang Z, Yubi Y, Hong Z, Runyuan W. Impacts of recent climatic change on yield of winter wheat at low and high altitude in semiarid North-western China. Agri Eco Envi. 2008;127: 37-42.
Citation: Abera EA, Getnet M, Nigatu L (2019) Impacts of Climate Change on Bread Wheat (Triticum aestivum L) Yield in Adet, North Western Ethiopia. J Pet Environ Biotechnol 10: 396. doi: 10.35248/2157-7463.19.10.396
Copyright: © 2019 Abera EA, et al. This is an open-access article distributed under the terms of the Creative Commons Attribution License, which permits unrestricted use, distribution, and reproduction in any medium, provided the original author and source are credited.