
Indexed In
- Open J Gate
- Genamics JournalSeek
- Ulrich's Periodicals Directory
- RefSeek
- Directory of Research Journal Indexing (DRJI)
- Hamdard University
- EBSCO A-Z
- OCLC- WorldCat
- Proquest Summons
- Scholarsteer
- Publons
- Geneva Foundation for Medical Education and Research
- Euro Pub
- Google Scholar
Useful Links
Share This Page
Journal Flyer
Open Access Journals
- Agri and Aquaculture
- Biochemistry
- Bioinformatics & Systems Biology
- Business & Management
- Chemistry
- Clinical Sciences
- Engineering
- Food & Nutrition
- General Science
- Genetics & Molecular Biology
- Immunology & Microbiology
- Medical Sciences
- Neuroscience & Psychology
- Nursing & Health Care
- Pharmaceutical Sciences
Research Article - (2020) Volume 10, Issue 1
Hydrodynamic Study and Influence of Physicochemical Parameters on Gas Retention in a Submerged Membrane Bioreactor
Nsoe MN1*, Kofa GP2, Marc H3, Ndi KS2 and Kayem GJ22Water Treatment and Filtration Research (Chem. Eng.) Group, Department of Process Engineering, ENSAI, University of Ngaoundere, Ngaoundere, Cameroon
3European Membrane Institute UMR 5635(CNRSENSCM-UM) CC047, Place Eugène Bataillon, Cameroon
Received: 05-Dec-2019 Published: 27-Dec-2019, DOI: 10.35248/2155-9589.20.10.201
Abstract
Gas-liquid reactors present transfer difficulties due to diffusion effects. It is necessary to master the aeration and hydrodynamics of the medium to conduct a better reaction and performance. For this purpose, a study in a submerged membrane bioreactor was been conducted. Gas retention was measured by the manometric method. The experiments were carried out at different temperatures; 25°C and 45°C, with a variable airflow rate of 3 to 16 mL/S and different solutions (osmosis water, ammonium formate solution, ammonium formate+salt solution, synthetic rubber effluent). The results show that gas retention increases with aeration rate and temperature. On the other hand, the more the medium becomes rich in organic substances, the more the gaseous retention decreases. The homogeneous fine-bubble regime is obtained for an airflow rate ranging from 3 and 10 mL/S of aeration. Beyond this flow rate, the regime becomes heterogeneous without a transition phase for ammonium formate and ammonium formate+salt solutions. The more the medium becomes rich in organic substances, the gas retention increases and KLa decreases. There is, therefore, a correlation between temperature, KLa and gas retention.
Keywords
Hydrodynamic; Gas retention; Submerged membrane bioreactor; Influence of temperature; Oxygen mass transfer coefficient
Introduction
In a submerged membrane bioreactor, the contribution of aeration plays three roles: (i) supply of oxygen to microorganisms, essential for the life and the oxidation of pollutants, (ii) stir the reactor to keep the particulate matter in suspension (i.e. the micro-organisms) while ensuring a perfect mixture with the substances to be oxidized and especially (iii) generate turbulence in the vicinity of the membrane in order to reduce deposition (clogging of the membranes) which is formed during the convective movement related to filtration. Low aeration or a discontinuous aeration mode is therefore unfavorable to the mixture (settling and/or creation of dead zones) or cause an accelerated clogging of the membranes due to an almost frontal filtration mode [1,2]. Membrane Bioreactors thus have energy consumption over conventional activated sludge processes due to membrane air averaging around 42% of requirements [2,3]. The energy costs of typical membrane bioreactor stations in municipal wastewater treatment, therefore, remain higher than the conventional activated sludge process [4], notes that the Heenvliet membrane bioreactors equipped with Toray flat membranes consume between 0.8 and 1.2 kWh/m3 of permeate produced. Overall, the authors agree that these consumptions can be reduced to reach a level of 0.7-0.8 kWh/m3 compared to 0.6 for conventional processes (40 kW/PE/year). It therefore it is necessary to control and optimize aeration as well as the various operating parameters that can influence aeration. In the literature, the majority of studies have focused mainly on the influence of the design variables (type, arrangement, density and immersion height of the diffusers) and of the operating variables (gas velocity, horizontal velocity of circulation) in order to reduce operating costs, optimize treatment and reduce membrane clogging [5-8]. However, physicochemical parameters such as environmental composition and temperature also influence oxygen transfer, mixing time and gas retention, and these parameters have been the subject of very few studies. For this reason, this study is devoted to global knowledge of the influence of temperature and substrate concentration on the hydrodynamics (mixing time and gas retention) of a submerged membrane bioreactor pilot.
Materials and Methods
Experimental set-up: Bioreactor membrane
The submerged membrane bioreactor pilot (Figure 1) studied consists of a plexiglass feed tank with a capacity of 40 L and 35 L of useful volume. A RENA brand compressor is used to inject air at the bottom of the reactor through a thin cylindrical PVC bubble diffuser; 8 cm diameter. The aeration cycles were fixed using a COGEX brand timer in order to have a maximum oxygen concentration of 6 mg.L-1 in the medium. The pilot is powered by a peristaltic pump (GILSON™ Model minipuls 2) connected to a feed tank with a capacity of 30 L. The treated water is suctioned with a peristaltic pump (CEBILON Model Reverse Osmosis System) through a polyvinylidene fluoride (PVDF) microfiltration membrane from A3 GSmbH Germany. The Membrane Module contains 8 parallel plates spaced 12 mm apart. The plates were connected together and act as a single membrane module with a membrane effective area of 0.2 m2 and a cut-off of 0.14 μm. A flowmeter (PLATON ModelU-32703-50), is used to control flow at the exit of the membrane. A pressure sensor (KELLER MANNO 200 Model LEO 2) with an accuracy of 0.01 bar is used to measure the transmembrane pressure (PTM) [9-11].
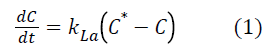

Figure 1. Experimental set-up: Bioreactor membrane.
Where C* represents oxygen solubility and C is the oxygen concentration in the liquid. Assuming the liquid phase is homogeneous and C0 represent oxygen concentration at t=0, the integration of the previous equation leads to:
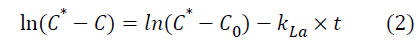
The volumetric mass transfer coefficient can now be determined by plotting ln (C*-C) against time (t).
Measuring the diameter of bubbles
During their training, the bubbles are photographed with a fast camera Kodak. For each operating condition, 20 bubbles were measured in order to calculate the average diameter. This number of bubbles is sufficient to represent the population of the bubbles studied [1,12]. The extension factor is calculated using an object, so we know the actual diameter according to equation 3:

This factor will be used to determine the actual size of the bubbles. Two forms of bubbles are generated according to the gas flow (spheres and or ellipsoids).
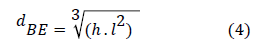
The equivalent diameter of the ellipsoidal shape is defined by equation 4 [13]. For each bubble, the length (L) and height (h) were noted:
Measurement of the interfacial area
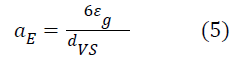
Knowing the size of the bubbles and the gaseous retention, it is possible to evaluate the specific interfacial zone as given by equation 5:
Condition of study
In this study, several conditions were studied namely:
Variation in temperature (25°C, 30°C, 35°C, 40°C and 45°C).
Variation in the composition of the medium (osmosis water, ammonium formate solution, ammonium formate solution +salt).
Results and Discussion
Gas retention
The gas retention  makes it possible to identify the different
types of flow regime likely to prevail in the reactor according to
the hydrodynamic conditions imposed and gives us more
information on the mixing intensity within the reactor as shown
in Figure 2 below.
makes it possible to identify the different
types of flow regime likely to prevail in the reactor according to
the hydrodynamic conditions imposed and gives us more
information on the mixing intensity within the reactor as shown
in Figure 2 below.

Figure 2. Variation of gas retention as a function of aeration rates.
Figure 2 shows two phases. The first phase which is between (3-10 mL/S), has a proportional relationship between the superficial gas velocity and gas retention. The linear profile on this portion would translate according to [14-16], a homogeneous regime that is characterized by a dispersion of the gas in the liquid in the form of small bubbles. Note that whatever the experimental conditions, gas retention increases linearly with the airflow. This is explained by the fact that the higher the flow, the more the quantity of dissolved air. The increase in gas retention with the flow of gas is the unanimity of researchers working in this field [2,17-19]. In the second phase, the regime becomes heterogeneous without the transition phase for solutions of ammonium formate, and ammonium formate +minerals. The dispersion of the gas during this regime is in form of bubbles of larger sizes and highly variable. This regime is characterized by poor gas dissolution and high energy consumption. For the synthetic effluent, after the homogeneous regime, we observe a regime transient characterized by an almost flat profile of gas retention in this profile [15] shows that as the heterogeneous diet the dissolution of air is limited by the presence of large bubbles.
Bubbles diameter
Figure 3 shows the relation between the mean diameter of the air bubbles and the gas flow for the different liquids studied. First, this figure highlights the increase in bubble diameter with the gas flow. This result is in agreement with the work [12] which explains this phenomenon by the coalescence of the bubbles which increases with the flow of gas. But the diameter of air bubbles in water is greater than that observed for other solutions, due to the presence of molecules other than water molecules that will reduce the coalescence of air bubbles in the medium.

Figure 3. Variation of bubble diameter as a function of gas flow.
The differences in bubble diameter are directly related to the static surface tension values of each medium [20]. This shows that a modification of the medium affects the reactions at the interfaces and knowledge of the interfacial surface is necessary in order to elucidate the impact of this phenomenon.
Interfacial area of the bubbles
The variations of the interfacial surface area with the flow of gas are shown in Figure 4 for the different liquids studied.Whatever the liquid, the interfacial surface increases approximately linearly with the gas flow. But the level observed from 10 mL/S of airflow is caused by the coalescence phenomena that will cause a decrease in the interfacial area which suggests that there is a threshold or the airflow becomes rather negative for the exchanges between both phases. But unlike Figure 3, the interfacial area of the water is lower than the other solutions studied. This permits us to say that the smaller the size of the air bubbles, the higher the interfacial area. This increase in the interfacial area is caused by the presence of molecules (active tension) that affect the phenomenon of bubble formation and interfacial area.

Figure 4. Change in the interfacial area of the bubbles as a function of the gas flow.
Transfer coefficient
Figure 5 shows the relationship between the variation of the volume transfer coefficient and the gas flow rate for the different liquids studied. A first observation emerges the volumetric mass transfer coefficient increases with the gas flow which is in agreement with the literature. But the mass transfer coefficients of synthetic effluent are lower than the other three liquids although the size of the air bubbles is small compared to the osmosis water or a high interfacial surface area. These results are contradictory to those found by Duran C et al., Xu Y et al., and Ruenngam D et al., [2,18,20]. This can be explained by the presence of surfactants in view of the composition of the rubber effluent that contains fatty acids.

Figure 5. Variation of the volume transfer coefficient of the bubbles according to the flow of gas.
Surfactants and other ions at the interface of the bubbles that disrupt the mass transfer, modifying the composition or the thickness of the liquid film around the air bubbles thus reducing the diffusivity of the gases and the resistance of the interface gas-liquid gas transfer [21].
Influence of temperature on overall gas retention
The temperature influences the dissolution of air in the medium as we see in the figure below.
Figure 6 above shows the variation of gas retention as a function of temperature. The observation shows that the temperature also influences this retention and as a matter of fact the more the temperature is increased, so does the gas retention, this can be explained by the increase in the viscosity of the water. Indeed, the apparent viscosity of air causing a slowdown of the rate of the gas bubbles and therefore leading to an increase in the residence time of the bubbles and the gas volume present in the medium. A comparison of the gas retention in the three liquids (osmosis water, ammonium formate solution, formate+salt solution, synthetic rubber effluent) shows that the gas retention increases with the composition of the medium. This increase in retention can be explained by a decrease in the size of the bubbles, which results in a longer residence time of the gas in the reactor [22]; think that bubbles burst because they follow mechanical shock molecules in the water. Since the rate of rising of small bubbles is lower than that of large bubbles, the residence time is, therefore, higher, which has an effect to increase gas retention.

Figure 6. Variation of gas retention with different temperatures (25°C, 30°C, 35°C, 40°C and 45°C) to the different composition of the solution (osmosis water, ammonium formate solution, formate +mineral solution, synthetic rubber effluent) at a constant gas flow rate.
Influence of the temperature on the transfer volume coefficient
We note from Figure 7 that the transfer volume coefficients decrease with temperature.

Figure 7. Variation of the transfer volume coefficient with different temperatures (25°C, 30°C, 35°C, 40°C and 45°C) to the different composition of the solution (osmosis water, ammonium formate solution, formate+mineral solution, synthetic rubber effluent) with constant gas flow rate.
The decrease can be caused by the increase in the viscosity of the gas, which increases with temperature, thus favoring the coalescence of the air bubbles, which leads to an increase in the size of the bubbles and consequently a reduction of the interfacial air exchange of air bubbles and therefore the volume coefficient of the transfer. The volume transfer coefficient is more affected by the effluent because in this medium we have the presence of free fatty acids which are surfactants and will trap the air bubbles that will diffuse very slowly in the medium [18,22] shows that the presence of surfactants at the interface can have effects on the behavior of the bubbles generated and on the associated training frequency even if the concentration is very low. Indeed, these surfactants can then delay the transfer of material from the bubble to the liquid by two different mechanisms: the delay of the renewal of the gas/liquid interface and the constitution of a barrier for the passage of gaseous molecules at the interface [23-25] confirmed this in their work.
On the other hand, a comparison of the transfer coefficient of ammonium formate in the presence and absence of salt shows that the salt allows an increase in the transfer coefficient. Indeed the presence according to Alves SS et al., Linek V et al., Karimi A et al., [26-28] who studied the influence of salinity on the bubble size distribution in an air-lift type reactor. They found that the average bubble diameter appears to be lower in saltwater than in pure water and explained that bubble sizeis controlled by two factors. The first is the hydrophilic repulsive force that inhibits the coalescence of the bubbles while the second is the Laplace pressure that controls the coalescence and rupture of the bubbles. The decrease in the size of the air bubble thus favors the increase of the interfacial air between the air bubbles and the liquid, hence its diffusion in the water.
Correlation between gas retention, volume transfer coefficient and temperature
We present in this study the results with the rubber effluent. It appears from Figure 8 that the gas retention is inversely proportional to the volume transfer coefficient, this as a function of the temperature. It will then be necessary to find compromise between the temperature, the volume transfer coefficient and the gaseous retention so as to reduce the energy consumed and in our case, the compromise is around 30°C where both curves at 35°C, although the gaseous retention curve and the transfer volume coefficient intersect at one point. Nevertheless, this temperature is above the range where our yeast strains have optimal growth. But for better profitability, it would be wise to take the point of intersection between the two curves so as to reduce the energy dependence.

Figure 8. Relationship between mass transfer coefficient and gas retention at different temperatures.
Conclusion
Membrane bioreactors are processes that allow reuse of water after treatment. But these processes are energy-consuming. In order to reduce this energetic consumption, an optimization of the aeration and the hydrodynamics of the system is necessary. This study shows that the mixing time varies from one point to another and recirculation of the mixture reduces the mixing time. One of the positions is limiting, with a mixing time of 115 s without circulation and 65 s with circulation. The more the medium becomes rich in organic substances, the gas retention increases and KLa decreases. The homogeneous fine-bubble regime is obtained for an airflow rate of between 3 and 10 mL/S of aeration. Beyond this flow rate, the regime becomes heterogeneous without a transition phase for the ammonium formate solutions, and the synthetic effluent. At 30°C, the KLa of the ammonium formate solution is 0.83 greater than 0.62, representing the KLa of the rubber effluent. There is a correlation between temperature, KLa and gas retention.
Acknowledgments
The authors would like to thank Marc Heran for the donation of the membrane support material.
REFERENCES
- Besagni G, Inzoli F, De Guido G, Pellegrini LA. The dual effect of viscosity on bubble column hydrodynamics. Chem Eng. 2017;158:509-538.
- Duran C, Fayolle Y, Pechaud Y, Cockx A, Gillot S. Impact of the properties of activated sludge on their rheological behavior and on the transfer of oxygen in aerated bioreactors. Chem Eng Sci. 2013;8.
- Krzeminski P, van der Graaf JH, Lier JB. Membrane bioreactors (MBRs): Activated sludge filterability and full-scale MBR functioning. 2013;48:341-350.
- Mulder JW. Operational experiences with the hybrid MBR Heenvliet, a smart way of retrofitting. InProceedings of 2009.
- Gillot S, Capela-Marsal S, Roustan M, Héduit A. Predicting oxygen transfer of fine bubble diffused aeration systems-model issued from dimensional analysis. Water Res. 2005;39:1379-1387.
- Qing Z, Rongle X, Xiang Z, Yaobo F. Simulation and optimization of airlift external circulation membrane bioreactor using computational fluid dynamics. Water Sci Technol. 2014;69:1846-1852.
- Wang Y, Brannock M, Leslie G. Diagnosis of membrane bioreactor performance through residence time distribution measurements-a preliminary study. Desalination. 2009;236:120-126.
- M. Dessislava, I. Veselin. Influence of geometrical and operational parameters on the performance of bubble reactor with immersed membrane module. Materials, Methods and Technologies. 2018;12:275-285.
- Ferreira A, Ferreira C, Teixeira JA, Rocha F. Temperature and solid properties effects on gas-liquid mass transfer. Chem Eng. 2010;162:743-752.
- García-Ochoa F, Gómez E. Mass transfer coefficient in stirred tank reactors for xanthan gum solutions. Biochem Eng. 1998;1:1-10.
- Measurement of Oxygen Transfer in Clean Water. ASCE. 1993.
- Painmanakul P, Loubière K, Hébrard G, Mietton-Peuchot M, Roustan M. Effect of surfactants on liquid-side mass transfer coefficients. Chem Eng Sci. 2005;60:6480-6491.
- Gómez-Díaz D, Gomes N, Teixeira JA, Belo I. Oxygen mass transfer to emulsions in a bubble column contactor. Chem Eng. 2009;152:354-360.
- Ratkovich N, Hunze M, Nopens I. Hydrodynamic study of a hollow fiber membrane system using experimentally and numerically derived surface shear stresses. Multiphas Sci Tech. 2012;24.
- Besagni G, Inzoli F, De Guido G, Pellegrini LA. The dual effect of viscosity on bubble column hydrodynamics. Chem Eng Sci. 2017;158:509-538.
- Fransolet E, Crine M, L' Homme G, Toye D, Marchot P. Analysis of electrical resistance tomography measurements obtained on a bubble column. Meas Sci Technol. 2001;12:1055.
- Kim JY, Kim B, Nho NS, Go KS, Kim W, Bae JW, et al. Gas holdup and hydrodynamic flow regime transition in bubble columns. J Ind Eng Chem. 2017;56:450-462.
- Xu Y, Zhu N, Sun J, Liang P, Xiao K, Huang X. Evaluating oxygen mass transfer parameters for large-scale engineering application of membrane bioreactors. Process Biochem. 2017;60:13-18.
- K. Loubiere. Growth and detachment of bubbles generated by rigid and flexible orifices in Newtonian liquid phases: experimental study and modeling. 2002;663.
- Ruen-ngam D, Wongsuchoto P, Limpanuphap A, Charinpanitkul T, Pavasant P. Influence of salinity on bubble size distribution and gas-liquid mass transfer in airlift contactors. Chem Eng. 2008;141:222-232.
- Fayolle Y, Moretti P, Canler JP, Gillot S. Modeling of the transfer of oxygen in clear water in a biological reactor with a fluidized bed using dimensional analysis. 2013;104.
- Dumont E, Delmas H. Mass transfer enhancement of gas absorption in oil-in-water systems: a review. Chem Eng Process. 2003;42:419-438.
- Lazarova V, Meyniel J, Duval L, Manem J. A novel circulating bed reactor: hydrodynamics, mass transfer and nitrification capacity. Chem Eng Sci. 1997;52:3919-3927.
- Xie F, Chen W, Wang J, Liu J. CFD and experimental studies on the hydrodynamic performance of submerged flat-sheet membrane bioreactor equipped with micro-channel turbulence promoters. Chem Eng Process. 2016;99:72-79.
- Yang J, Vedantam S, Spanjers H, Nopens I, van Lier JB. Analysis of mass transfer characteristics in a tubular membrane using CFD modeling. Water Res. 2012;46:4705-4712.
- Alves SS, Orvalho SP, Vasconcelos JM. Effect of bubble contamination on rise velocity and mass transfer. Chem Eng Sci. 2005;60:1-9.
- Linek V, Kordač M, Fujasová M, Moucha T. Gas-liquid mass transfer coefficient in stirred tanks interpreted through models of idealized eddy structure of turbulence in the bubble vicinity. Chem Eng Process. 2004;43:1511-1527.
- Karimi A, Golbabaei F, Mehrnia MR, Neghab M, Mohammad K, Nikpey A, et al. Oxygen mass transfer in a stirred tank bioreactor using different impeller configurations for environmental purposes. J Environ Health Sci Eng. 2013;10:6.
Citation: Nsoe MN, Kofa GP, Marc H, Ndi KS, Kayem GJ (2019) Hydrodynamic Study and Influence of Physicochemical Parameters on Gas Retention in a Submerged Membrane Bioreactor. J Membr Sci Technol 10:201. doi: 10.35248/2155-9589.20.10.201.
Copyright: © 2019 Nsoe MN, et al. This is an open-access article distributed under the terms of the Creative Commons Attribution License, which permits unrestricted use, distribution and reproduction in any medium, provided the original author and source are credited.